Paradip Phosphates Ltd (NSE: PARADEEP)Paradip Phosphates Ltd has delivered a massive 180% return in recent months, rallying sharply from its previous lows. The price has now reached the critical 0.618 Fibonacci extension level at ₹218, where some profit booking may occur.
Key levels to watch:
• Resistance: 0.786 at ₹234.90, 0.886 at ₹244.93
• Support: 0.382 at ₹176.31, 0.5 at ₹158.53, 0.618 at ₹140.74
• The price may retrace towards the 20 EMA as momentum cools off.
• Strong recent earnings momentum (+464% EPS YoY), but caution is advised in the short term after such a steep rally.
Disclaimer: This post is for learning possible,Not an investment advice. Do your own research before making any trading decisions.
Candlestick Analysis

ETHUSD | Technical Analysis 10/08/2025Hi,
ETH can create new all time high from 4195 to 4365+ (200% supply zone)
Disclaimer: This is only for educational purpose.
Thanks

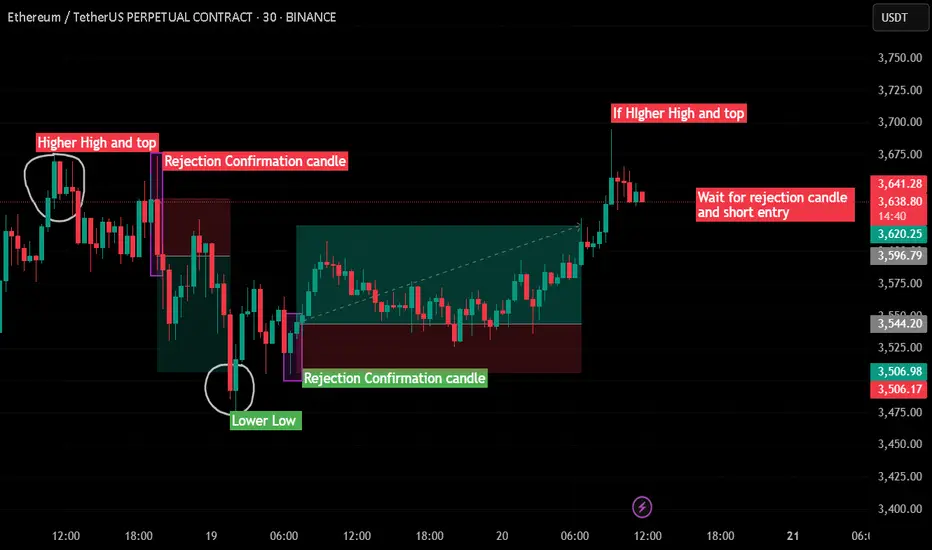
Trend Reversal Rejection Strategy | Higher High + Candle Confirm🔍 Idea Summary:
This strategy focuses on identifying trend reversal zones using classic Higher High (HH) and Lower Low (LL) structures followed by rejection confirmation candles.
🔻 Short Setup:
Price forms a Higher High.
Wait for a rejection candle (long wick, body closes inside previous range).
Confirm structure break and take short entry on confirmation.
✅ Example: On the left side of the chart, price printed a HH, followed by a strong rejection candle. That led to a clean move downward.
🔺 Long Setup:
Price forms a Lower Low.
Watch for a rejection candle near key support.
Enter long trade after confirmation.
✅ Example: Mid-chart shows price breaking to LL, then instantly rejecting with a strong bullish candle. Followed by a sustained move up.
🔴 Current Price Action:
Price is testing a potential new Higher High.
📌 Strategy suggests: Wait for a bearish rejection candle before shorting!
📈 Strategy Benefits:
Avoids impulsive entries
Combines structure with candle logic
Great for reversal traders and range scalpers
🔥 Like & follow for more real-time trading ideas!
💬 Drop your thoughts or questions below – let’s grow together, traders! 💪
#ETHUSDT #PriceAction #RejectionCandle #TrendReversal #SupportResistance #Scalping #TradingStrategy #Crypto #ChartPatterns #TechnicalAnalysis
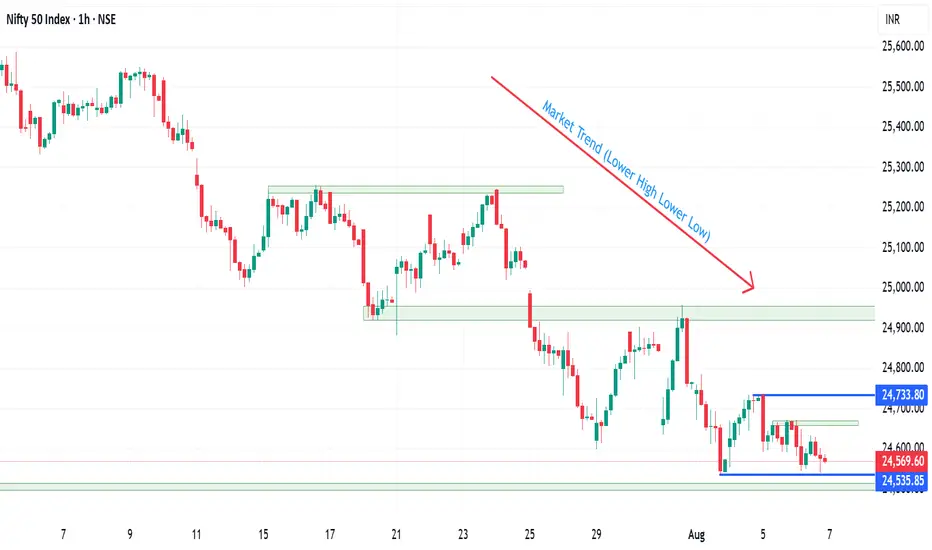
Expecting a nice move on Nifty weekly expiry 07/08/2025.Nifty for the last three days is forming an inside candle, chances of it moving either side is high.
If the market starts trading below 24510, it may test the pervious support around 24230 and another levels below it.
On the higher side, trade can only be initiated only once 24650 levels are taken out.
In case of a gap down wait for the retest of the support zone that will act as the resistance now. Enter trade only once the setup triggers.
Major resistance levels :- 24660, 24733
Support levels :- 24500 (psycological level), 24228
Hourly Moving averages are above the closing price while the Daily 100 EMA is around the closing leves, which can act as the support else it can come to test the 200 EMA (24200).
Wait for the price action near the levels before entering the market.
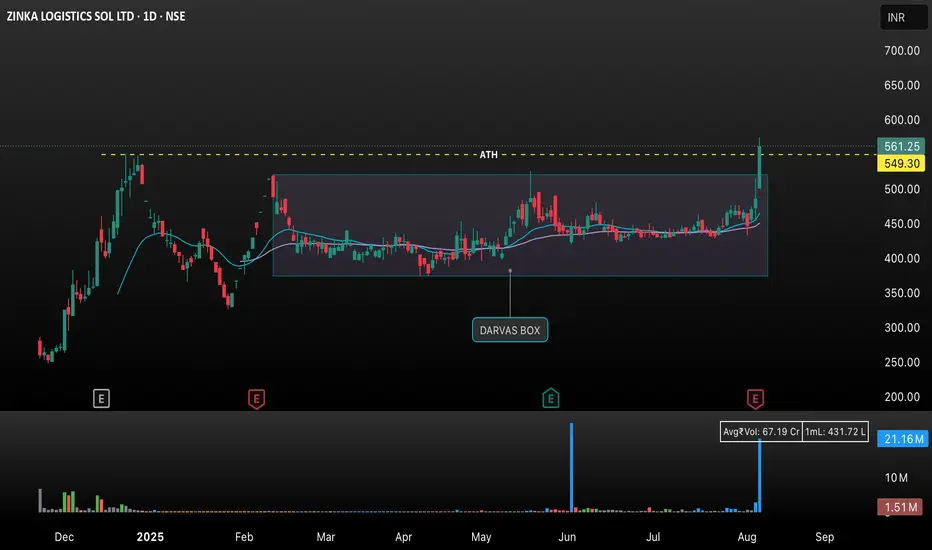
Zinka Logistics Sol Ltd : Daily Chart Breakout from Darvas BoxThis chart shows the daily price action of Zinka Logistics Sol Ltd (NSE) with a focus on recent technical developments:
• Darvas Box Pattern: For several months, the stock price traded sideways within a well-marked “Darvas Box” range, approximately between ₹400 and ₹549.30. This represents a consolidation phase where the stock found both support and resistance within this zone.
• All-Time High Resistance: The yellow dashed line at ₹549.30 marks the previous all-time high (ATH) level, acting as a critical resistance point.
• Breakout and Volume Surge: On the latest trading day, the stock price sharply broke above the ATH resistance, closing at ₹561.25—a gain of 15.66%. This move was supported by a significant spike in trading volume, as shown at the bottom of the chart, which reinforces the breakout’s strength.
• Bullish Signal: Such a breakout from a long consolidation within a Darvas Box, particularly on elevated volume, is typically interpreted by traders as a strong bullish signal, suggesting the start of an upward trend.
• Indicators: The chart also includes a moving average line (light blue) that underscores recent momentum and trend direction.
XAUUSD | Technical Analysis for 06/08/2025Hi,
A short upside move is expected till 3380. It is taking rejection from 0.75 level of last swing.
Disclaimer: This is only for educational purpose.
Thanks

XAUUSD | Techinical Analysis for 08/06/2025Hi,
The next possible move in gold can be downside after a small bounce till 3378 to 3382. The move can go upto 3370, 3365, 3360.
Disclaimer: This is only for educational purpose.
Thanks

XAUUSD | Technical Analysis for 08/05/2025Hi,
I am seeing a bounce up side in gold till 3365 to 3372. Corrective wave can start from here.
Disclaimer: This is only for educational purpose.
Thanks

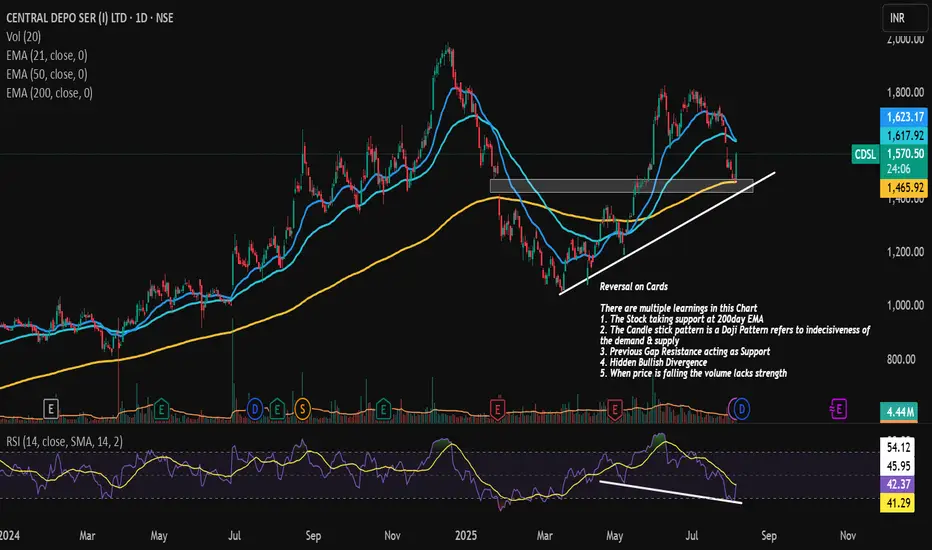
CDSL Reversal !!!CDSL is on the verge or Reversal or Temporary Pull back
There are multiple learnings in this Chart
1. The Stock taking support at 200day EMA
2. The Candle stick pattern is a Doji Pattern refers to indecisiveness of the demand & supply
3. Previous Gap Resistance acting as Support
4. Hidden Bullish Divergence
5. When price is falling the volume lacks strength
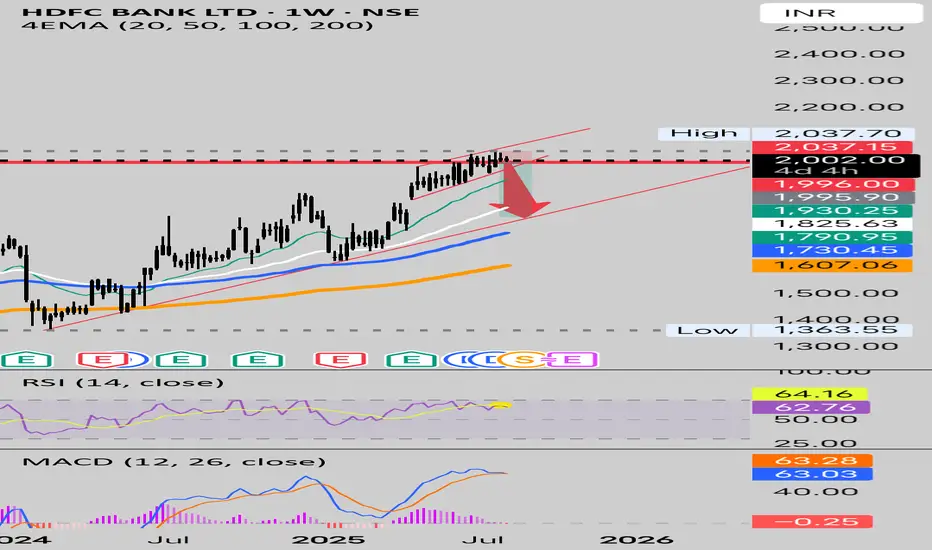
Hdfc gearing up for pullback 1900 and more to followHDFC bank has enjoyed Almost 6 months of uptrend.
Looks over stretched without a pullback
1900 1850 1800 could follow in days to come.
RSI on Weekly showing Bearish Divergence..
Below 1996
Shorts could get aggressive
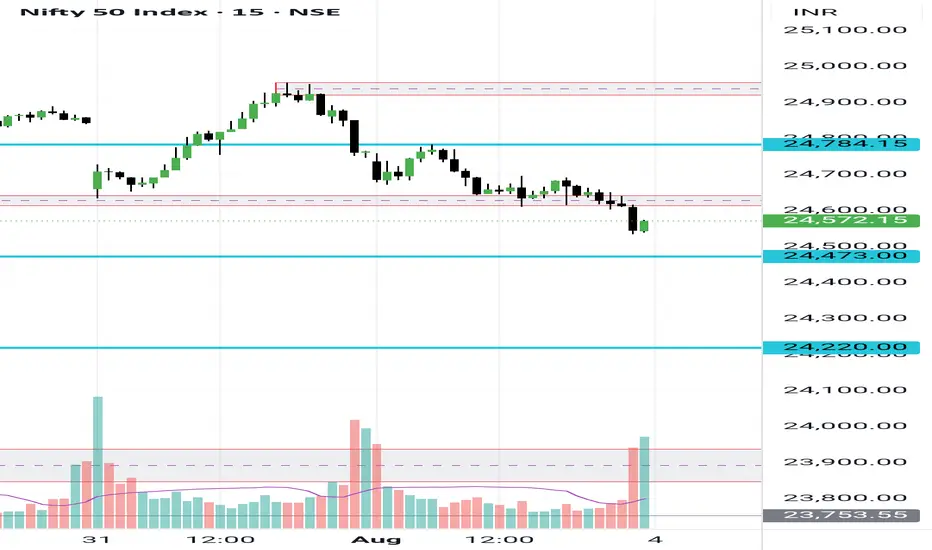
Nifty levels for next week (4th August 2025 onwards)Nifty is in a clear downtrend, important levels are marked on the chart.
A break below 24550 may bring the 24460 level and a break further may show the 24300 levels too on the chart. It may not be seen in a single day but can be visible in few trading sessions.
An up move is possible only above 24630 level that too if price sustains above this level else it may bring more selling from upper levels..
Let's see how it turns out..
Positional or Long-term Opportunity in CampusGo Long @ 291.55 for Targets of 367.9, 418.8, and 469.7 with SL 266.1
Reasons to go Long :
1. On weekly timeframe stock gave Trendline breakout (marked with red color).
2. If we draw Fibonacci retracement from the recent swing low (A) to the swing high (B) then the stock took support from the 0.382 Fibonacci level.
3. In addition to this, the stock formed a Bullish Engulfing Pattern (marked with a orange color) around 0.382 Fibonacci level.

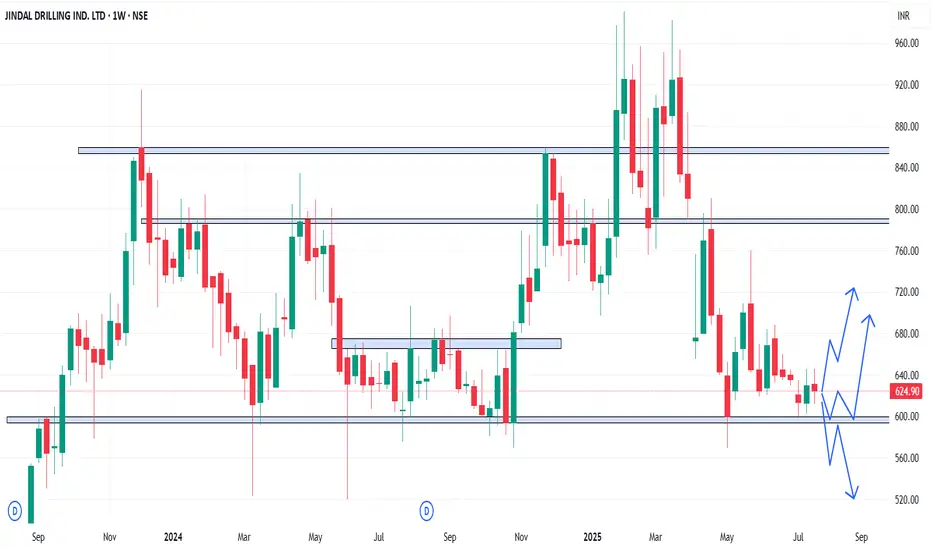
JINDRILL - Weekly AnalysisIn the Weekly Chart of JINDRILL ,
we can see that, it is at decision making point.
Possible momentums are shown in chart.
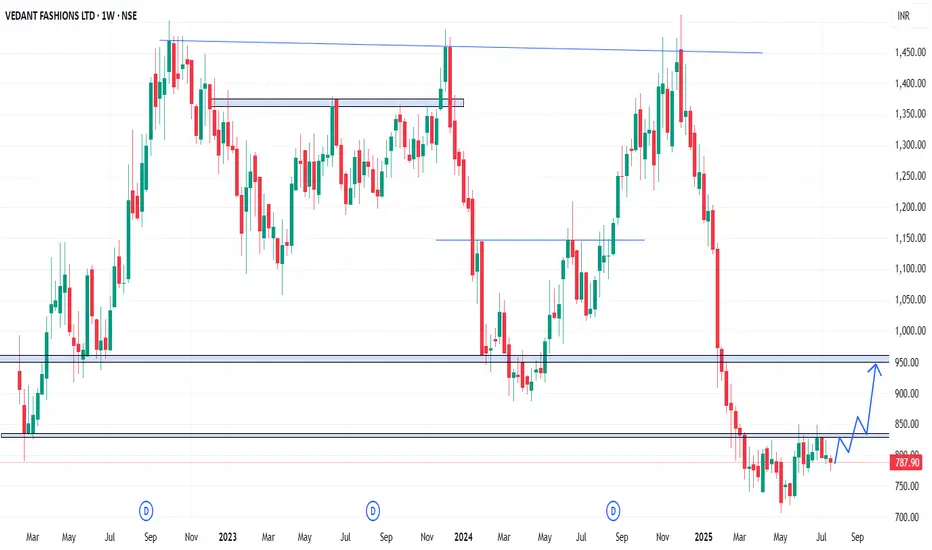
MANYAVAR - Weekly AnalysisIn the Weekly Chart of MANYAVAR ,
we can see that, it has created a Hammer candle.
Even after the market fall, we did not see strong selling.
Expected momentum is shown in chart.
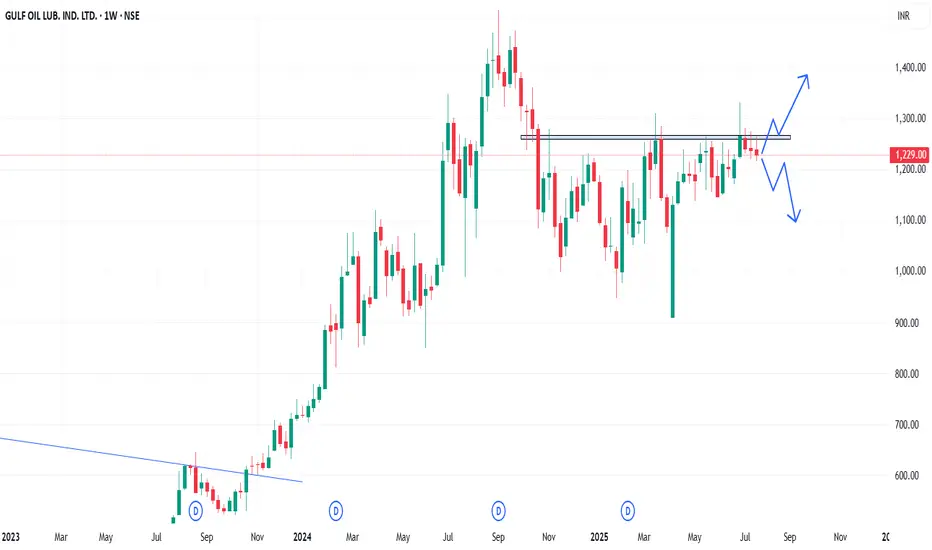
GULFOILLUB - Weekly AnalysisIn the Weekly Chart of GULFOILLUB ,
we can see that, it is at decision making point.
Possible momentums are shown in chart.
LGBBROSLTD - Weekly AnalysisIn the Weekly Chart of LGBBROSLTD ,
we can see that, it is at decision making point.
Possible momentums are shown in chart.

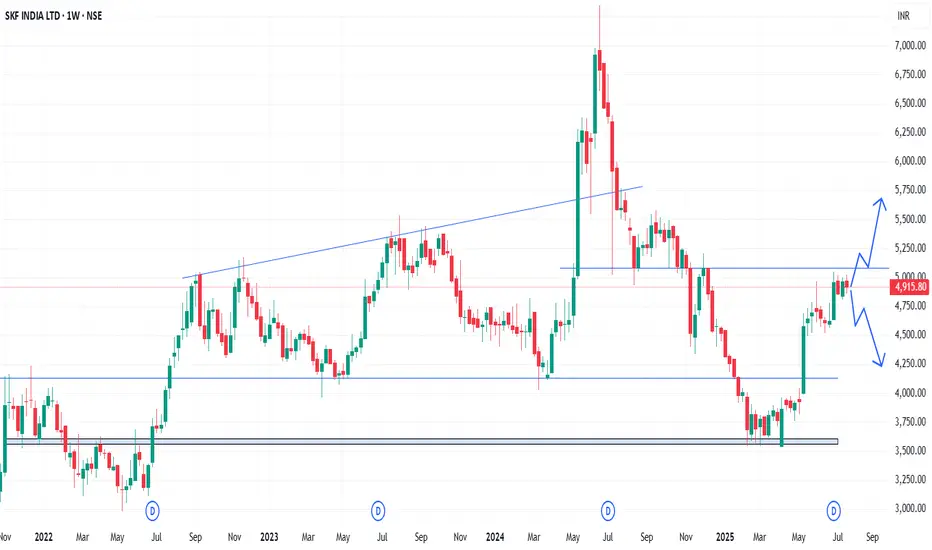
SKFINDIA - Weekly AnalysisIn the Weekly Chart of SKFINDIA ,
we can see that, it is at decision making point.
Possible momentums are shown in chart.
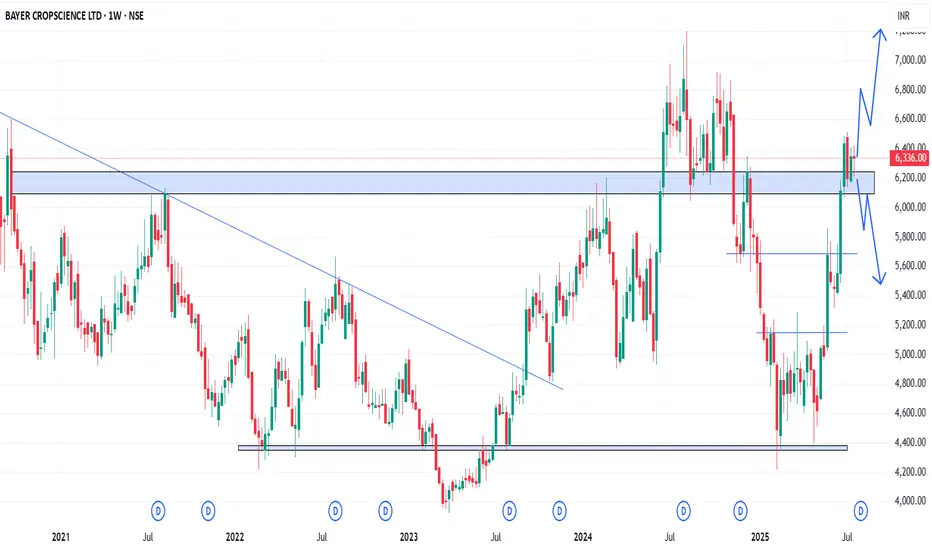
BAYERCROP - Weekly AnalysisIn the Weekly Chart of BAYERCROP ,
we can see that, it is at decision making point.
Possible momentums are shown in chart.
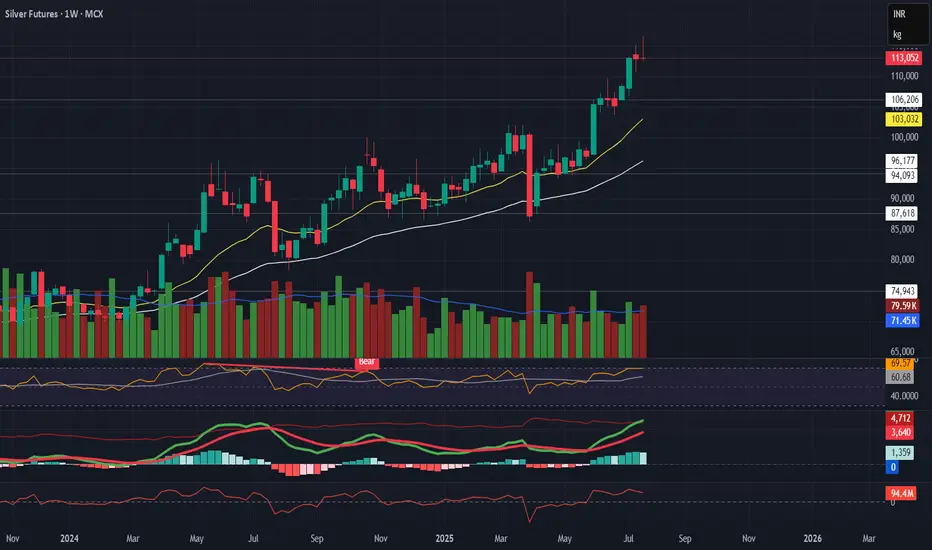
Silver Futures – Bearish Reversal in Progress
Silver Futures – Bearish Reversal in Progress
Description:
Silver is showing a strong technical reversal across timeframes. Short-term correction looks likely.
Technical Setup:
Daily:
Evening Star + Bearish Engulfing
Flattening EMAs
Volume and MACD confirming momentum slowdown
Weekly:
Gravestone + Southern Doji near resistance
RSI close to overbought
EMA slope still up, but weakening signs visible
Macro View:
No major bearish macro trigger — Fed dovish, USD stable, inflation low.
→ This is likely a technical pullback, not a fundamental reversal.
Trade Plan:
🔻 Breakdown Level: ₹114,560
🎯 Targets: ₹107K → ₹101K → ₹93K
🛑 SL: ₹116,000+
Caution: No position without breakdown confirmation.
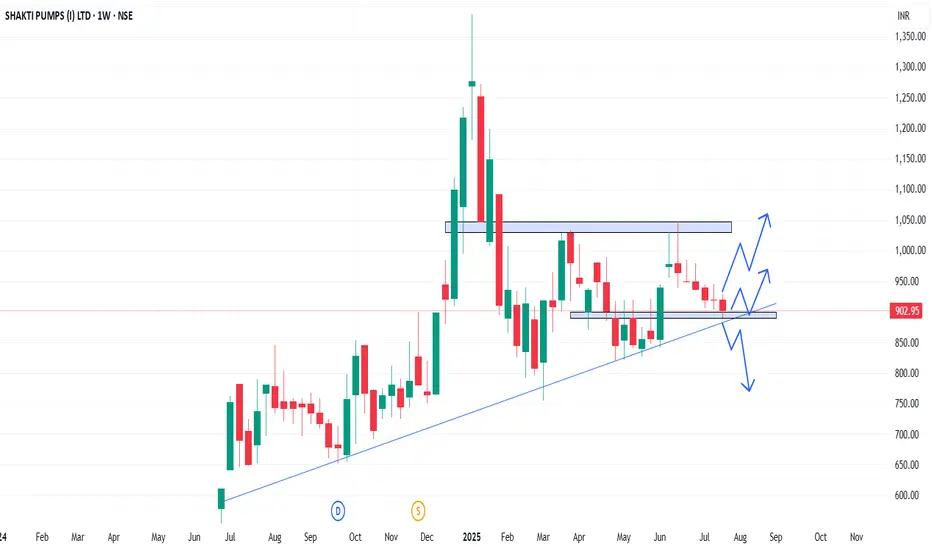
SHAKTIPUMP - Weekly AnalysisIn the Weekly Chart of SHAKTIPUMP ,
we can see that, it is at decision making point.
Possible momentums are shown in chart.
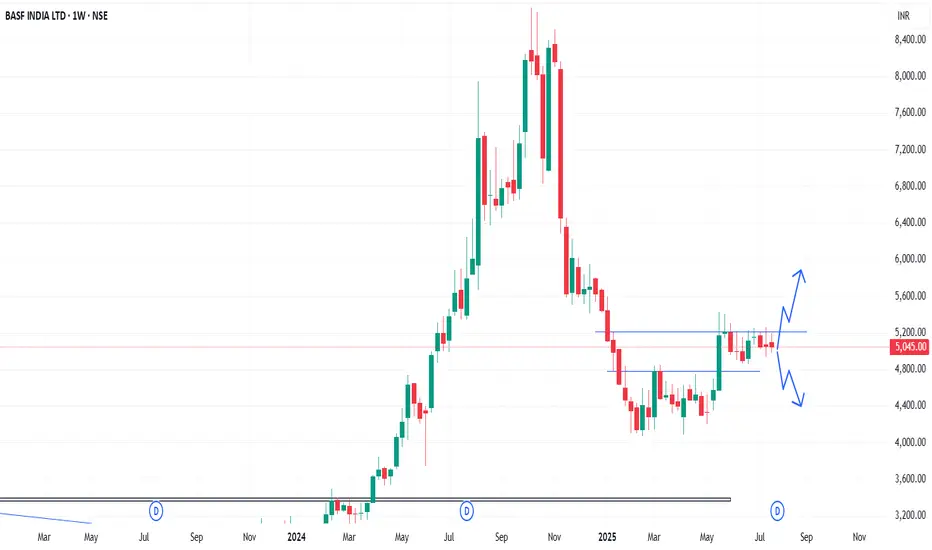
BASF - Weekly AnalysisIn the Weekly Chart of BASF ,
we can see that, it has consolidated near trendline.
Also, it is at decision making point.
Possible momentums are shown in chart.
Sbilife Getting ready for the rally ahead?!!!Chart patterns suggest me the above titled opinion
1. Weekly time frame shows a three white soldiers (month of april 2025) with good volume support....now the consolidation happening
2. In daily time frame, it is travelling in a expanding channel pattern , currently at the support line at the bottom
3. We need a confirmation for the rally with a Breakout candle....which we can expect during the result release.
4.If we make our entry now, we can make our stoploss as daily candle close out of the channel
5. Best entry is to wait for the Breakout and enter with SL below the breakout candle
6.Target levels as mentioned in the chart.
With strong fundamentals and decent valuations, Sbilife is one of the best options for long term bet in the insurance sector!!!
This is just my opinion ....not a tip nor advice..
Thank you!!!!

Nifty Support & Resistance Zones – 24th July 2025Based on today’s price action and high-probability cluster zones, here are the key levels to watch for tomorrow:
Resistance Zones:
25516 – 25523
25408 – 25410
25314 – 25317
25228
Support Zones:
25140 – 25150
25054 – 25060
24931 – 24939
24823 – 24864
Technical Outlook:
Nifty successfully broke above the 21 EMA of the Daily Timeframe, indicating a shift in short-term momentum back in favor of buyers. This breakout was supported by strong bullish candles and higher closes throughout the session.
As long as price sustains above 25140, the upward momentum may extend toward 25314 and 25408. A failure to hold above 25054 would weaken the structure and invite a retest of lower support zones.
Monitor price behavior around 25228 for intraday breakout or rejection opportunities.
Watch these zones closely for potential price reactions, breakouts, or reversals. Use them with intraday confirmation and volume analysis for effective trade setups.
