Weekly CT Breakout + 200EMA Flip | GALAXYSURF Structure📉 Main CT Line (Dotted White)
A well-defined counter-trendline finally gave way after weeks of price compression. The breakout was clean, with a strong bullish candle closing decisively above it.
📊 Volume Confirmation
Breakout candle posted a solid spike in volume — the highest weekly volume in months. 💥
📈 200 EMA Broken (Blue Line)
Price has also cleared the 200-week EMA, a key dynamic resistance, now potentially flipping to support. 📉
🟧 Higher Timeframe Supply (Orange Line) / ⚪ (White Lines)
The breakout candle has also stepped into a tight zone between Weekly + Monthly supply, marked by the orange line.
📌 As always, the chart tells the story. No predictions. No assumptions, just structure.
Candlestick Analysis

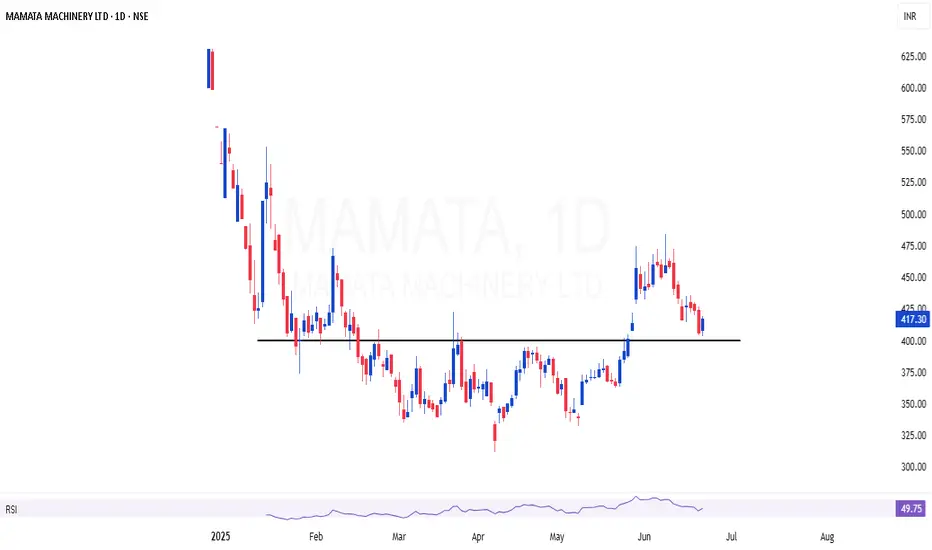
MAMATA | Breakout and retesting the area of valueMAMATA | Breakout and retesting the area of value
Valuation also looking good
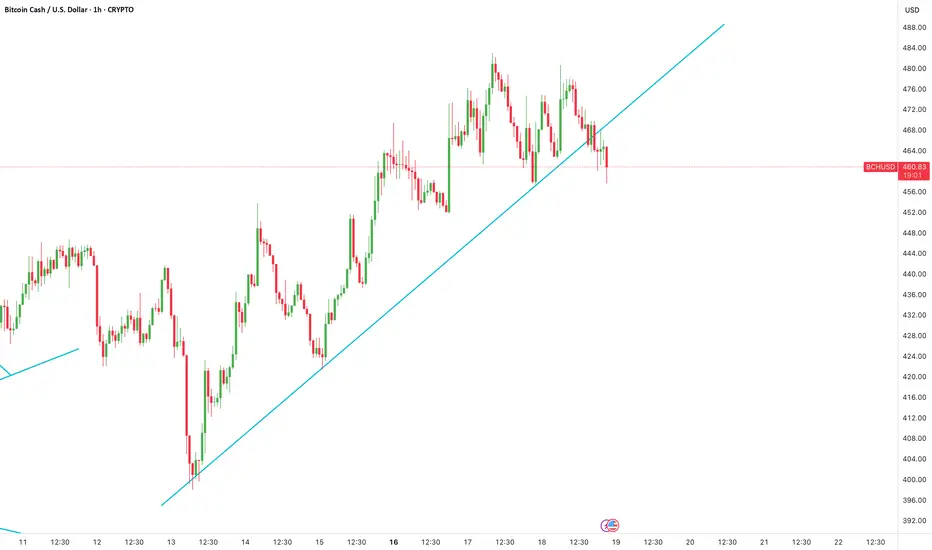
BCHUSD Trendline Breakdown and RetestBCHUSD has broken its trendline on the 1-hour timeframe and has retested with a large doji and a subsequent inside candle.
This is a great bearish signal with the SL of the high of the Retest/Doji candle.
My target will be at the 222-225 level which is second trendline point.
Bandhan Bank June Futures at a crucial zone.Bandhan Bank is at a crucial zone for continued upward momentum after a steep fall towards the support zone. The bullish momentum today has been pretty strong, although the price is coming at a halt near the 178-179 range, upon the break of 179.5 and upwards, I expect the price to continue upto 183, 188 in the coming 2 weeks, and 200, 212 (upon extreme optimism and market’s current momentum).
Buy trade executed at 173.5.

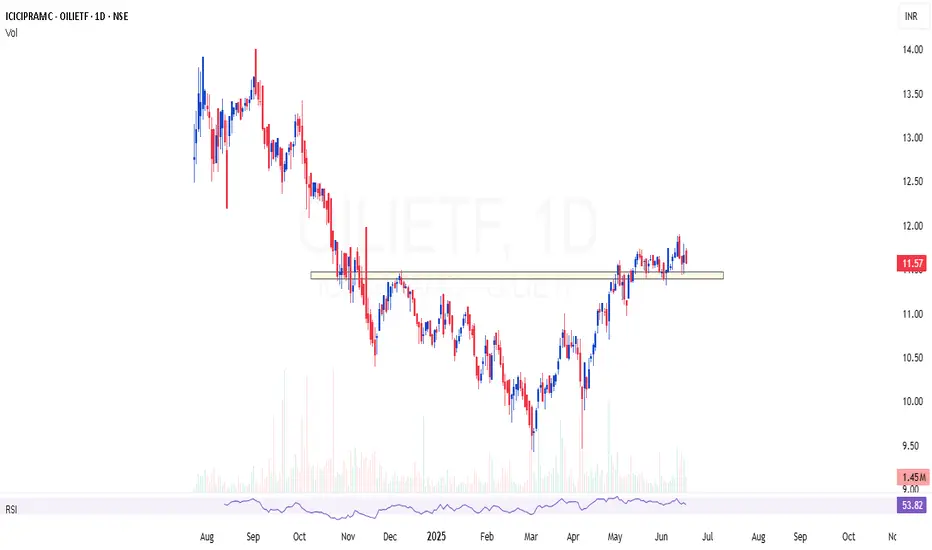
OILIETF | Good theme for current global sentimentOILIETF | Good theme for current global sentiment
The ETF has good volume to trade,
Portfolio consist of stable stocks that are fallen already
Trying to capture a 30% move in this ETF
Has good risk reward and momentum aswell
Relatively a stable bet
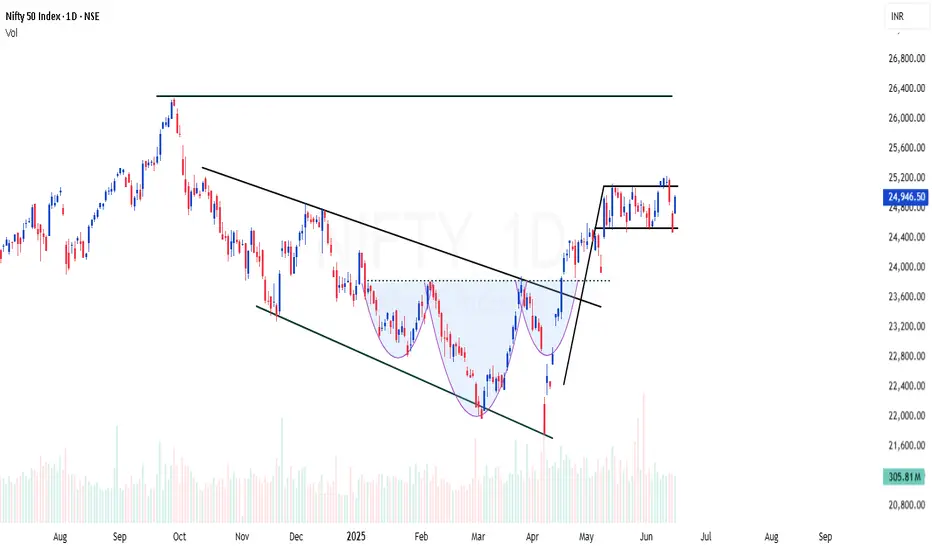
NIFTY | Back to back bullish patternsNIFTY showing back to back bullish signs
Channel breakout - Done
Inverted Head & Shoulder breakout (INHS) - Done
Now forming flag setup
NIFTY shows strength to move another 15% this year
Simplified Approach to read Candlesticks -Easy Candles ~ Part 1MARKETSCOM:OIL
Introduction
⦿ Candles form the basis of chart creation and analysis.
⦿ A weak foundation can destabilise your entire structure. This thread will clarify and simplify your understanding of price candles.
I use two types of candles on charts:
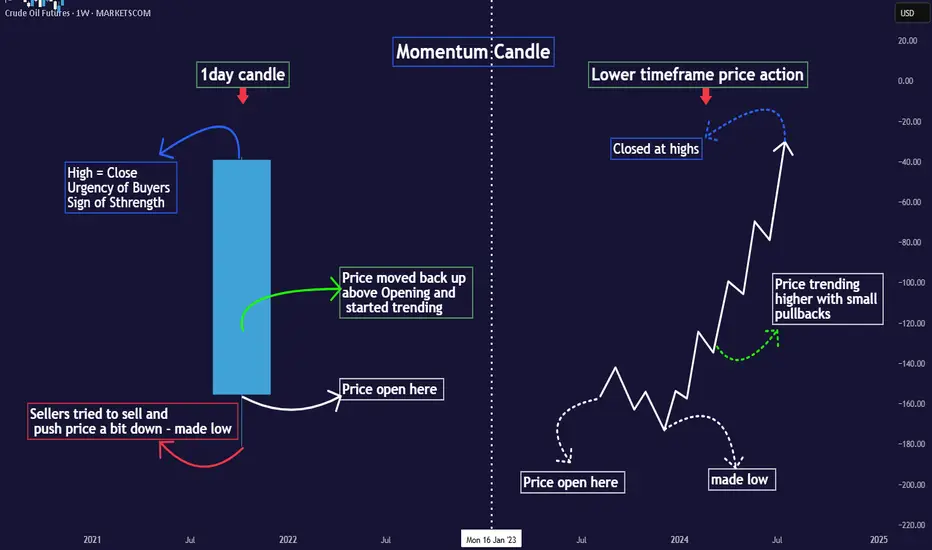
1. Momentum/trending candles
2. Ranging/trading candles
Understanding these eliminates the need to memorize complex candle names (e.g., Marubozu, Harami bullish) cause every candlestick pattern is formed with combination of these 2 candels only.
Definitions:
⦿ Momentum candle: Body >50% of total size
⦿ Range candle: Body <50% of total size
Decode Momentum Candle
⦿ Only Buyers here - Clear Trend
Decode Range Candle
⦿ Both Buyers & Sellers here - No Trend
⦿ Indecision mode among participants.
⦿ Understand what major players did in the last candle to predict their next move.
⦿ Don't just memorise candle names; grasp the psychology behind them.
⦿ I'll share the levels of candle strength to elevate your candle reading.
♦️Stay tuned and follow for more educational
content.
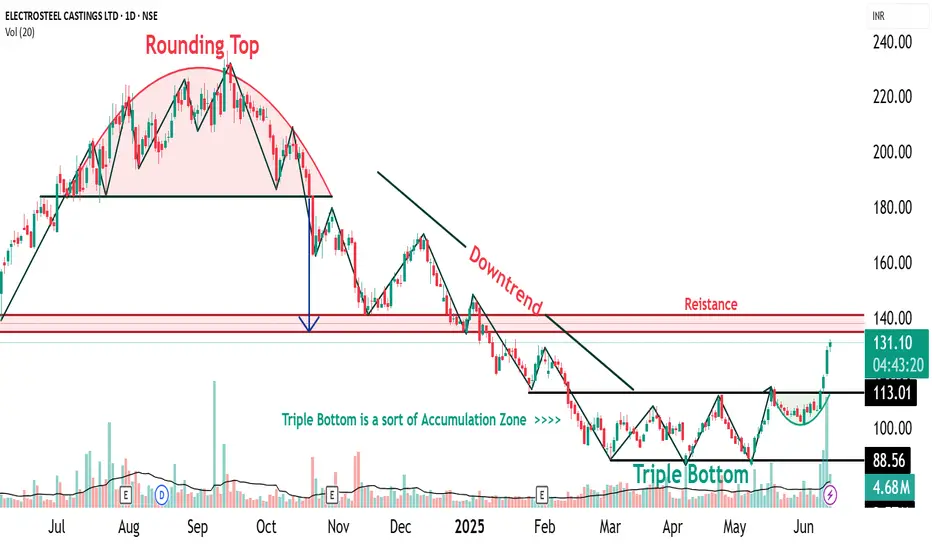
ELECTCAST Triple Bottom Pattern🔍 1. Understanding the Triple Bottom
The Triple Bottom is a classic bullish reversal pattern that typically forms after a prolonged downtrend or consolidation phase. It signifies strong buying interest at a consistent support level, leading to three distinct price lows (or “bottoms”) occurring near the same price zone.
📌 Key Characteristics:
Formation Time: Typically spans 2–6 months
Touchpoints: Three distinct lows formed at or near the same support level
Pattern Zone (for ELECTCAST): ₹87 – ₹88
Trade Entry: Entry is typically considered on a breakout above the neckline, which is the horizontal resistance connecting the interim highs between the bottoms. In this case, a breakout confirmation would be around ₹96.
Stop Loss (SL): Just below the third bottom, e.g., ₹85
Target: Based on pattern depth projection, conservative ₹104, aggressive potential up to ₹120–₹140, once momentum sustains
📉 2. Triple Bottom Formed at ₹87–₹88 Zone
Electrosteel Castings has tested the ₹87–₹88 level three times, showing that this price zone has acted as a strong accumulation support. The repeated defense of this level suggests significant buying interest by institutional players or informed investors.
1st Bottom: Initial rejection near ₹88
2nd Bottom: Retest with similar rejection zone
3rd Bottom: Confluence with bullish reversal candlestick (Morning Star)
The pattern is visually symmetric and clean, enhancing its reliability.
At the third bottom near ₹87, a Morning Star was observed, marking the first visual confirmation of bullish reversal. This adds significant strength to the pattern because the third bottom often acts as a psychological pivot point, triggering buying from traders watching for a reversal.
📈 3. Higher Top – Higher Bottom Structure Emerging
Following the Morning Star, the stock has started forming a higher bottom and higher top structure—a fundamental trait of an uptrend. However:
🟡 Caution: One more higher bottom formation is required to confirm the start of a sustainable uptrend.
Once the uptrend is firmly established, a close above ₹140 will act as a major breakout signal, potentially propelling the price toward new 52-week highs or an all-time peak.
🧠 4. Accumulation Zone and Triple Bottom – The Relationship
An Accumulation Zone is a price range where informed investors quietly accumulate shares over a period, usually when a stock is undervalued or consolidating.
🔗 Connection to Triple Bottom:
The Triple Bottom pattern often forms within the Accumulation Zone
Each dip to the support level attracts buyers, revealing hidden demand
The formation acts as a transition from accumulation to markup phase
The breakout from the Triple Bottom signals the end of accumulation and the start of an uptrend
Hence, the Triple Bottom is not just a technical pattern, but a visual representation of accumulation dynamics playing out.
📝 Disclaimer
This report is intended purely for educational and training purposes. It is not a recommendation to buy or sell securities. Always conduct your own research or consult a certified financial advisor before making trading decisions.
BPCL | Ferocious Flag - Looks good for 30%BPCL | Ferocious Flag 🏁
Looks good for 30% based on the flag setup
Keep SL below 300 for short term trading position
CMP : 334

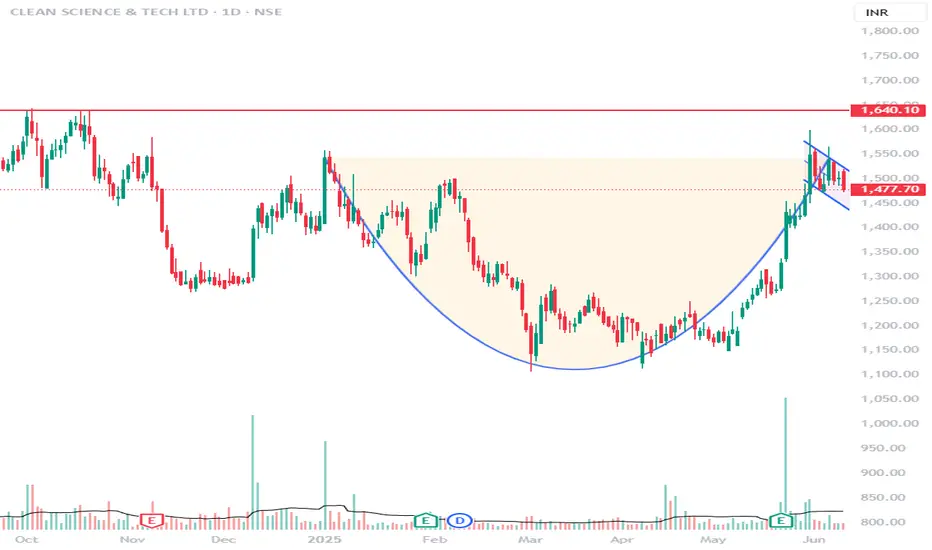
Accumulation pattern "Break Out" expected .Accumulation patterns zone trying to be broken. In addition, the flag & pole pattern, once broken, will give an upward move till 1640, being the 1st target.
ETH Traders — Late Long Setup Might Be Here
We're currently inside a descending channel on the 15-minute chart. What's interesting is:
The number of touches to the channel top is significantly higher than the bottom.
In the most recent move, price reacted strongly to the midline without even touching the channel bottom — suggesting buying pressure is stepping in early.
As price moved back toward the top of the channel, volume increased, which is a bullish sign.
This could be a good late-entry long setup for those who missed the earlier Bitcoin move.
I’m not discussing shorts — this is a bullish market, and I'm not fighting the trend.
No need to overcomplicate it. Let price speak.
📌 If you want a breakdown of another coin, just drop it in the comments.
⚠️ Without proper risk management, you're just a ticking time bomb.

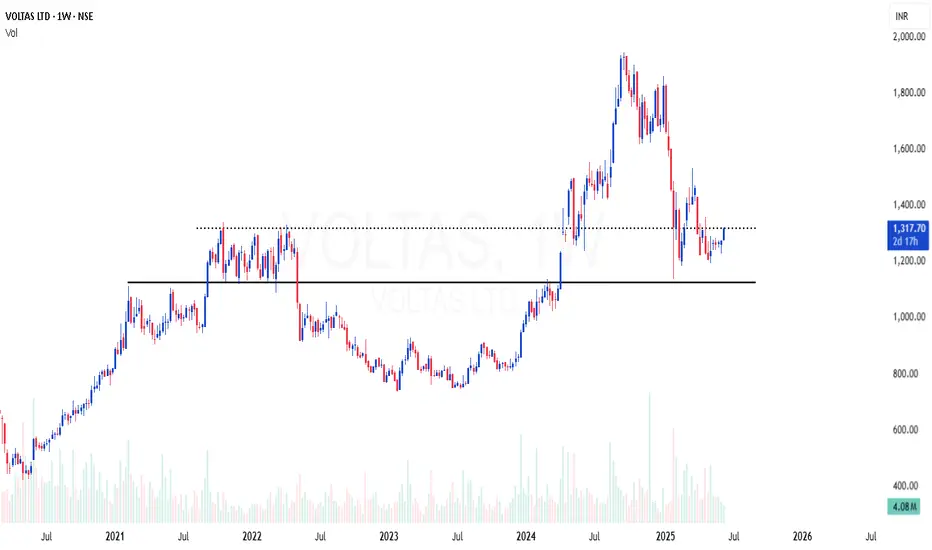
VOLTAS | Excellent area of value in weekly time frameVOLTAS | Excellent area of value in weekly time frame
Weekly 200 EMA support
RSI bullish divergence
Good risk reward
Quality stock at decent correction , looking good for reversal from here
XAUUSD | Technical Analysis 9 June 2025Hi,
I have shared my view on how gold can follow the levels which I have shown in video. In long term view gold is in downtrend, but for short term in 1hr and 15mini it can retrace back upside.
Disclaimer: This is only for educational purpose.
Thanks

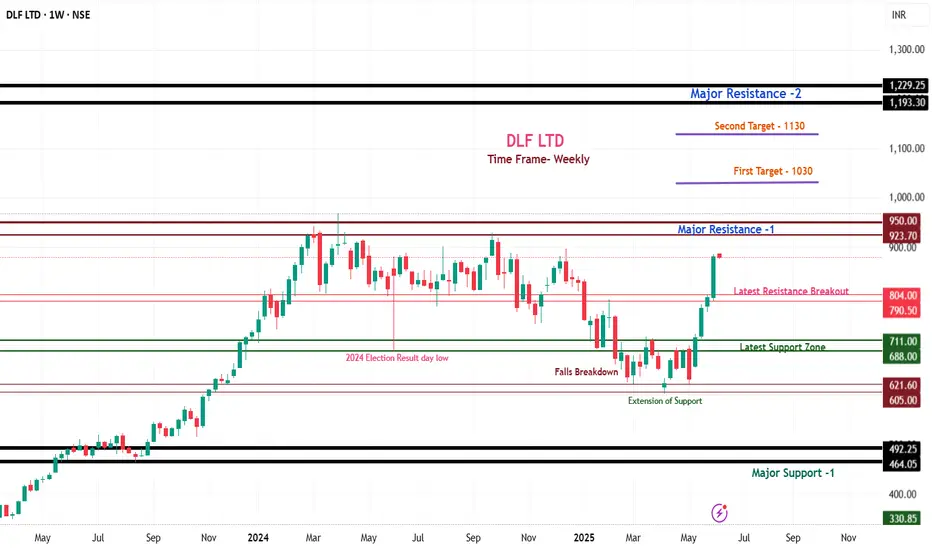
DLF Limited Technical Analysis & Trading Strategy DLF Limited – Weekly Chart Analysis (Technical View)
Company Background:
Founded in 1946, DLF Limited is India’s largest real estate developer, renowned for its premium residential and commercial projects.
With iconic developments and vast land holdings across Delhi-NCR, Mumbai, and Bengaluru, DLF is a dominant player in high-end real estate.
Core Business Segments
Commercial Properties: IT Parks, retail malls (e.g., DLF CyberHub, DLF Emporio), Grade-A offices.
Residential: Luxurious apartments, gated communities in prime locations.
Land Bank: Extensive holdings in urban growth centers.
Leasing & Rentals: Strong recurring income from office and retail leasing.
This analysis is based on the weekly time frame, offering a medium- to long-term outlook for positional and swing traders.
Chart Structure Overview:
1. DLF is currently trading around ₹878 and has shown a strong recovery after retesting its breakout zone of ₹804–₹790. The structure indicates bullish momentum.
2. But a major resistance zone lies between ₹923 and ₹950. Price action near this zone will be crucial in determining the next directional move.
Bullish Scenario – If ₹950 Breaks with Volume:
The zone of ₹923 to ₹950 is a major hurdle, acting as a resistance ceiling.
A weekly close & sustain above ₹950 will confirm a strong breakout.
After that:
First Target: ₹1,030
Second Target: ₹1,130 to ₹1,180
🔽 Bearish Scenario – If Price Fails Near ₹950
The immediate support zone lies at ₹804–₹790, which earlier acted as resistance.
If the price fails to hold this level:
Next support seen at ₹711 to ₹688
A breakdown below ₹688 could lead to a deeper fall towards ₹605 to ₹621
If ₹605 breaks decisively, further downside could extend toward ₹492–₹464, which is a **major long-term support on the chart
Conclusion:
1. This is a weekly chart-based analysis, ideal for swing or positional trades. The ₹950 level is the key breakout zone for the next bull leg.
2. As long as the price remains above ₹804, the structure remains positive.
Below ₹688, trend may weaken significantly.
💬 Found this chart breakdown helpful?
👍 Like | 💭 Comment | ➕ Follow for more weekly chart analysis and breakout setups!
Published on TradingView – DLF Limited | Weekly Analysis
Godrej Properties Chart Analysis: Bullish or Bearish Move Ahead? Godrej Properties – Chart Analysis & Trading Strategy
Company Background:
Godrej Properties, a branch of the renowned Godrej Group, began its journey in the real estate sector in 1990.
The company has gained recognition for its focus on innovative and sustainable construction methods.
It actively develops eco-friendly housing and commercial infrastructure projects, especially in the mid-income segment.
Core Business Areas
Residential Projects: Offers a wide range—from budget homes to premium apartments—with sustainability as a core design principle.
Commercial Developments: Develops business parks, malls, and office complexes.
Sustainable Construction: Implements green building practices and energy-efficient technologies across its developments.
Subsidiaries Include:
Godrej Construction
Godrej Fund Management
Why Consider Godrej Properties for Long-Term Investment?
📈 Rising Demand in Mid-Segment Housing: Driven by demographic shifts and urban growth.
🔗 Smart Business Partnerships: Asset-light model helps reduce risk and capital expenditure.
🌱 Sustainability Appeal: Well-aligned with global ESG goals, making it attractive for ethical and green investors.
Godrej Properties Technical Analysis – Key Levels to Watch
Godrej Properties is currently trading near ₹2,460, showing strong momentum after a recent recovery. However, the stock is approaching a critical resistance zone that will determine its next major move.
Key Resistance Zone
Major Resistance: ₹2,550 – ₹2,575
This zone is crucial. A decisive breakout above ₹2,575 on strong volume can lead to significant upside.
Bullish Scenario (Breakout)
If the stock closes above ₹2,575, it may trigger a fresh rally.
First Target: ₹2,800
Second Target: ₹3,000
Momentum traders should watch for price action confirmation above this level for potential long entries.
Bearish Scenario (Rejection at Resistance)
If ₹2,575 is not breached, the stock may face selling pressure.
Immediate Support: ₹2,240 – ₹2,215
If this zone breaks, the next key level to watch is ₹2,000, which acted as a strong support in the past.
A breakdown below ₹2,000 could shift the trend to bearish in the medium term.
Summary
Current Price: ₹2,460
Critical Resistance: ₹2,550 – ₹2,575
Upside Targets: ₹2,800 → ₹3,000 (after breakout)
Downside Supports: ₹2,240 → ₹2,215 → ₹2,000
Traders should closely track price behavior around the ₹2,575 level, which is likely to define the next directional move. As always, use proper risk management and wait for confirmation before entering trades.
Like this analysis?
👍 Don’t forget to like, comment your views, and follow for more actionable stock insights and breakout trade setups!
📈 Stay tuned for latest updates, key level revisions, and momentum alerts on Godrej Properties and other trending stocks.

Btc about to break all time high After hitting 1,12,000 BTC has shown some weakness and give low of 1,00,370 however in 4H and 1D time frame we can see Bull flag patterns and as i said in previous post it has also created inverse head and shoulder pattern in Daily time frame (target of 1,50,000). And now created bullish flag in that head and shoulder (Target of 1,35,000).

GOLD NEW HIGH!!!! BULLISH As per my view , today or tomorrow is the last chance for price to take off.
If the price takes off ,then in one or two weeks , it will reach new all time high.
If today or tomorrow is firm bearish means then, it will fall for sometime.
Former is likely to happen. I am going to a trade in XAUUSD today( buy).
take a trade in 1 hour timeframe and do a big swing trade today.
I feel a opportunity to swing gold.
Comment your thoughts and like if you likes.

BTC Just Chose Its Side - The Silent Confirmation....The structure has shifted.
Price didn’t shout — it whispered.
It crossed the threshold silently… a confirmation only visible to those who understand structure without indicators, without noise.
This isn't a pump.
It's alignment.
The mark I’ve drawn is not support — it’s the echo of decision.
A place where buyers proved their intent without needing volume to scream.
Now, above that line — the bias is bullish.
Not because of emotion, not because of hope —
but because price has shown commitment.
If it returns and breaks beneath that origin point...
the bullish script vanishes.
The structure flips — cold, clean, without apology.
This is not a prediction.
This is structure unfolding.
And I’m not reacting.
I’m witnessing what I already knew.
BTC is playing a script.
And Leviathan saw the outline long before the market made its first move.
#LeviathanFX #StructureSpeaks #MarketWhispers #PriceKnowsFirst #ScriptedMoves #LiquidityLogic #TradingProphecy #SilentConfirmation #DecodeTheMarket #TheChartNeverLies #BTCUSD #BitcoinTA #SmartMoneyConcepts #MarketStructure #PriceActionTrader #4HChart #SupplyAndDemandZones #TechnicalFlow #OrderFlowMindset #HighProbabilitySetups

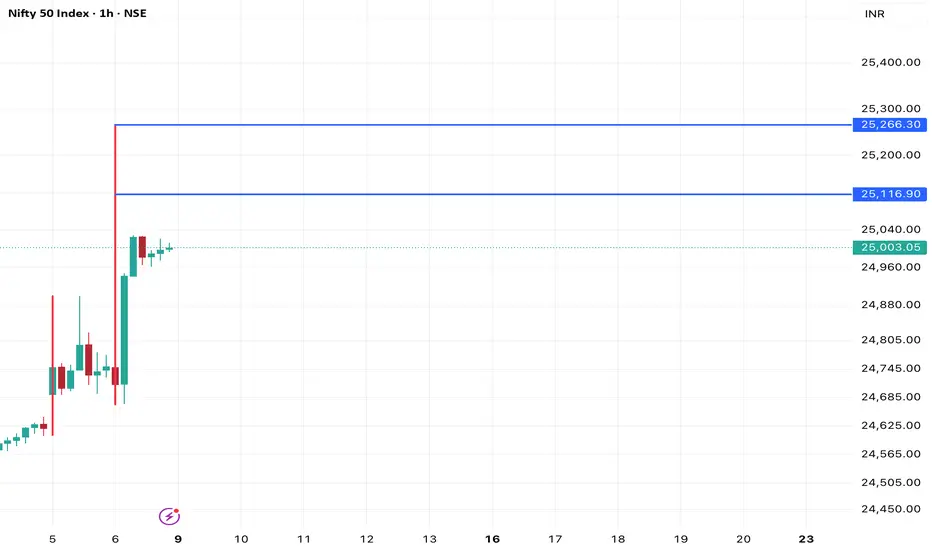
Nifty | Weekly Analysis June 9-13 2025Hi,
I am sharing view on nifty movement for coming week, it can create HH and HL formation and next possible retracement levels are 25117 and 25266.
Disclaimer: This is only for educational purpose.
Thanks
BTCUSDT | Weekly Analysis June 9-13 2025Hi,
I am sharing my view on BTC further upside movement if sustatined above 107391 then next will be 109501 and 111429.
Disclaimer: This is only for educational purpose.
Thanks

HYUNDAI | Channel breakout ahead - Looks good for 30%HYUNDAI | Channel breakout ahead - Looks good for 30%
CMP : 1861
SL : 1700
Expecting breakout in this channel,
Has good support to take measured risk - small stoploss
The previous swing high is also works as Fib support

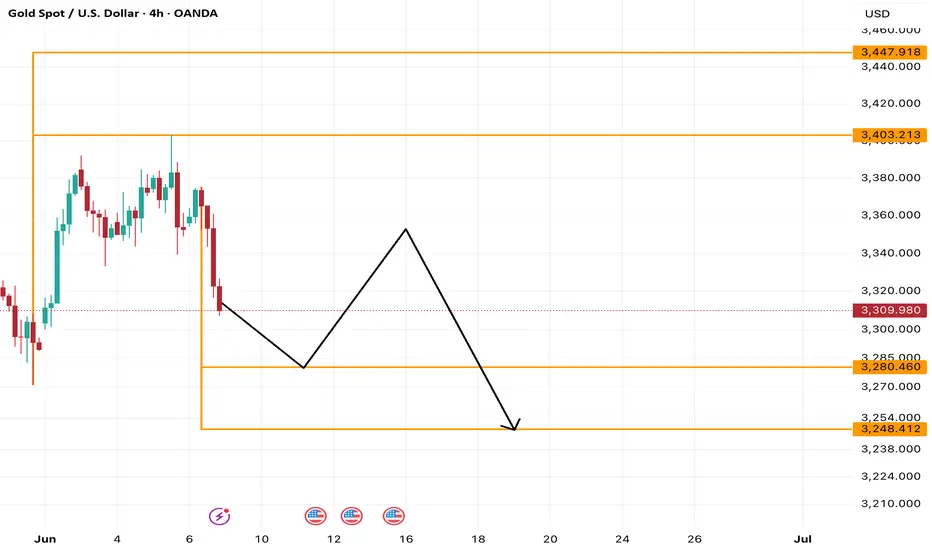
XAUUSD | Weekly Analysis for Week 9 - 13 June 2025Hi,
I am sharing my view on gold movement for coming week. It can go downside upto 3280 and 3248 levels.
Disclaimer: This is only for educational purpose.
Thanks
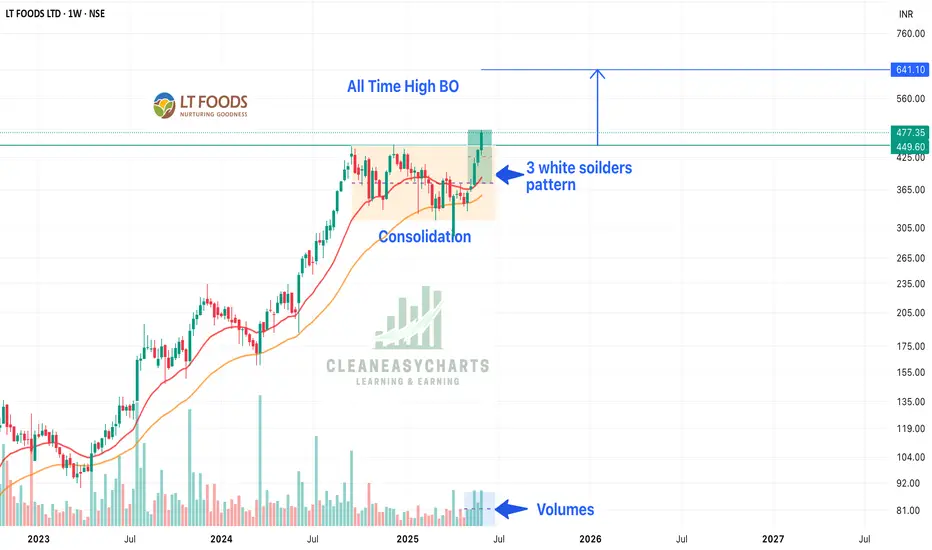
LT Foods - All Time High Break OutLT Foods has given a all time high BO and is looking great. Factors which make this stock promising:
1. On weekly time frame made 3 White Shoulder Pattern - which is a bullish pattern
2. Breakout after a long consolidation - consolidating from 11 odd months
3. Volume is increasing / steady
4. A rectangular pattern BO as well
5. Fundamentally, LT Foods has lots of opportunities as they have gone beyond India
6. LT Food has ventured in organic food as well with recent 17% acquisition of Nature Bio-India
Above factors make this stock a great pick and hold it for super gains.
Keep following @Cleaneasycharts as we provide Right Stock at Right Time at Right Price.
Cheers!!!