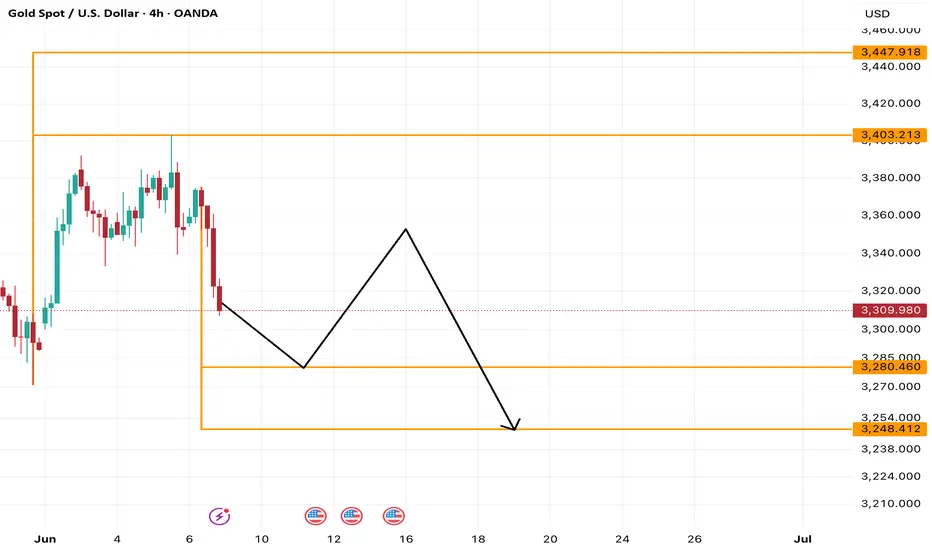
XAUUSD | Weekly Analysis for Week 9 - 13 June 2025Hi,
I am sharing my view on gold movement for coming week. It can go downside upto 3280 and 3248 levels.
Disclaimer: This is only for educational purpose.
Thanks
Candlestick Analysis
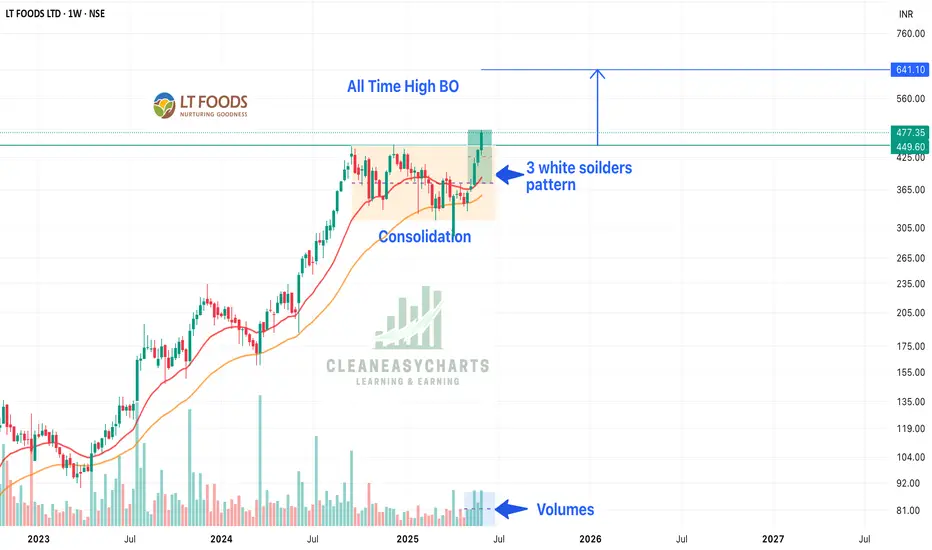
LT Foods - All Time High Break OutLT Foods has given a all time high BO and is looking great. Factors which make this stock promising:
1. On weekly time frame made 3 White Shoulder Pattern - which is a bullish pattern
2. Breakout after a long consolidation - consolidating from 11 odd months
3. Volume is increasing / steady
4. A rectangular pattern BO as well
5. Fundamentally, LT Foods has lots of opportunities as they have gone beyond India
6. LT Food has ventured in organic food as well with recent 17% acquisition of Nature Bio-India
Above factors make this stock a great pick and hold it for super gains.
Keep following @Cleaneasycharts as we provide Right Stock at Right Time at Right Price.
Cheers!!!
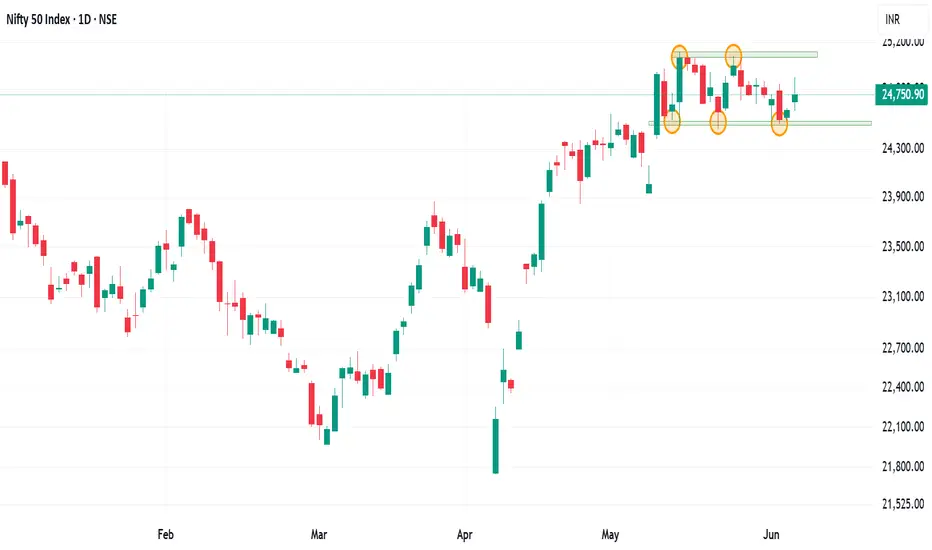
Outlook on nifty 50 for the next week. Is it going trending?Nifty 50 on the daily chart is trading in a range and has respected the zone quite effectively.
Index has remained sideways since a 3.82% move on 12th may. Market trade in cycle and after a sideways cycle, a trending market is predicted.
Either side movement can be seen in the index as 18 bars or 24 days it has remained in the range.
Major Resistance :- 25125, 25500
Major support :- 24500, 23930
This 600 range and change into same range of trending market.
Even the moving averages are coinciding and forming a MA gate which can give good momentum trading setup
Wait for the price action near the price levels before forming a trading basis. Trade only the setup and wait for the retest on either side.
Inside Bars After High Volume – CERA Setting Up Near Key CT📌 Timeframe: Weekly (WTF)
📌 Type: Technical Observation / Swing Structure
📌 Concept: Counter Trendline Breakout Setup
CERA is currently navigating a highly constructive zone from a swing trading lens. Here's what's developing technically:
🔹 Higher Low Formation:
The stock has established a higher low structure, with the white internal trendline offering visible support across recent weeks. Interestingly, this aligns perfectly with the 200-period EMA on the weekly timeframe, enhancing its significance as a dynamic support layer.
🔹 Volume Clues:
Two of the highest volume candles on the weekly chart have now been followed by inside bars, a potential sign of absorption or base building. This tightening within volume zones signals institutional interest and a possible buildup phase.
🔹 Supply Zone Identified:
An overhead supply (marked in orange)
🔹 EMA Context: The blue 200 EMA further reinforces the idea of Supportive price behavior around this line validates its role.
🔍 This post is for educational discussion only. No recommendation or forecast is implied. Please conduct your own due diligence.

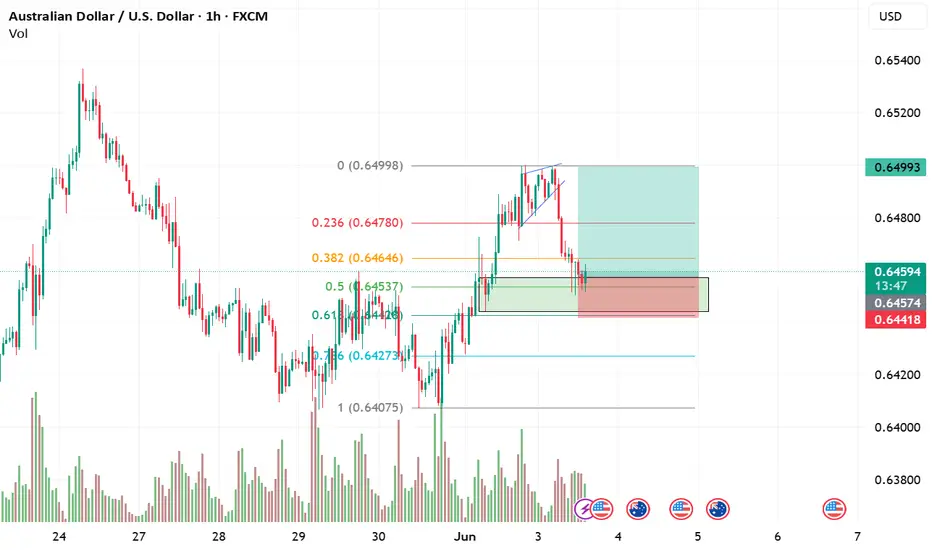
AUDUSD Long Idea : Fib and Demand zoneBullish Idea on AUDUSD at the demand zone which is occurring at Fib retracement of 0.5 and 0.618. On a good confirmation candle at this zone could be a possible good long trade.
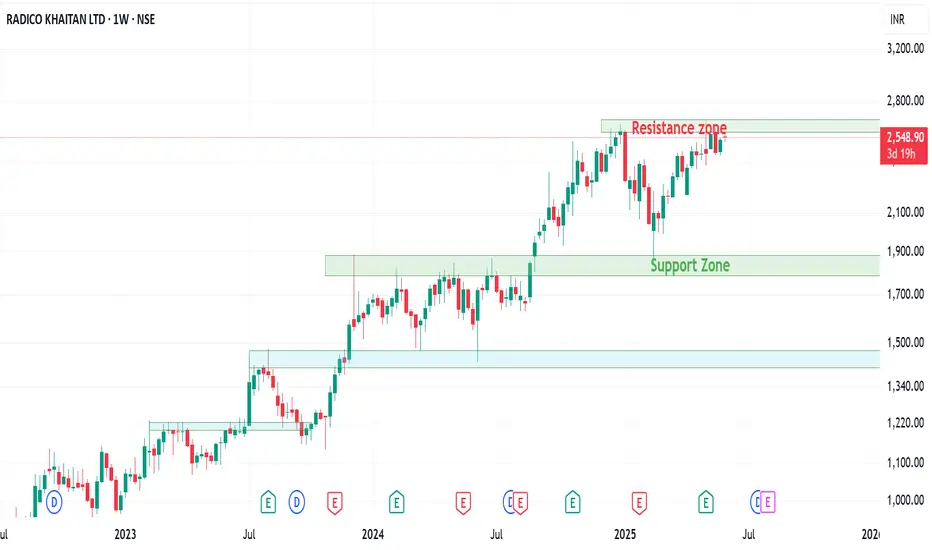
Radico Khaitan at a Crossroads: Support, Resistance & MomentumThe stock is in a bullish trend and is forming a box consolidation and break outs.
On the weekly charts the stock is trading around the resistance zone and there are chance of either breaking out or retesting to the lower levels.
Stock seems strong bullish on the charts but indicators are suggesting a bearish move as the stock is around the resistance zone.
Short sell can be initiated in the stock with a strict SL.
On the bullish side the stock is respecting the monthly 20 EMA and has retested it thrice. Radico if turns bearish can be entered around the moving average as Good R:R in the trade can be seen.
Even on the weekly charts, the stock is trading above the moving averages chance of a retest are there but short sell the stock once the support zone in taken out.
Watch the stock a good ROI can be generated in the stock after the break out the stock will be forming new ATHs.
Wait for a pattern near the resistance either for a bearish or bullish move as it is trading around the crucial recent high levels of 2600-2680.
Stochastic indicator on the Monthly TF is trading in overbought zone while on the weekly TF its showing some bearish divergence. Even the monthly RSI is showing a bearish divergence.
Wait for the price action and trade accordingly.
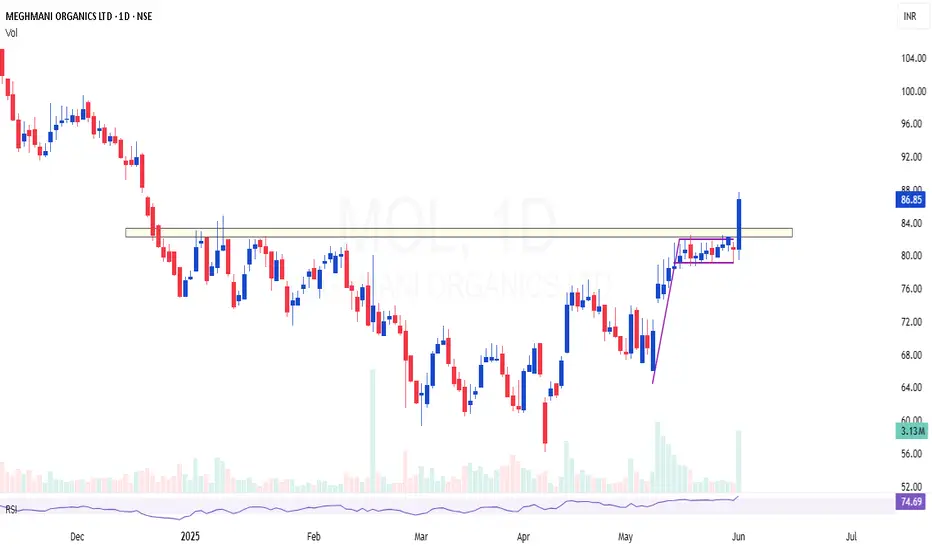
MOL | Breakout Above Supply Zone | Flag + 200 EMA ConfluenceMOL | Strong Breakout Above Supply Zone | Flag + 200 EMA Confluence
Previously shared around the ₹70 level — now showing clear strength with a decisive breakout above the supply zone, backed by strong volume.
✅ Breakout Confirmation: Price has convincingly breached previous resistance, which now acts as support. The volume accompanying this move adds weight to the breakout.
📈 Flag Formation (Daily Timeframe): A clean bull flag is visible on the daily chart — a classic continuation pattern indicating further upside potential.
📉 200 EMA Support: The 200 EMA is holding well and aligns perfectly as a dynamic support, reinforcing the current bullish structure.
🧾 Fundamentals Supporting the Technicals: Recent quarterly results suggest the bottom may already be in place, adding a fundamental tailwind to the technical setup.
🟢 Conclusion: This zone offers an excellent area of value for swing traders and position holders. Watch for sustained momentum and retests as potential entries.
XAUUSD | Intraday Technical Analysis 2nd June 2025Hi,
Gold can go upto 3351 and 3400 on traday basis.
Disclaimer: This is only for educational purpose.
Thanks

BEPL | Yet another good monthly candle at excellent areaBEPL | Yet another good monthly candle
Excellent area of value at this location
Breakout after 7 years consolidation and retesting
High probable setup for doubling
CMP : 119

SBIN : Swing Trade#SBIN #swingtrade #threewhitesoldier #trendingsetup #breakoutstock #momentumstock
SBIN : Swing Trade
>> TWS Visible
>> Trending setup
>> Cup and Handle formation
>> Breakout Candidate
>> Good Strength & Volume
>> Good Risk Reward Trade
Swing Traders can lock profit at 10% and keep trailing
Disc : Charts shared are for Learning purpose not a Trade recommendation.
Consult a SEBI Registered Advisor before taking position in it.

XAUUSD Technical Analysis | Week 2nd - 7th JuneHi,
I am sharing my view on gold for week 2nd to 7th June.
Disclaimer: This is only for education purpose.
Thanks

CHALET Hotels : Swing pick#CHALET #swingtrade #breakout #threewhitesoldiers #trendingstock
CHALET : Swing Trade
>> TWS Visible
>> Trending Setup
>> Good Strength in Stock
>> Volumes Dried up, Expansion imminent
>> Quick 10-15% upside potential
Swing Traders can lock profit at 10% & Keep Trailing
Disc : Charts shared are for Learning purpose and not a Trade recommendation. Consult a SEBI Registered Advisor before taking position in it.

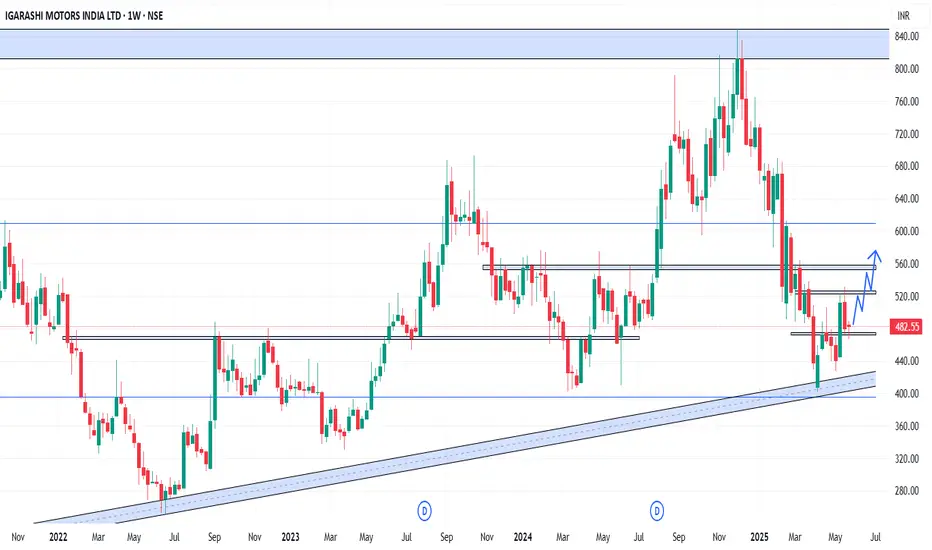
IGARASHI - Weekly AnalysisIn the Weekly Chart of IGARASHI ,
we can see that; it has created a hammer candle on W breakout support Trendline.
Expected momentum is shown in chart.
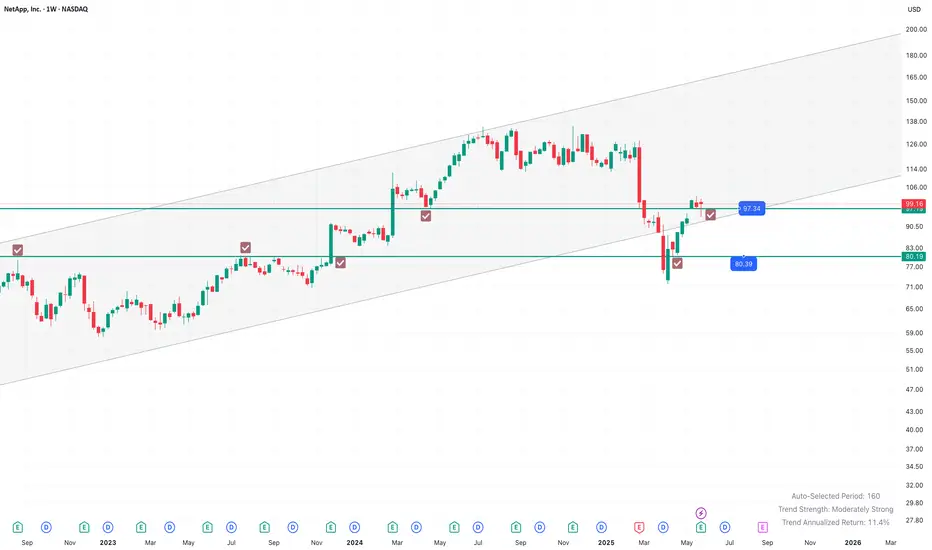
NetApp Inc shows bullish candlestick in larger timeframeNASDAQ:NTAP price action shows bullish candlestick pattern in the Monthly Chart. As well as in Weekly chart, it shows steady rejection and showing a sideways consolidating trend.
Lets analyze first weekly timeframe:
We can see during April'25 (Tariff Trauma weeks) the price made a low of $74, breaching down the $80 mark.
But within one week it again regains back the strong, historical demand zone of $80 and continue it's upsurge towards $100. It made a recent weekly high of $102.
Last 3 weeks was a consolidating around $97 to $100 level, keep on honouring the support of $97.
Last week, during timid FY24-25 Q4 earnings, we can see it falls back to $94. And seen a rejection there during last trading session of Friday, 05/30 and close the week with a Dragronfly dozi candlestick pattern (albeit the body color is red). Still the bottom rejection wick and holding back $97 is a sign of 'don't give up so easily'.
Whereas in monthly timeframe, it shows absolute bullishness:
The April month candle was a book-perfect Dragronfly doji.
This May month candle is a super bullish (sort of) Marubozu candle, even the low is above the last monthly close.
It's indicates a confirmative bullishness in monthly
Verdict:
This NASDAQ:NTAP counter is expected to be sideways-to-bullish in coming weeks.
Immediate Support levels are: $97, $89 (200 WSMA), $80.
There is no reason of it getting close below $80. That's becomes the new normal Low of the counter.
It's going through a typical consolidation and distribution phase for gathering new energy to resume it's upmoving in coming medium terms.
Stay Invested or Keep on accumulating , specially on every dips.
HDFCLIFE | Excellent cup and handle breakoutHDFCLIFE | Excellent cup and handle breakout
CMP : 776
SL : 700
Target : 1000+

CARERATING | Channel + Flag breakout with 200 EMA supportCARERATING | Channel + Flag breakout with 200 EMA support
High probable setup
CMP : 1237
SL : 1150
Target : 1550

KOTAKBANK | Full 5+ years range consolidation and breakoutKOTAKBANK | Full 5+ years range consolidation and breakout in monthly time frame
CMP : 2074
Stable bluechip stock - can expect atleast 40% ROI from here

SOBHA | Breakout after consolidation + 200 EMA supportSOBHA | Breakout after consolidation + 200 EMA support
CMP : 1433 (Dip : 1300)
SL : 1200
Target : 2000

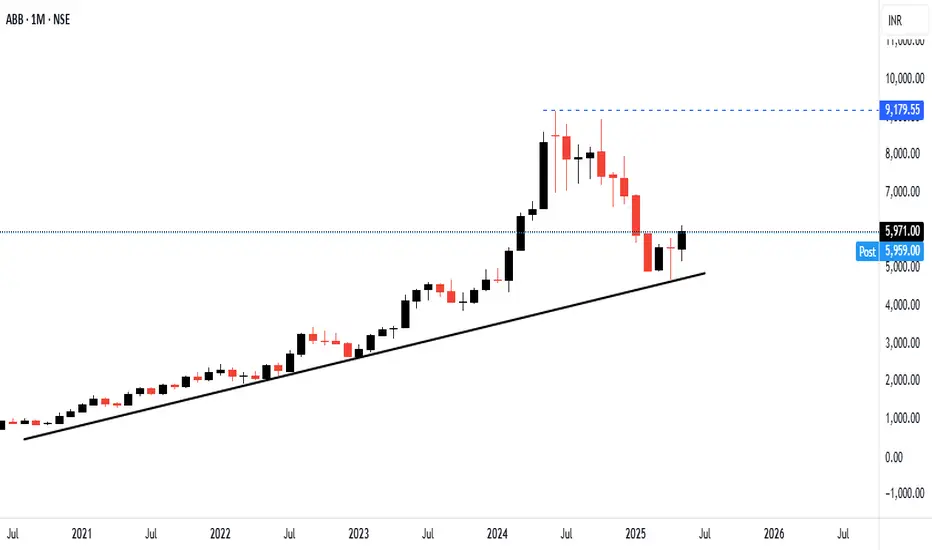
ABB India Ltd (NSE: ABB) LONG**ABB India Ltd (NSE: ABB)**:
**Chart Analysis**
* **Trendline Support:** The stock has been respecting a long-term rising trendline since mid-2020.
* **Recent Reversal:** A bullish engulfing candle has formed near this trendline support in the latest month (May 2025), closing at ₹5,960 with a **+7.92% gain**.
* **Correction Phase:** The stock has corrected significantly from the all-time high around ₹9,179 (marked with a dashed blue line).
* **Support Held:** The recent low aligns well with the trendline, suggesting the correction might be ending.
Chambal Fertilizers – High RR Trade Setup FormingChambal Fertilizers price has dropped sharply and is now reacting from a strong demand zone between ₹570–₹579, which earlier acted as a base for a major rally. This area has been respected in the past and shows signs of absorption.
Today’s candle shows a pause in selling, hinting at a possible reversal.
Entry is taken near ₹594 with tight risk below ₹570 (marked invalidation zone).
If demand steps in upside targets are minor resistance around 630,
TGT 1: ₹633 – major supply zone
TGT 2: ₹706 – full mean reversion if strength sustains
This setup offers a high risk-to-reward ratio with a clearly defined stop-loss and structure.
Keeping it simple zone is valid, price is reacting, R/R is strong. All eyes on follow-through.
Chambal Fertilizers – Strong Business, Low Risk
Chambal is one of the biggest private fertilizer companies in India. It supplies urea and other Agri Products to farmers across the country.
Here’s why it stands strong:
Stable revenue: ₹28,000 Cr+ in FY24
Good profit: Net profit of ₹1,300 Cr+
Low debt: Debt-to-equity around 0.6, very manageable
Healthy cash flow: Business generates steady cash, even in tough markets
Govt support: Gets regular subsidies from the Indian government
Essential sector: Demand stays strong because farmers always need fertilizers
Chambal may not be a flashy stock, but it's reliable. Good fundamentals + technical setup = smart long-term opportunity.
Like, comment your thoughts, and share this post!
Explore more stock ideas on the right hand side your feedback means a lot to me!
Disclaimer: This post is for educational purposes only and should not be considered a buy/sell recommendation.

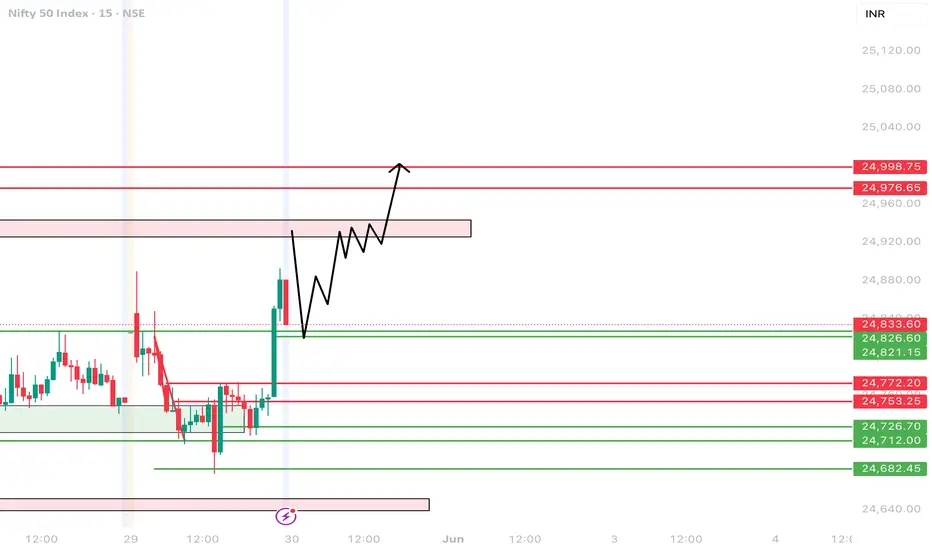
Nifty Technical Analysis | 30 May 2025Hi,
I am sharing my view on Nifty for 30 May 2025.
Disclaimer: This is only for education purpose.
Thanks
XAUUSD Technical Analysis | 29 May 2025Hi,
I am sharing further view on gold for 29 May.
Disclaimer: This is only for education purpose.
Thanks

XAUUSD Technical View 29 May 2025Hi,
I am sharing my view on gold for intraday.
Disclaimer: This is only for educational purpose.
Thanks
