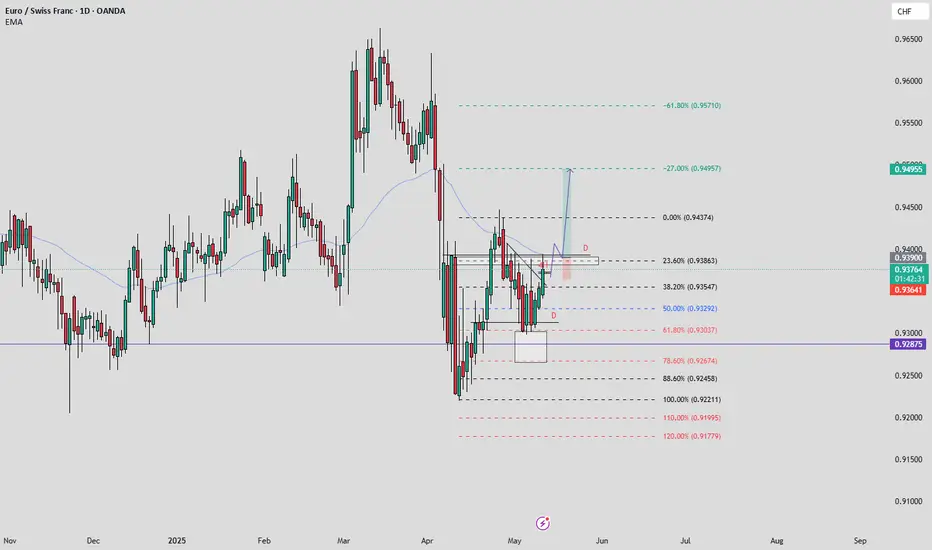
EURCHF LONGHey everyone
Im looking for a Buy after we break the Daily/4H resistance and retest from it but also we have mulitple confirmation:
1) Daily bullish, 4h bullish
2) after we break above our daily support we went down to retest our 61.80% Fib level
3) break our counter trend line and retest it
4) we need to break above our Daily/4H resistance level and wait for an engulfing bullish 1h/30 and then will get in
Good luck!!
Candlestick Analysis
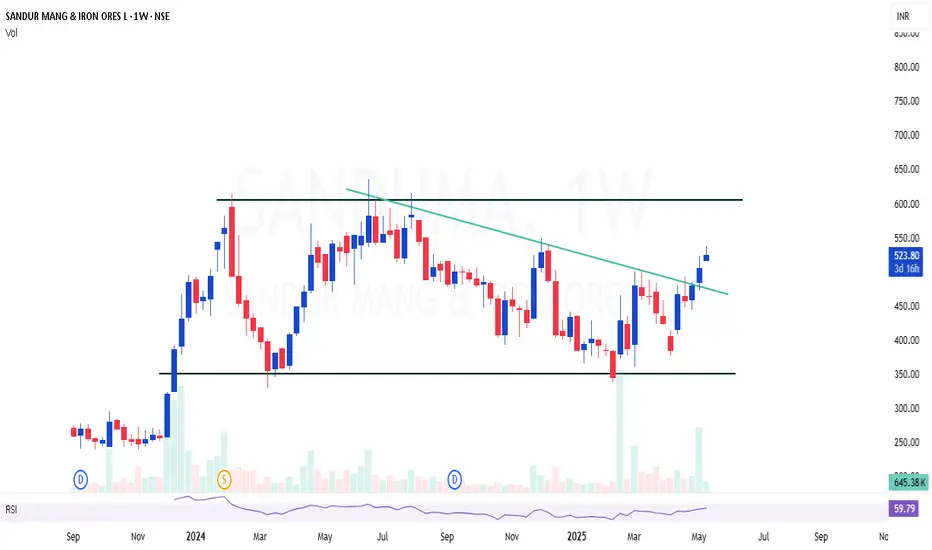
SANDUMA | High quality stock with good technical setupSANDUMA | High quality stock with good technical setup - Looks good for doubling
Investment and reserves are increasing strongly
Breakout above the channel line will take us straight away to 800+
CMP : 523
Target : 800
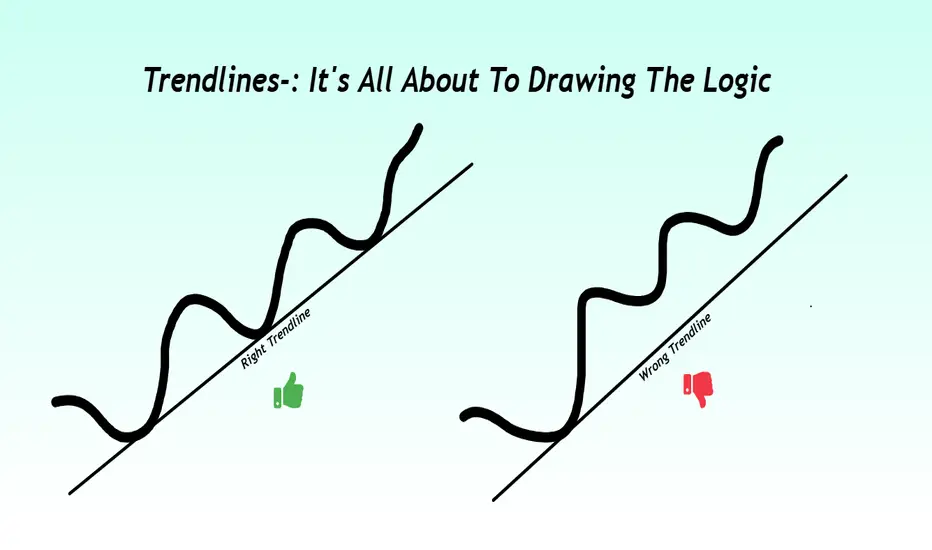
Not all lines are Trends: Post about proper Trendlines
Introduction-:
Trendlines are often the first tool traders learn and ironically, one of the most misused. Drawing a line between two swing points may look convincing, but that doesn’t make it meaningful. A right trendline is not just about connecting dots it’s about capturing the heartbeat of the market.
In this post we will learn how to draw high quality trendlines that align with price structure, reflect momentum, and provide reliable trade signals. Whether we are scalper, swing trader, or positional analyst, mastering this skill will bring more clarity and confidence to your chart reading.
1-:What Is a Trendline Really ?
A trendline isn't just a visual reference it’s a dynamic tool that reflects the direction and strength of a trend. Think of it as the price path of least resistance.
a) Identify areas of value for entry
b) Highlight potential reversal or breakout zones
c) Keep your analysis structured and disciplined
2-: Anatomy of a Right Trendline
a) Three Touches Minimum
A trendline with just two points is a projection. Once it gets a third touch or more, it becomes validated a level that other traders are likely watching too.
b) Wicks or Bodies Choose One, Use wicks when volatility is high or you're analyzing intraday charts and use bodies for cleaner structure in swing setups
Mixing both can distort your view so choose one and stick to it per chart.
c) Don’t Cut Through Candles, a forced line that slices through multiple candles is a biased line. Let the trendline hug swing points naturally without imposing your view on the market.
d) Respect the Slope, steep trendlines often mark emotional moves that don’t last. Shallow trendlines suggest controlled trends better for swing trades. Avoid extremes a flat or vertical line is usually unreliable.
3-: Timeframe Relevance
Always start with higher timeframes Daily or 4H to draw the main trendline. These longer-term lines attract more volume and institutional attention. Then shift to lower timeframes to refine your entries, keeping the higher-level structure in view.
4. Use Trendlines with Context for Better Accuracy, Trendlines become far more powerful when aligned with other tools, Some examples below.
Horizontal support and resistance can confirm trendline levels
Volume spikes can validate breakout or pullback setups
Divergence in RSI or MACD can signal weakening trend strength
Chart patterns like flags, triangles, or head-and-shoulders often form around key trendlines
The more layers of confirmation, the better your odds.
5-: Using Trendlines for Trading Decisions
a) Pullback Entry
Wait for price to touch the trendline and show a strong reaction (engulfing, pin bar, etc.). These setups offer high R:R with clear invalidation.
b) Break and Retest
A clean break below or above the trendline, followed by a retest, often marks trend continuation or reversal. Wait for confirmation before entering.
c) Logical Stop Placement
Place your stop-loss just outside the trendline’s opposite side. This approach is more rational than random pip buffers or fixed risk.
6-: Trendlines That Trap Traders
Not all breakouts are real. Sometimes price will breach a trendline just enough to trigger stops and then snap back so how to avoid the trap.
Don’t trust every breakout
Confirm with volume or candle structure
Watch for failure-to-follow-through patterns
Patience often reveals whether a move is genuine or manipulation.
Conclusion
The right trendline is not just a drawing it’s a tool that reflects the psychology of the market.
It helps you trade what the market is showing, not what you hope to see. Don’t draw lines to fit your bias. Let price action speak, and draw lines that the market itself respects.
Thanks for reading. If this added value, a like would be encouraging.
Regards- Amit.
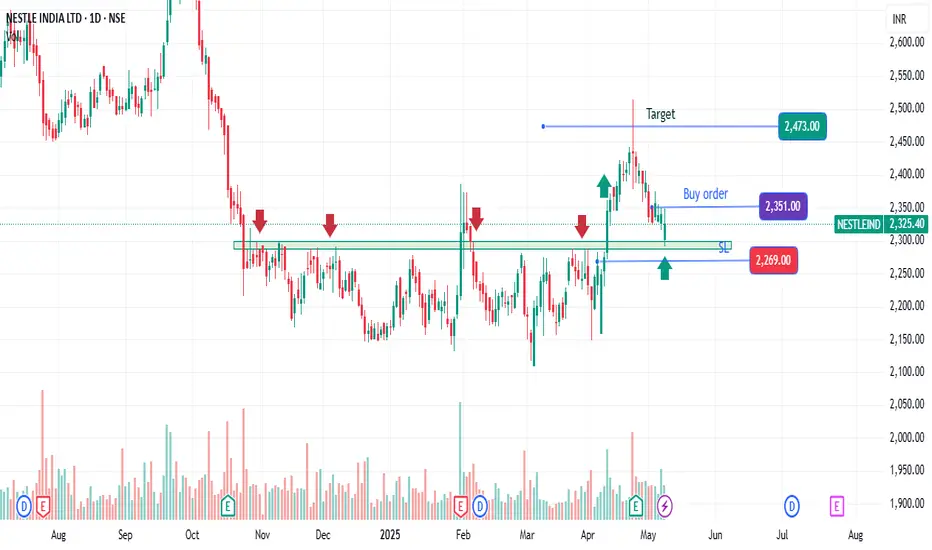
Nestle India: Multiple times resistance and Breakout and retestNSE:NESTLEIND
Resistance becomes Support !
This has shown multiple times resistance levels see the red arrows on chart, on 9th Apr 2025 script has shown the breakout with increased volumes, on 09th May script has shown the Bullish candle at the previous resistance level which will work has support.
Buy above the high of Bullish candle at 2351
SL at 2269
Target at 2473.
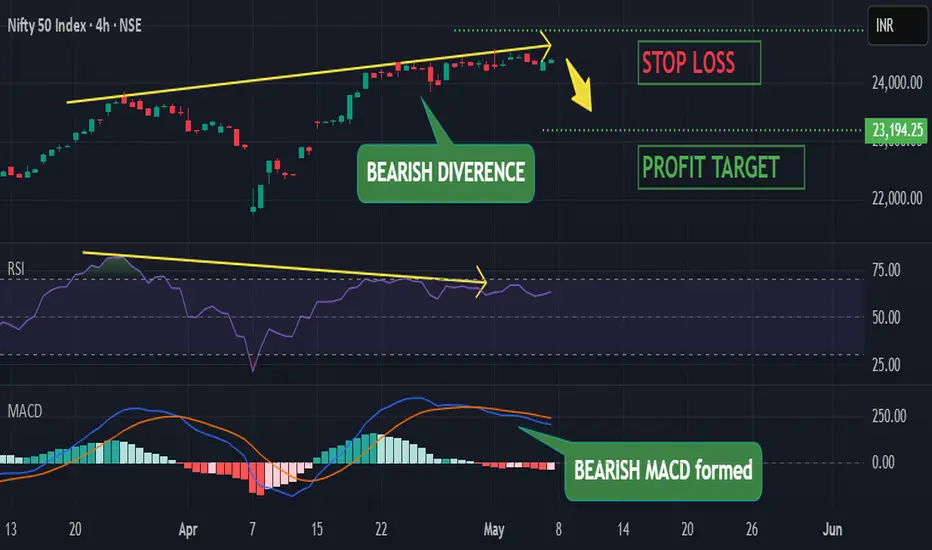
NIFTY : Very bearish due to forming Bearish Divergence pattern
BEARISH DIVERGENCE -
Market has formed a higher high on the chart whereas rsi has formed a lower high which indicates a bearish divergence pattern. This indicates upcoming market fall
Bearish Divergence forms when market forms higher high & rsi forms lower high
BEARISH MACD -
The macd line recently crossed below the signal line inside the macd indicator forming bearish macd crossover. Market is likely to fall in the upcoming days due to this bearish signal
MACD indicator is the combination of 2 lines - macd line is the difference between 26-period & 12-peroid EMA & signal line is the 9-period EMA of macd line
INVERTED HAMMER CANDLESTICK -
On daily timeframe NSE:NIFTY has formed a bearish candlestick pattern called "Inverted Hammer". it indicates reversal of the ongoing trend and beginning of the opposite trend ie bearish trend here.
Inverted Hammer candlestick is formed when a candlestick has long upper shadow & smaller body at the bottom
PROFIT TARGET -
target is 23194.25
STOP LOSS -
24908.05
ETH Short Triggered — Here’s Why It Still Makes Sense
BINANCE:ETHUSDT Trade Breakdown – 🧠
🔹 Timeframe: 1H / 15min Trendline Focus
🔹 Position: Short
🎯 Cycle Overview:
• HWC (High Wave Cycle): Bullish 🔼 (but not strongly)
• MWC (Medium Wave Cycle): Ranging 🔁
• LWC (Low Wave Cycle): Weakly Bearish 🔽
Since this position is against the HWC (High Wave Cycle), I’ve reduced my risk. However, because the HWC is not strongly bullish and the MWC (Medium Wave Cycle) is ranging, taking a short position is still a valid option — as long as risk is properly managed. ⚠️
📈 Trendline Setup:
There are two key trendlines:
• Lower trendline on the 1H timeframe
• Upper trendline on the 15min timeframe
Both have 4 touches, which increases the probability of a breakout. I focus on breakouts in my strategy, so the number of touches matters.
The price was currently reacting to the lower trendline. Since it matched my breakout trigger, I entered short — but reduced my risk because it’s against the primary trend (HWC).
⚡ Also remember:
Trendlines that align with the main cycle direction tend to give stronger moves. So don’t just look at timeframe — the breakout direction matters too.
🔍 Volume & Price Action:
We've been ranging for 14 days, which builds potential energy for a sharp move.
The last touch on the trendline had a weak reaction, and volume is declining — which often signals an upcoming breakout.
🎯 Trade Details:
• Entry: 1798
• Stop Loss: 1802
• Target: 1750
🧠 Summary:
This setup matches my strategy criteria: clean touches, breakout trigger, weak reaction at the trendline, and volume confirmation. Despite being counter to HWC, risk was minimized accordingly.
Without proper risk management, you're just a ticking time bomb⚠️
— PXA 📊

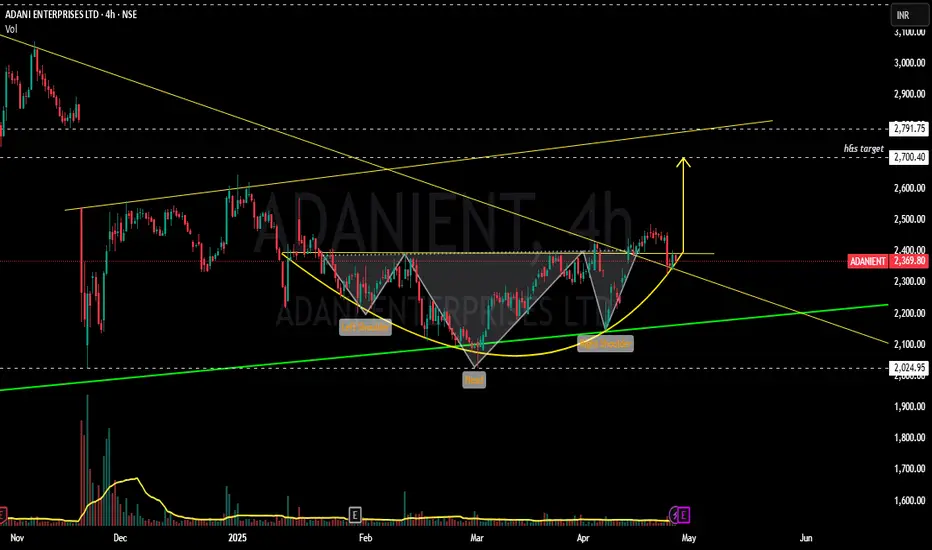
ADANIENT - Bulls getting ready to bump up ?????!!!Y essss!!! !
Chart patterns inculcating me the above titled opinion.
1. Monthly timeframe shows the symmetrical triangle pattern from 2020 till now, now the stock at support line(chart image shown below)
2. Weekly time frame shows us the INSIDE BAR candlestick pattern(mother baby pattern) with good volumes....with the low umtested till now.(made the low of 2025 on 22 nov 2024)
3. Daily time frame shows the Breakout attempt out of the 11 month old trendline.
4. Now, with the results on may 1, we can expect a volatile move.... .with the inverted h&s pattern around the corner.
Voluminous Entry can be made after the BREAKOUT WITH GOOD VOLUMES...
will update once the breakout happens.
Just add it to your watchlist and keep an eye on it.
THIS IS JUST MY OPINION..NOT A TIP NOR ADVICE.
Thank you .
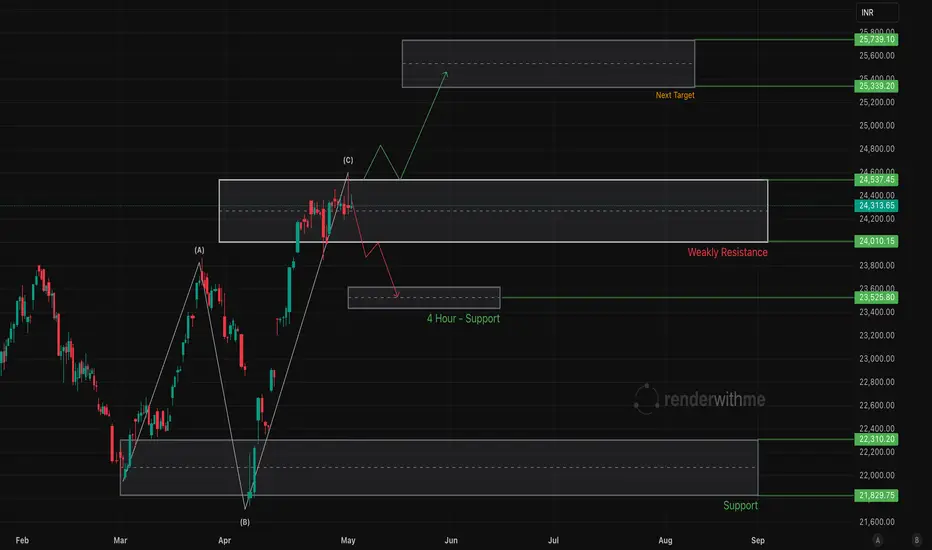
NIFTY - 50 Not easy to break at Weakly ResistanceThe Nifty 50, a benchmark index of the National Stock Exchange (NSE) in India, has shown a bullish trend recently, but its performance for the upcoming week (starting May 5, 2025) will likely be influenced by a mix of technical levels, macroeconomic factors, and market sentiment. Below is an overview based on recent analyses and market data:
Technical Analysis
Current Levels and Trend: The Nifty 50 closed at 24,313 on May 2, 2025, reflecting a bullish trend with a 0.24% weekly gain, a 4.98% monthly increase, and a 7.88% yearly rise. The index is trading above key daily moving averages (5, 10, 20, 50, 100, and 200 DMA), signalling sustained bullish momentum.
Support and Resistance:
Support: Immediate support lies at 24,000–24,124, a strong demand zone on intraday and higher timeframes. A break and close of 4 hour candle below 24,000 could lead to a correction toward 23,500 or lower.
Resistance: The index faces resistance at 24,433–24,550. A decisive close above 24,600 could trigger a rally toward 25,300–25,700 or even 26,000
Volatility: Volatility is expected to persist due to global uncertainties and high VIX levels (above 18). Consolidation is likely unless the index decisively breaks 24,500.
Tata motor sign of correction.As per chart analysis stock is trading in LL & LH pattern. It is facing resistance at 78.6%.
Candle pattern showing evening star pattern which is sign correction. It may test 580 soon.

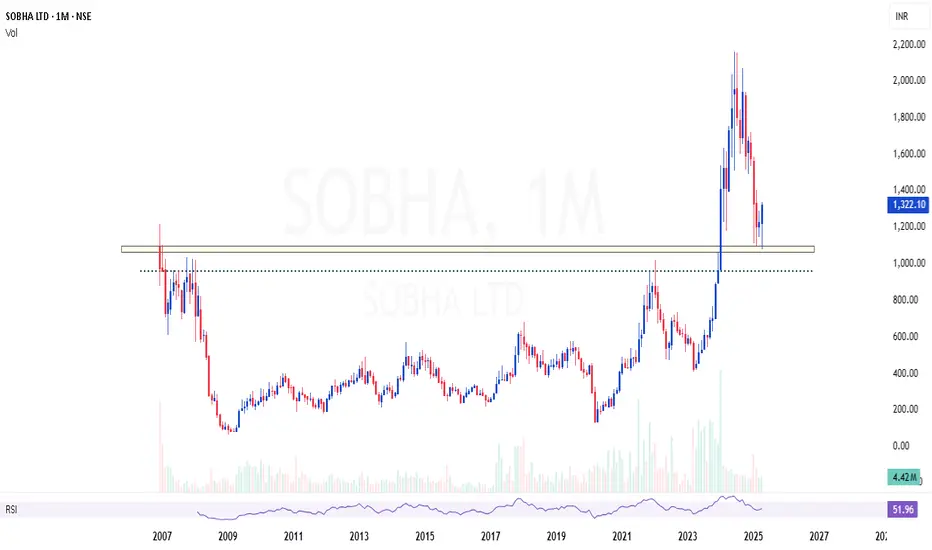
SOBHA | Excellent area of value - Looks strong buySOBHA | Excellent area of value in monthly time frame - Looks strong buy
Showing strong reversal candles at support
CMP : 1322 (Dip : 1000)
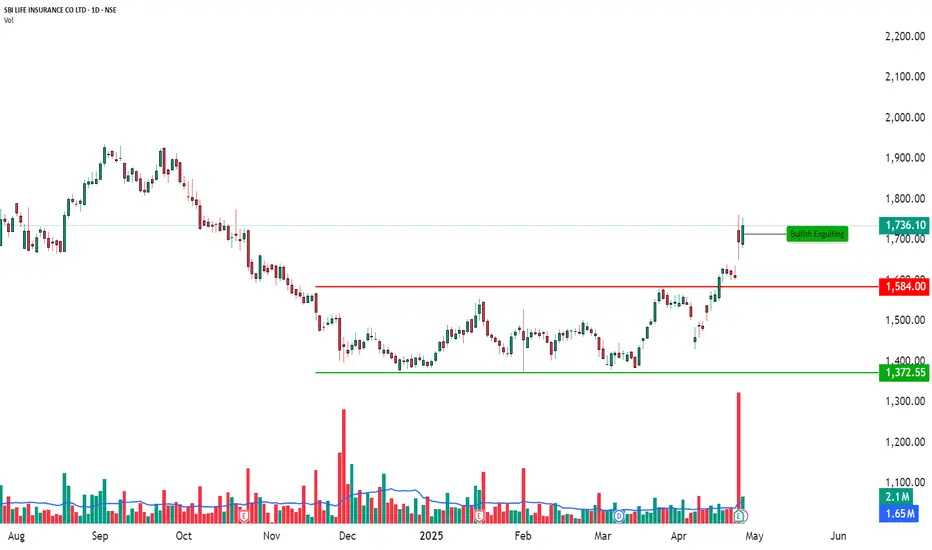
Breakout with Bullish Engulfing Confirmation | Daily Chart🏦 SBI LIFE INSURANCE CO LTD – Breakout with Bullish Engulfing Confirmation | Daily Chart
📅 Date: April 28, 2025
📈 Timeframe: Daily Chart
🔍 Stock: SBI Life Insurance Co Ltd (NSE)
📌 Technical Overview:
SBI Life is showing strong bullish momentum on the daily chart after breaking out above a key horizontal resistance around ₹1,584.
The price has formed a Bullish Engulfing candlestick pattern, indicating renewed buyer strength, backed by heavy volume.
🧩 Chart Pattern:
Strong horizontal resistance at ₹1,584 (now acting as support).
Bullish Engulfing candle printed around ₹1,736.10, showing strong rejection of lower levels.
Price structure continues to maintain higher highs and higher lows – a positive sign for bulls.
🔍 Key Price Levels:
Support Zones: ₹1,584(marked in red)
Major Support: ₹1,372.55(green horizontal line)
Current Market Price (CMP): ₹1,736.10
A sustained move above ₹1,736 with rising volume could potentially take the stock towards higher psychological levels around ₹1,800+.
📊 Volume Analysis:
Strong volume breakout observed during the recent rally.
Volume spike supports the validity of the bullish breakout, indicating increased buying interest.
🧠 Observational Bias:
As long as SBI Life holds above ₹1,584, the short-term to medium-term bias remains positively bullish. Any healthy pullbacks near ₹1,580–₹1,600 zones could offer better risk-reward setups for positional traders.
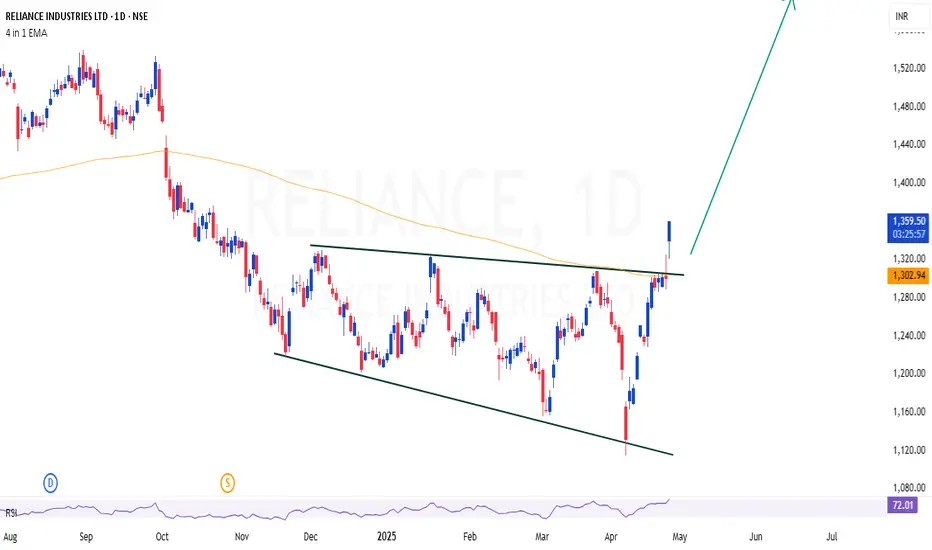
RELIANCE | Lets join hands with Ambani - Looks good for 20% shorRELIANCE | Lets join hands with Ambani - Looks good for 20% short term
Simple trendline (Channel) breakout
CMP : 1359
SL : 1250
Target : 1600
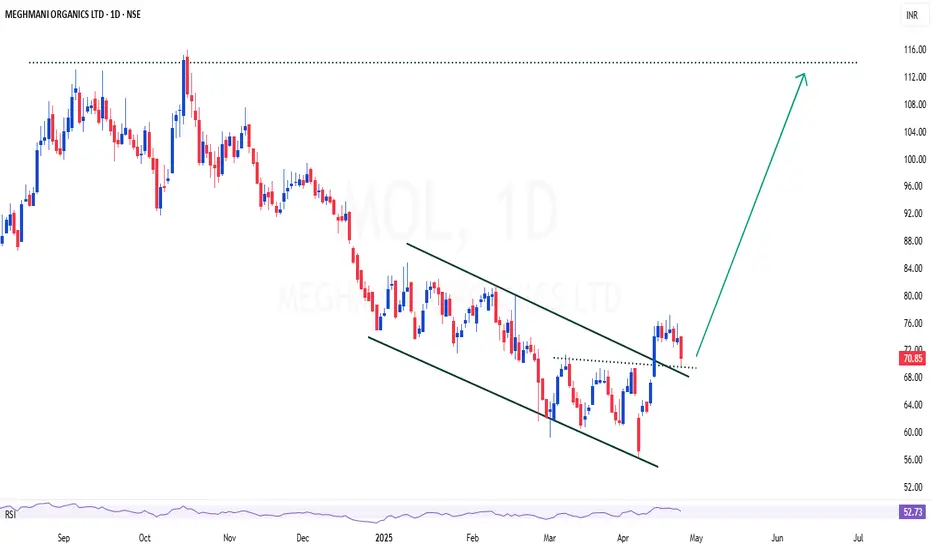
MOL | One more time - trying to take position with stoplossMOL | One more time - trying to take position with stoploss
As this is my favorite stock, but its under performing for a long time. This setup looks good for 50-60% for short term.
Trendline + Small channel breakout
CMP : 70
SL : 65
Target : 110
MAITHANALL | One of my favorite stock - But this time tradingMAITHANALL | One of my favorite stock - But this time trading
Trendline breakout - Looks good for 40%
CMP : 965
SL : 900
Target : 1300

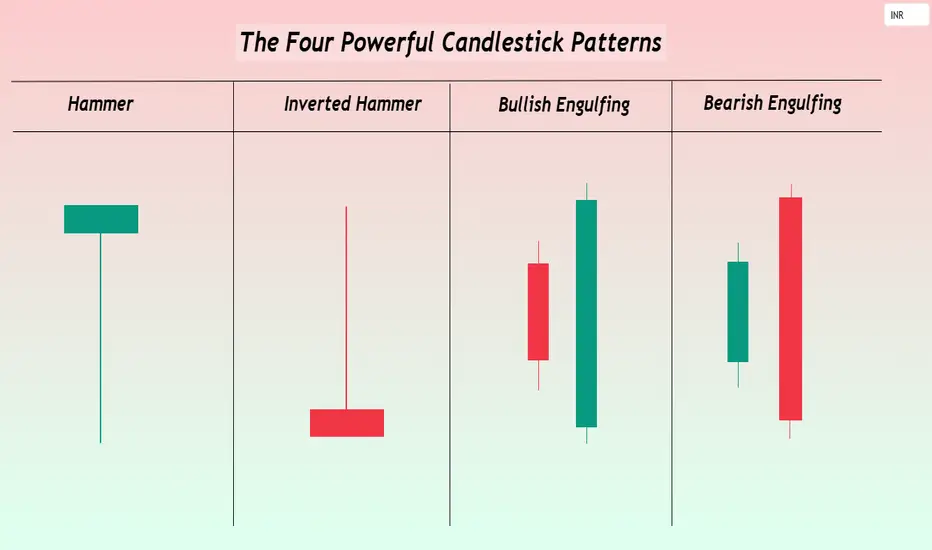
The Four Powerful Candlestick PatternsHello TradingView Community and Friends here I am sharing the four of the most powerful candlestick patterns every trader should know especially to the new entrants to technical analysis and that are-: Hammer, Inverted Hammer, Bullish Engulfing, and Bearish Engulfing.
These patterns are not just visual shapes they reveal critical shifts in market sentiment and offer high probability trading opportunities when interpreted correctly.
I hope this article adds real value to your trading journey. Feel free to share your thoughts and experiences in the comments, sharing below the Four Powerful Candlestick Patterns.
1-Hammer: The Bullish Reversal Indicator Structure and Appearance-:
A small real body located near the top of the price range.
A long lower wick that is at least twice the size of the body.
Little or no upper shadow.
Psychology-:
During the session, bears push the price significantly lower, but bulls step in aggressively, driving the price back near the open.
The result is a strong potential bottoming signal showing that buyers are regaining strength.
Trading Strategy-:
Most effective after a steep downtrend or during oversold conditions.
Confirmation is essential: the next candle should close above the Hammer’s high to validate the reversal. A prudent stop-loss can be placed just below the low of the Hammer.
2-Inverted Hammer: a Subtle Bullish Rreversal signal, Structure and appearance-:
A small real body located near the bottom of the trading range.
A long upper wick that is at least twice the size of the body.
Very little or no lower shadow.
Psychology-:
Buyers attempt to push prices higher during the session but face selling pressure.
However the very presence of buying pressure after a downtrend hints at underlying bullish interest starting to emerge.
Trading Strategy-:
Most useful after a strong downtrend when signs of exhaustion appear.
The confirmation is again crucial a strong bullish candle following the Inverted Hammer gives a higher probability setup.
Risk can be controlled by placing a stop-loss below the Inverted Hammer’s low.
3-Bullish Engulfing: Buyers Taking Over Structure and Appearance-:
A large bullish (green) candle that completely engulfs the previous small bearish (red) candle’s body.
Ideally, the bullish candle opens lower and closes higher than the previous candle’s range.
Psychology-:
Initial selling pressure is absorbed and reversed with strong buying momentum.
A complete shift in sentiment from bears to bulls is reflected in the engulfing candle.
Trading Strategy-:
Most powerful when appearing after a sustained downtrend or at key technical support levels.
Traders often enter on a break above the Bullish Engulfing candle’s high.
Volume confirmation higher than average during the pattern significantly strengthens the signal.
4-Bearish Engulfing: Sellers Seizing Control, Structure and Appearance-:
A large bearish (red) candle that fully engulfs the previous small bullish (green) candle’s body.
Ideally, the bearish candle opens higher and closes lower than the previous candle’s range.
Psychology-:
An initial bullish attempt is overwhelmed by aggressive selling pressure.
Bears decisively regain control, warning of a potential downside move.
Trading Strategy-:
Highly effective when occurring after an extended uptrend or near strong resistance zones.
Traders can initiate short positions on the break below the Bearish Engulfing candle’s low, with stops placed just above the pattern’s high.
Increased volume during the engulfing candle boosts the credibility of the reversal.
Key Techniques for Trading These Patterns Successfully-:
Always wait for confirmation a single candle is never enough subsequent price action is critical.
Volume matters- Candlestick signals accompanied by a surge in volume are generally more reliable.
Focus on key price zones- Patterns occurring near major support, resistance, or Fibonacci levels have a much higher success rate.
Risk management remains supreme- No pattern guarantees success. Appropriate stop-loss placement and calculated position sizing protect against false signals.
Conclusion-:
The Hammer, Inverted Hammer, Bullish Engulfing, and Bearish Engulfing patterns remain among the most trusted tools in a trader’s arsenal.
They capture critical moments when the balance of power between buyers and sellers shifts often leading to strong follow through moves.
However even the most powerful candlestick setups require patience, discipline, and proper confirmation.
By mastering these patterns and integrating them into a well rounded trading plan, traders can anticipate key market moves, time their entries better, and ride trends with greater confidence.
Focus on learning the language of price, and the markets will start speaking to you more clearly.
Hope you like this publication.
Best regards-Amit
Fino payment bank is on bullish reversal mode.Fino payment bank is on bullish reversal mode.
As per chart it forms double bottom pattern with divergence and also showing confirmation of morning star on monthly chart.
It may test level 444 soon, 80% returns.

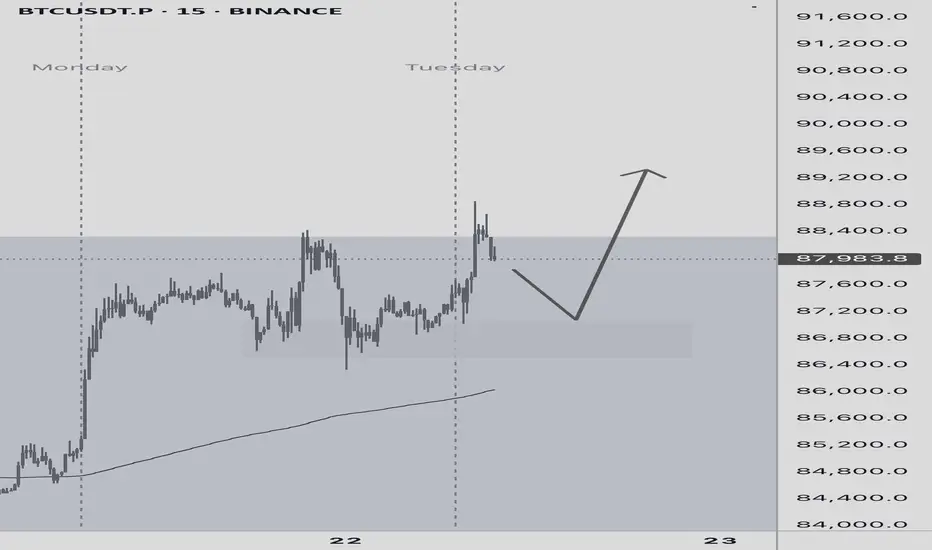
BTC on the 15-minute chart looks beautiful this Monday, doesn’t ✅ BTC on the 15-minute chart looks beautiful this Monday, doesn’t it guys?
Let’s watch for a pullback to the 87k zone — if there’s a rejection candle, smash that Long and ride it up!
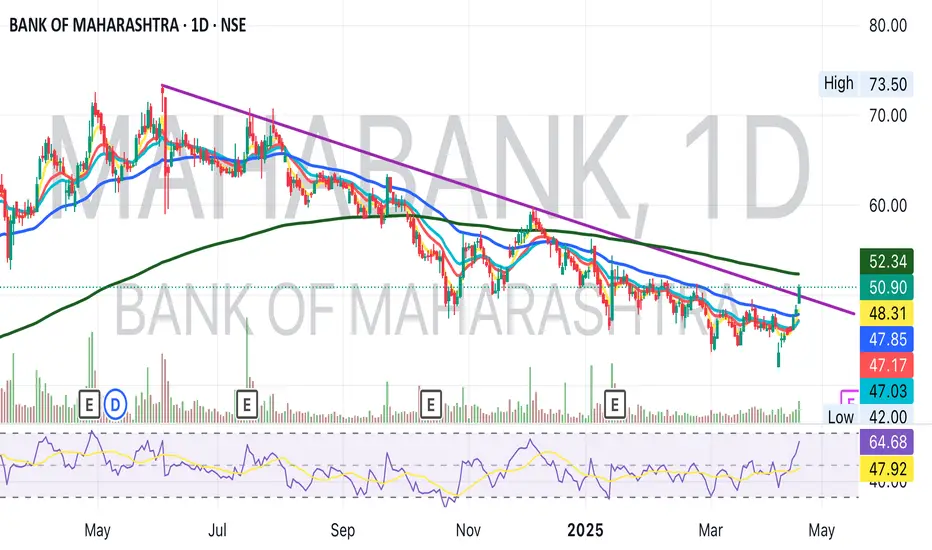
Bank of Maharashtra Trendline Breakout Key Ratios
Capital Adequacy Ratio - 17.38% in FY24 vs 16.48% in FY22
Yield on Advances: 8.94% in FY24 vs 7.29% in FY22
Cost of Fund: 3.95% in FY24 vs 3.35% in FY22
NIM - 3.97% in FY24 vs 3.17% in FY22
Cost to Income: 37.55% in FY24 vs 44.26% in FY22
ROE: 23.8% in FY24 vs 11.5% in FY22
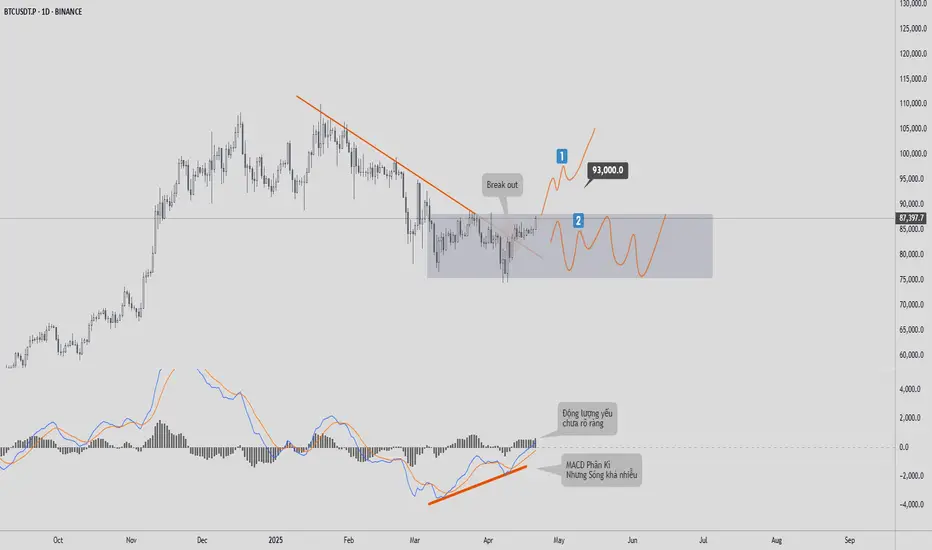
BITCOIN PRICE UPDATE – April 21, 2025🔴 BITCOIN PRICE UPDATE – April 21, 2025
💰The D1 chart of
BTC
is currently showing a pretty solid buying signal. From the 78k support zone, we can see that buyers have stepped in. Although the price has broken the downtrend line and there are positive signals from the MACD, I have the following observations that you should pay close attention to before making any trading strategy decisions during this period:
1. The trendline breakout signal doesn’t necessarily indicate that the market is entering an uptrend. It could simply mean that the downtrend has temporarily ended.
2. There is a divergence signal on the MACD; however, I don’t place much weight on this, because the two lines are wrapped tightly around each other. From my experience, this signal shows more of a “PROBING” move rather than strong buyer commitment.
3. I also checked the momentum indicator, and it doesn’t show any clear bullish signals yet. This phase still doesn’t give a high-confidence indication that the market is about to reverse.
Based on these three reasons, I have two potential views for this phase:
✔️View 1: The ideal scenario is that
BTC
continues to rise toward the nearest liquidity peak (around 93k), but it would still need to pull back afterward to retest the support zone—it’s unlikely to just skyrocket without correction.
✔️View 2:
BTC
reverses at this point and forms a consolidation zone within the gray box, with price fluctuating in an 8k–10k range for the next 3 to 6 months, before making a decisive move in Q4/2025.
Personally, I lean more toward **View 2**! Because the market still lacks a clear bullish signal at this stage.
What do you think about these two scenarios? Drop a comment and let’s discuss!
The Market Speaks in the First Hour Learn to ListenDear TradingView Community and Fellow Traders, Wishing you all a focused and fulfilling trading journey. Each day in the market brings its own rhythm, and recognizing that early can make all the difference. In this piece, I’m sharing a concept that continues to shape my intraday approach, the First Hour Range. It’s a simple yet powerful framework that can offer clarity right from the start of the session.
Let’s explore how the first 60 minutes can set the tone for the entire trading day.
Body-:
The first hour of the trading session is one of the most dynamic and information-rich periods of the day. It lays the groundwork for what often becomes the day’s dominant trend, volatility structure, and psychological narrative. Whether you're a scalper, momentum trader, or swing trader analyzing intraday flow, the first hour can act as your primary map.
Understanding the First Hour Range-:
The First Hour Range is defined by the highest and lowest prices achieved during the first 60 minutes after market open. These two levels create a clear boundary that reflects the initial battle between buyers and sellers, often influenced by overnight global cues, news events, gap openings, and institutional order flow.
This range can be seen as a "price cage" a zone that either contains the price action for the rest of the session or is decisively broken to signal continuation or reversal.
Why Is This Range So Important?
High Volume and Volatility-: The opening hour is typically where the highest intraday volume occurs. This influx of participation leads to price discovery, as market participants react to overnight developments, pre-market news, and opening gaps.
Reference for Support and Resistance-: The high of the first hour acts as early resistance. The low acts as intraday support. If price breaks above or below this range later in the session, it’s often accompanied by strong follow-through, especially when confirmed with volume.
Bias Detection-: Traders can assess whether the session is likely to be trending or range-bound by observing how price behaves around the first hour range. A clean breakout and sustained move away indicates trend conviction. Repeated rejection from the edges hints at indecision or mean-reversion behavior.
Breakout Triggers-: Many intraday breakout strategies use the first hour range as a trigger zone. Long entries may be placed just above the high of the range, while short entries might be taken below the low. Traders often use volume spikes or candle confirmation (e.g., engulfing or Marubozu) for added conviction.
Fakeouts and Traps: On some days, price may breach the range high or low and then reverse back within it. This is known as a failed breakout or fakeout, often trapping aggressive breakout traders. For experienced traders, these traps can be lucrative countertrend setups with tight stop-loss placements.
Types of Market Days Based on First Hour Behavior
Trend Day-:
Price breaks out of the range early and continues in the direction of the breakout with minimal pullbacks. Look for rising volume and shallow retracements.
Range-Bound Day-:
Price stays within the range for most of the session, often forming a sideways consolidation. These are ideal for mean-reversion traders using oscillators or reversal patterns near the extremes.
Reversal Day-:
The initial breakout fails, and price reverses strongly in the opposite direction. Look for volume divergence or key reversal candlesticks like pin bars or bearish/bullish engulfing patterns.
Tips for Using the First Hour Range Effectively
Always mark the first hour high and low on your intraday chart, regardless of your trading style. It serves as a reference throughout the day.
Align higher timeframe bias (e.g., daily or 4-hour chart) with the breakout direction to improve probability.
Watch how price reacts at the range extremes. Wick rejections, reversal candles, or hesitation often precede strong counter moves.
In choppy markets, wait for a retest of the breakout level before entry this improves confirmation and reduces false signals.
Psychological Importance
The first hour is not just about price it’s about trader psychology. Emotional decisions, early fear or greed, profit-taking from overnight positions, and smart money manipulation all unfold during this time. Reading this layer helps you better anticipate the day’s rhythm.
Conclusion-:
The First Hour Range is a deceptively simple yet incredibly effective framework to assess market structure, trade opportunities, and risk zones. It’s a tool that adapts well to all kinds of markets equity indices, forex, commodities, or crypto.
Make it part of your daily routine. Observe how price respects or disrespects it. Use it to align your trades with market momentum or fade the crowd when the context favors reversals.
More often than not, the market whispers its intention in the first 60 minutes. The traders who are listening closely tend to ride ahead of the curve.
Best Regards- Amit

Gold Technical - Weakly (21 To 26 Apr-2025)#GOLD (XAU/USD) Technical Analysis - April 19, 2025
Current Price & Trend: Gold is trading around $3,327 maintaining a strong bullish trend despite a slight retreat from its all-time high of $3,357 earlier this week. The price remains within an ascending channel, with higher highs and higher lows on the daily chart, confirming bullish momentum.
#ChartPatterns for your reference
#XAUUSD

RCF is in bullish mode.RCF is forming evening star candle stick pattern on monthly chart.
As per chart it may test 240 soon as it is previous high level.
Returns around 78%.
As per report upcoming monsoon session will be better than expectation.
It is in Demand zone can long it for next 2-4 months.

Clear upside direction in Banknifty for Indian Market. Soon ATHBanknifty has sustained above 50 sma and also has closed convincingly above the fibo channel of 78.6% on daily timeframe. Along with that long term trend and momentum indicators also have confirmed the bullishness. Once we see 50sma crossing above 200sma then the run will be extended and we will see an ATH after crossover happens on daily timeframe. The first target is 57600 and after that ATH
