Candlestick Analysis

ALKYLAMINE | Strong RSI divergence since 2024ALKYLAMINE | Strong RSI divergence since 2024
Looks good for big reversal - 30-40% potential for short term
Debt free and stable company

25900 is here! What’s next!?As we can see NIFTY did fell over 500++ points from our supply zone as analysed hitting or targets and now it can be seen trading at very important zone from where NIFTY reversed previously so we may expect NIFTY to show some minor short covering before finally heading towards our trendline support so plan your trades accordingly and keep watching everyone.

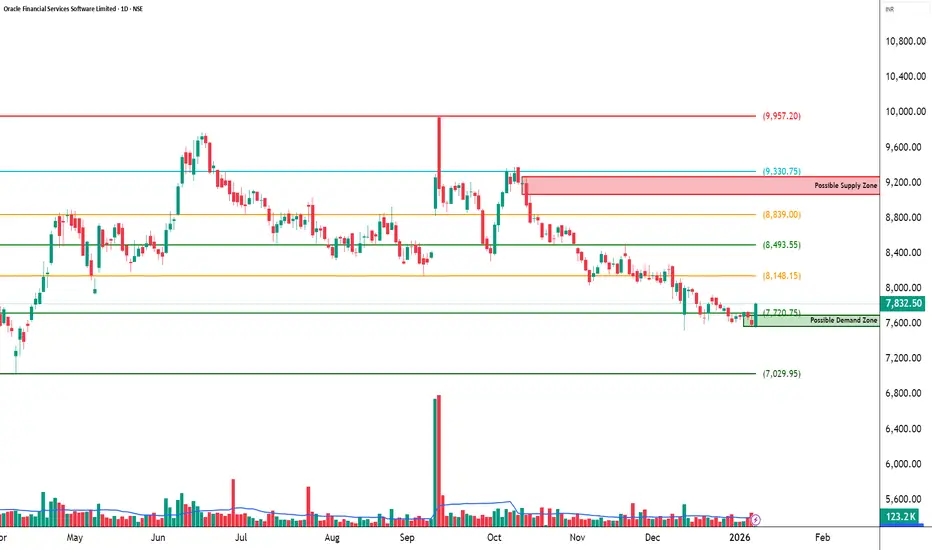
OFSS - STWP Equity SnapshotSTWP Equity Snapshot – OFSS (Educational | Chart-Based Interpretation)
📌 Intraday Reference Levels (Structure-based)
Reference Price Zone: 7,841
Risk Reference (Structure Invalidation): 7,432.87
Observed Upside Zones: 8,330.75 → 8,657.26
📌 Swing Reference Levels (Hybrid Model | 2–5 days | Observational)
Reference Price Zone: 7,841
Risk Reference (Structural Breakdown): 7,324.35
Higher Range Projection (If structure sustains): 8,874.29 → 9,649.27
Key Levels – Daily TF
Support: 7,643 | 7,455 | 7,356
Resistance: 7,931 | 8,030 | 8,219
🔍 STWP Market Read
Oracle Financial Services Software Ltd is attempting a base-building recovery after a prolonged corrective phase. Price has recently reacted positively from a defined demand zone, while overhead supply remains visible across clustered resistance bands. The latest rebound reflects improving participation, though confirmation is still evolving.
Momentum indicators are balanced rather than aggressive, with RSI near 48.48, suggesting stabilization without overextension. Volume remains around average (Vol X ~1.46), indicating participation but not yet a decisive expansion. Overall, the structure points to early stabilization with conditional upside, while risk remains elevated until price sustains beyond nearby supply.
📊 Chart Structure & Indicator Summary
Structure: Corrective base with early rebound
Trend: Improving, not yet dominant
Momentum: Strong recovery attempt, still developing
RSI: Healthy zone — neither stretched nor weak
MACD & ADX: Gradual improvement, trend strength building
Volume: Moderate, awaiting confirmation
📈 Final Outlook (Condition-Based)
Momentum: Strong (developing)
Trend: Improving / Early up-bias
Risk: High (overhead supply & confirmation pending)
Volume: Moderate
💡 STWP Learning Note
Recoveries are processes, not events. Strong outcomes emerge when price structure, momentum, and volume align over time — patience and risk discipline remain essential.
⚠️ Disclaimer:
This is an educational market interpretation based on chart structure and publicly available data. It is not a recommendation, advice, or solicitation. Equity markets involve risk. Please consult a SEBI-registered financial advisor before taking any investment or trading decision.
📘 STWP Approach:
Observe momentum. Respect risk. Let structure guide decisions.
💬 Did this add value?
🔼 Boost to support structured learning
✍️ Share your views or questions in the comments
🔁 Forward to traders who value disciplined analysis
👉 Follow for clean, probability-driven STWP insights
🚀 Stay Calm. Stay Clean. Trade With Patience.
Trade Smart | Learn Zones | Be Self-Reliant 📊
SHRINGARMS: Fresh ATH Breakout | Swing Trade SetupChart Analysis
Price broke above the prior ATH around 213-218 levels (52-week high noted as 213.35 on Oct 10, 2025), confirming uptrend continuation with EMAs aligning bullishly (20 EMA support visible). Volume supports the move, and the pin marker likely highlights the breakout zone near 240-242 as a swing entry. Invalidation sits below the recent swing low (~230 area from chart).
Trade Setup
• Entry: 240-242 pullback to breakout zone or EMA support for swing long.
• Target: Next resistance at 260+ (open-ended on ATH break), aiming 1:3+ R:R.
• Stop: Trail below 20 EMA or hard stop under swing low (~228-230).
Risk 1-2% per trade; monitor for EMA hold as primary trend filter.
Company Snapshot
SHRINGARMS manufactures mangalsutras (gold jewelry), listed Sep 2025 on NSE with market cap ~₹1,900-2,300 Cr and strong ROE (36%). Recent price ~212-228, fitting your chart’s 240+ action as of Jan 2026.
This setup suits swing trading in gems/jewelry sector momentum; educational only, not advice. Track daily closes above EMAs.

TREND LINE BREAKOUTBIRLANU has clearly trendline breakout. Simple chart, self explained study.
Can make 1900+ with less risk.

Expecting NIFTY to come 25900!As we can see NIFTY fell and remained negative throughout the day as analysed. Now it can be seen trading around important demand zone and hence we may see NIFTY taking some short covering but overall it’s a bearish sentiment making sell on every rise so plan your trades accordingly and keep watching everyone.

ANAND RATHI WEALTH looking north ATHAnand Rathi Wealth strong candle stick pattern. Trend line support is followed..
Logical resistance has been broken for testing. Can go long (analysis or study purpose only) with 3049 as SL.. 3%SL Reward is open.

HFCL could be a quick 10-15%After a long time showing some strong green candle. Candlestick analysis along with ADX and RSI hints BTST type, can give one strong move within week to 10 days period

Will remain short unless NIFTY breaks above previous high! As we can see NIFTY did show some rejection as analysed in our previous post and fell. We will stand by our analysis as Nifty is still trading in his supply zone and unless NIFTY sustains itself above previous swing every rise can be sold so plan your trades accordingly and keep watching everyone

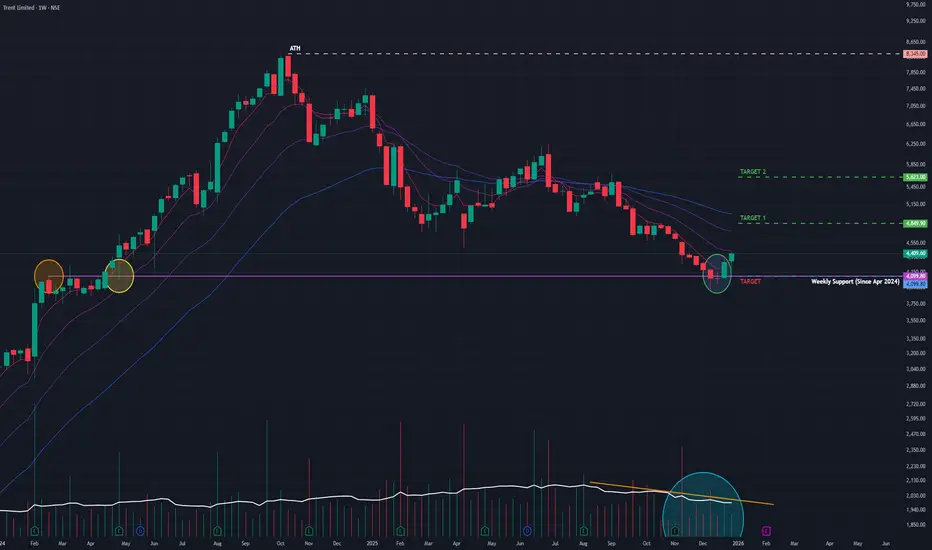
Trent (W): Bullish Reversal, Trend Reversal at Major SupportTimeframe: Weekly | Scale: Logarithmic
The stock is staging a classic reversal after a brutal 2-month correction. The "Morning Star" and "Hammer" combination at the 200-day EMA equivalent support signals that the "Panic Selling" is over and "Smart Money" accumulation has begun.
🚀 1. The Fundamental Catalyst (The "Why")
The reversal is driven by a shift in market perception:
> Valuation Comfort: After correcting ~50% from the top, the stock's valuation has cooled off significantly, attracting long-term institutional buyers who missed the earlier rally.
> Q3 Expectations: Investors are positioning for strong Q3 FY26 numbers, driven by the heavy wedding season demand in December, which directly benefits Westside and Zudio sales.
📈 2. The Chart Structure (The Complex Bottom)
> The Floor: ₹3,865 – ₹4,100 zone was a resistance in early 2024 and has now flipped to become a rock-solid support (Polarity Principle).
> The Pattern:
- Week 1 (Dec 8): Formed a long-legged Doji/Hammer at support (Stopping Volume).
- Week 2 & 3: Followed by a Morning Star formation (a bullish reversal pattern).
- Current Action: The confirmed Hammer this week shows that every dip is being bought aggressively.
📊 3. Volume & Indicators
> Volume: Volume was low during the drop (weak selling). The recent uptick in volume on bullish candles confirms Accumulation .
> RSI: The Weekly RSI turning up from the "Oversold" zone (near 30-40) is a high-probability buy signal in strong uptrends.
🎯 4. Future Scenarios & Key Levels
The stock is primed for a relief rally that could turn into a new trend.
> 🐂 Bullish Targets (The Recovery):
- Target 1: ₹4,850.
- Target 2: ₹5,625
- Blue Sky: If it clears ₹5,625, the structure shifts back to a full bull run targeting ATHs.
> 🛡️ Support (The "Must Hold"):
- Immediate Support: ₹4,100 . The "Shoulder" of the reversal pattern.
- Stop Loss: A close below ₹3,850 would invalidate the Morning Star and suggest a deeper fall to ₹3,400.
Conclusion
This is a Grade A Reversal Setup.
> Refinement: The structure is "Oversold Bounce" turning into "Trend Reversal."
> Strategy: This is an ideal entry point. Accumulate near ₹4,200–4,300 with a stop at ₹3,850 for the ride back to ₹4,850+ .
DLF LONGDLF is moving in sideways (As per long term chart), I see it is consolidated for few days after downside. Now it will move to upside from cmp 698.70 to 727 in short term.
I have shown downward and consolidation in chart. If it close below 698 (Hourly basis) will be considered still as consolidation. Please keep this small stop-loss if buying it.

Crompton Greaves Falling?Technical (upgrade)
Crompton Greaves Consumer Electricals has been sliding inside a falling wedge, but price is trying to base around ₹248-252 (teal support on your chart). A daily close above ~₹260–262 (wedge top/near-term trendline) would confirm a breakout and set up a move toward ₹275 first and ₹300 next If price fails and closes back below ₹248, treat it as a false start and expect the downtrend to resume keep risk tight in that zone.
Fundamentals (quick, clean)
Latest print showed mixed trends—Q2 FY26 consolidated revenue ~₹1,915.6 cr, PAT ~₹75.4 cr, with margin pressure; the quarter also carried an exceptional ₹20.36 cr charge for the Vadodara plant restructuring. Butterfly (kitchen appliances) grew double‑digits YoY and lighting rose ~3% YoY, partly offsetting weakness in electric consumer durables. The company fully repaid its ₹300 cr NCDs in Jul‑2025 and said it is net‑cash/zero‑debt, which is a positive for flexibility. Valuation and efficiency are mid‑pack for consumer durables (P/E ~34–35; P/B ~4.3–4.9; ROE ~13–15%; ROCE ~15–19%). Net‑net: fundamentals are stable but margins need rebuilding—if your chart gets the ₹260–₹262 breakout, technicals can align with a gradual recovery story.
Like, comment your thoughts, and share this post
Explore more stock ideas on the right hand side your feedback means a lot to me!
Disclaimer: This post is for educational purposes only and should not be considered a buy/sell recommendation.

GBPUSD broke level of 1.34820As you can see GBPUSD broke level of 1.34820 and massive fall already happened so I give you next expected move.
Plan your trade accordingly.

Strong RECOVERY exactly as analysed! But will it sustain!?As we can see NIFTY recovered sharply exactly as analysed as it took support at our demand zones! But it is too quick now to judge the upcoming trend by single day move as it could be a sentiment based volume which doesn’t last long. Hence as long as NIFTY doesn’t crosses and closes itself above previous swing, shorting at signs of rejection around supply zones can be done so plan your trades accordingly and keep watching everyone.

Hudco Cmp 211.25 dated 19-12-2025 Hammer Candle @ SupportHudco Cmp 211.25 dated 19-12-2025
1. Hammer Candle @ Support
2. Price reversed from support
3. RSI reversal
Buy @ cmp SL 204 target 215-218-220-223-225-228-230
It is just a view, please trade at your own risk.

SIGN of REVERSAL!?As we can see NIFTY did manage to form more like a doji called showing indecision around our demand zone. This shows we are trading at demand zone but yet to test the trendline support hence a great would be when we could see a sign of reversal around the trendline so plan your trades accordingly and keep watching everyone

12 MONTHS HIGH_LAURUSLABS_LONGTERM TRADEHi traders,
Posting the interesting Topic on LAURUSLABS with Technical Analysis long-term view.
Currently LAURUSLABS is trading at INR 1091.90 with longer term bullish Veiw.
Entry at current level with stoploss of 12 Months low. Ride the trend until it closes previous yearly low price or Market Structure.
Note:_ Only for Educational purpose Since investments in Securities and market are subjected to market risk

12 MONTHS CANDLE_AU BANK_LONGTERM TRADEHi traders,
Posting the interesting Topic on AU SMALL FINANCE BANK with Technical Analysis long-term view.
Currently AU SMALL FINANCE BANK is trading at INR 996.45 with longer term bullish basis.
Entry at current level with stoploss of 12 Months low. Ride the trend until it closes previous yearly low price or Market Structure.
Note:_ Only for Educational purpose Since investments in Securities and market are subjected to market risk.

Modern Insulators - Rounding Bottom PatternModern Insulator is heading towards a 100% gain. Factors:
1. Rounding Bottom Pattern on weekly time frame - look at last week's bullish candle
2. All Time High Breakout - ATH breakout from 2024 price, after so many rejections it has finally given a breakout
3. Company has shown growing revenue and profit trends, QoQ profits are increasing. 50% of revenue from exports.
4. Electrification of Indian Railways - Modern insulators is one of the largest supplier of insulators to railways.
Given the above, this stock looks strong!!
Keep following @Cleaneasycharts as we provide Right Stocks at Right Time at Right Price!!
Cheers!!

Morning Star in meesho Can give good returns in less time
stay invested with proper stoploss and mentioned target for low risk players
Can go beyond the target

Solana Technical Reversal: MA Compression Resolves to the UpsideSolana is trading around 126 levels and there is a support which is being respected around 125 levels.
For last few weeks, no considerate candle is there. Only doji are being formed which shows the sideways moment in the charts.
If the market cycle changes, turning bullish, an entry can be made above 127 levels expecting a 10-11% movement in the crypto.
Major trend is bearish, Minor trend sideways.
The major support is around 100-110 level zone and there is not much of fall to capture as it has fallen 50% since Sept 2025.
On the hourly charts, there is a liquidity grab, taking out the bullish positions created on previous occassions.
A moving averages gate is also being created on the hourly charts as all the four EMAs (20, 50, 100 & 200) are moving in small range.
Now as per my view the market is trading in a range and it is also respecting a falling resistance line. A good R:R trade is there on the bullish side.
As per the plan, bullish position can be created in the assest once it crosses 127 levels.
Stop Loss :- 122.5
Target :- 144
R:R = 1:4
Multiple confluence there to enter the trade on the bullish side. Wait for the price action near the levels before entering the trade.

AEROFLEX | RSI positive divergence + Reversal signalsAEROFLEX | RSI positive divergence + Reversal signals
CMP : 193
