Candlestick Analysis
Bearish Hammer - Ema and Rsi Confirmation🔎 Overview
The Bearish Hammer with EMA and RSI Confirmation is a structure-based reversal setup that focuses on price rejection at higher levels, supported by EMA positioning and RSI behavior. This setup helps filter weak candles and highlights situations where selling pressure begins to emerge after an upward move.
────────────────────────────
📘 EMA & RSI
EMA (Exponential Moving Average)
• EMA represents short-term price balance and dynamic support/resistance.
• The EMA High–Low Band defines the acceptable price zone for healthy trend structure.
RSI (Relative Strength Index)
• RSI measures momentum strength.
• The RSI MA (signal line) helps confirm whether momentum is sustaining or shifting.
────────────────────────────
🛠 How to Use
Bearish Hammer Formation Rules
• The Bearish Hammer must form at a swing high.
• The candle should show rejection from higher prices with a long upper wick.
• This indicates exhaustion of upward price movement.
────────────────────────────
✅ Validation & Devalidation Rules
Validation (Reversal Confirmation)
• A successive candle close below the low of the Bearish Hammer confirms the setup.
• This shows acceptance below the rejection zone.
Devalidation (Failure Protection)
• A successive candle close above the high of the Bearish Hammer invalidates the setup
────────────────────────────
📌 EMA Band Confirmation
• The Bearish Hammer must form completely above the EMA High–Low Band.
• The EMA High–Low Band should NOT touch the Bearish Hammer candle.
• This confirms that price is stretched away from value and rejection is valid.
────────────────────────────
📉 RSI Confirmation
• RSI should be above its MA line.
• This reflects mature momentum before rejection occurs.
• RSI alignment helps filter low-quality signals.
────────────────────────────
📊 Chart Explanation
• Bearish Hammer forms at a clear swing high.
• EMA High–Low Band remains below the candle, confirming price extension.
• Validation and devalidation lines define the decision zone.
• RSI supports momentum context during the setup.
────────────────────────────
📝 Summary
• Swing-high Bearish Hammer highlights rejection.
• EMA High–Low Band confirms price stretch.
• RSI MA alignment validates momentum context.
• Validation and devalidation levels provide clear structure.
• The setup emphasizes rule-based and disciplined analysis.
────────────────────────────
⚠️ Disclaimer
📘 For educational purposes only.
🙅 Not SEBI registered.
❌ Not a buy/sell recommendation.
🧠 Purely a learning resource.
📊 Not Financial Advice.

USDJPY – Potential for a Volatile End to the WeekIt’s the last full trading week of the year before the Christmas break but that doesn’t necessarily mean that FX markets will be quiet. The calendar is still packed full of important risk events, and when combined with the possibility for decreasing levels of liquidity into Friday’s close it could be a recipe for volatility.
Take USDJPY for example. It has already been the biggest mover in the G7 currency space with its fall from opening levels at 155.80 on Monday down to a low of 154.68 so far this morning and the key risk events are still to come. These events take the form of US Non-farm Payrolls later today (1330 GMT), US CPI on Thursday (1330 GMT) and then the Bank of Japan interest rate decision (0300 GMT) and press conference (0630 GMT) on Friday.
Traders have been eagerly awaiting today’s latest US payrolls release which could impact the direction of the US Dollar in the short term. A weaker US labour market reading may increase the chances for a Federal Reserve interest rate cut in the first quarter of 2026, which could weigh on USDJPY prices, while a stronger number could see USDJPY strengthen.
Similarly, the direction of US inflation on Thursday could be important as some Fed policymakers have signalled they are uncomfortable with prices rising consistently above the US central bank’s 2% target. A higher-than-expected CPI reading could see US bond yields rise, taking USDJPY higher, while a weaker number could see USDJPY come under pressure as the focus shifts to the Bank of Japan rate decision on Friday morning.
At this meeting, the Japanese central bank is expected to raise interest rates by 25bps (around 90% probability), so anything else would be a shock that may lead to a nasty spike in USDJPY volatility. The comments of Governor Ueda in the press conference could also be important depending on what hints he gives about the potential for further rate hikes through 2026.
That’s it, and yes, I know, a lot to take in and prepare for! Looking at the charts, USDJPY has been in a 270-point trading range between 154.30-157.00 for the last month and there could be potential for that to change.
With that in mind, lets assess the technical outlook.
Technical Update: Are Further Corrective Themes Emerging?
The USDJPY rally from the 154.34 December 5th low to the 156.96 December 9th high was impressive, yet subsequent price action may be suggesting a slowing in upside momentum, even further price weakness.
A key concern for traders may be that the December 9th high remained well below the November 20th extreme at 157.89, reinforcing caution regarding near‑term price activity.
The risk is that this activity represents a ‘weak test’ of the 157.89 price high. In other words, while previous moves higher were accompanied by buying support strong enough to break and close above prior highs and resistance levels, this time the market has been unable to do so, raising concerns over the sustainability of upside momentum.
Traders may now question whether recent price activity signals a slowing of upside momentum and the potential for a phase of weakness. Much may depend on future sentiment once the outcome of the key risk events is known, making it prudent to remain aware of the key support and resistance levels as key reference points in the days ahead.
If Price Weakness is to Materialise:
It may still be argued that activity since the November 20th high reflects a phase of price consolidation within the longer‑term uptrend. Therefore, the focus may initially turn to the December 5th low at 154.34 as the first key support level.
Closing breaks below 154.34 could suggest a developing pattern of lower highs and lower lows, which is the basic definition of a downtrend. Should this occur, risks may then shift toward further price weakness with scope to test lower supports.
As the chart shows, closing breaks below support at 154.34 could see a deeper retracement of the October 1st to November 20th advance. If this is the case, the 38.2% level at 153.16 may be tested, with scope for extension towards the 50% retracement at 151.70.
If Support Holds and Price Strength Develops:
Of course, the 154.34 December 5th low support may yet hold and allow fresh price strength to develop. In that case, the focus may then turn to 156.01, the current level of the Bollinger mid‑average, as the first resistance. Closing breaks above 156.01 might now be required to open scope for higher levels
A confirmed break above 156.01 in USDJPY could trigger further upside pressure, with 156.96, the December 9th high, emerging as the next resistance. Should this level also give way, upside potential may extend toward 157.89, the November 20th high
The material provided here has not been prepared accordance with legal requirements designed to promote the independence of investment research and as such is considered to be a marketing communication. Whilst it is not subject to any prohibition on dealing ahead of the dissemination of investment research, we will not seek to take any advantage before providing it to our clients.
Pepperstone doesn’t represent that the material provided here is accurate, current or complete, and therefore shouldn’t be relied upon as such. The information, whether from a third party or not, isn’t to be considered as a recommendation; or an offer to buy or sell; or the solicitation of an offer to buy or sell any security, financial product or instrument; or to participate in any particular trading strategy. It does not take into account readers’ financial situation or investment objectives. We advise any readers of this content to seek their own advice. Without the approval of Pepperstone, reproduction or redistribution of this information isn’t permitted.

Positional or Long Term Opportunity in NLC IndiaGo Long @ 244.9 for Targets of 288.1 and 298.9 with SL 234.1
Reasons to go Long :
1. On Weekly timeframe If we draw Fibonacci retracement from the recent swing low (A) to the swing high (B) then the stock took support from the 0.5 Fibonacci level.
2. In addition to this, the stock formed a Bullish Hammer Pattern (marked with a orange color) around 0.5 Fibonacci level.
3. Also the stock gave a Trendline breakout (marked with a red color).
4. Also there is a strong Trendline (marked with green color) which supports the stock.

US 500 – Next Moves on a Knife EdgeIt’s often said that fear and greed underpin moves across financial markets and that was certainly the case for US indices at the end of last week.
Focusing on the US 500, prices first reacted positively to a Federal Reserve interest rate cut which was accompanied by a more dovish outlook than many traders had anticipated from Chairman Jerome Powell in the press conference. This added fuel to hopes for a Santa rally to end 2025, briefly taking the US 500 index up to its previous record highs of 6924 on Thursday.
However, that period of greed didn’t last long before fear took over, when a disappointing sales forecast from Broadcom released after the close brought back concerns that the AI bubble may be deflating, a view that gained further momentum when it was reported on Friday that Oracle may be experiencing delays to their data centre rollout. These two important pieces of news helped to accelerate an eventual 1.3% sell off in the index down to Friday’s close at 6830.
While US 500 prices have stabilised in Asia early this morning, this battle between dip buyers, looking for a final upside flourish to challenge the psychological 7000 level and those more conservative traders, keen to bank strong year to date gains and wait for the start of 2026, could be about to renew, with the release of the latest US Non-farm payrolls on Tuesday at 1330 GMT which could provide clarity on how quickly the Fed may need to cut interest rates again at the start of 2026. This is followed by Micron’s Q3 earnings on Wednesday (after the close) where the debate of AI expenditure versus revenue may again be thrust into the spotlight.
These events could provide a volatile and challenging environment for traders to navigate, and consideration may need to be given to the technical outlook to assess whether upside momentum or downside fatigue may eventually dominate US 500 price action.
Technical Update: All-Time High Resistance Holding?
The US 500 index has staged an impressive near 6.4% advance from the 6508 November 21st session low to last week’s 6924 high. However, Friday’s sell‑off may mark the first indication that upside momentum is slowing or even failing.
In order to maintain positive price‑trending conditions, resistance levels must continue to be broken. Last week’s failure to extend strength and close above the October 30th high at 6925 may prompt some traders to question the sustainability of the recent upside price momentum.
Much will continue to depend on future price trends, but as the chart above shows, last Thursday’s high of 6924 tested resistance provided by the October 30th extreme at 6925. Importantly, this level capped prices again and downside weakness began to emerge, confirming 6925 as a key resistance focus.
Of course, Friday’s decline may yet prove to be another limited correction before fresh price strength resumes. So, it remains prudent to monitor key support and resistance levels closely in the coming week. Doing so could help to determine whether the latest activity reflects a slowing of upside momentum that could lead to further weakness, or simply a pause in the advance before renewed strength develops.
Potential Resistance Levels:
Following Friday’s price weakness after the failure to break above the 6925 high, this level now appears to be the first resistance focus for the coming week. Successful closes above 6925 would appear to be necessary to unlock potential for moves to higher levels.
While not a guarantee of continued upside, closing breaks above 6925 may signal attempts at a resumption of price strength. If confirmed, such closes could pave the way for attempts to challenge 7079, the 38.2% Fibonacci extension level, with scope for further gains toward 7176, the 61.8% extension, should that level also give way on a closing basis.
Potential Support Levels:
Friday’s weakness from the October 30th high at 6925 could now shift trader focus toward potential support at 6766, which is the 38.2% retracement of the November/December advance.
Closing breaks below 6766 could be further evidence of slowing upside momentum and might open scope for further weakness.
As the chart above highlights, closing breaks below the 6766 retracement support may expose risks of moves down toward 6717, the 50% Fibonacci level, and potentially even 6668, which is the deeper 61.8% retracement.
The material provided here has not been prepared accordance with legal requirements designed to promote the independence of investment research and as such is considered to be a marketing communication. Whilst it is not subject to any prohibition on dealing ahead of the dissemination of investment research, we will not seek to take any advantage before providing it to our clients.
Pepperstone doesn’t represent that the material provided here is accurate, current or complete, and therefore shouldn’t be relied upon as such. The information, whether from a third party or not, isn’t to be considered as a recommendation; or an offer to buy or sell; or the solicitation of an offer to buy or sell any security, financial product or instrument; or to participate in any particular trading strategy. It does not take into account readers’ financial situation or investment objectives. We advise any readers of this content to seek their own advice. Without the approval of Pepperstone, reproduction or redistribution of this information isn’t permitted.

HAPPSTMNDS - Weekly AnalysisIn the Weekly Chart of HAPPSTMNDS ,
we can see that, it has created a consolidation below the last FIBO support.
Enter on 506 with 487 as SL.

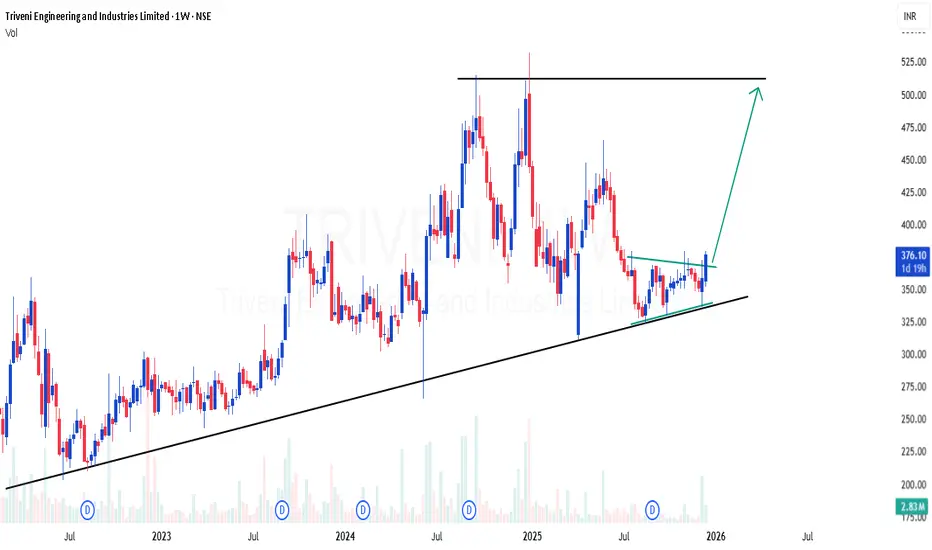
NAUKRI - Weekly AnalysisIn the Weekly Chart of NAUKRI ,
we can see that, it has created a inside Hammer candle.
Also, 1400 levels have been tested multiple times
Enter when it breaks High with low as SL.

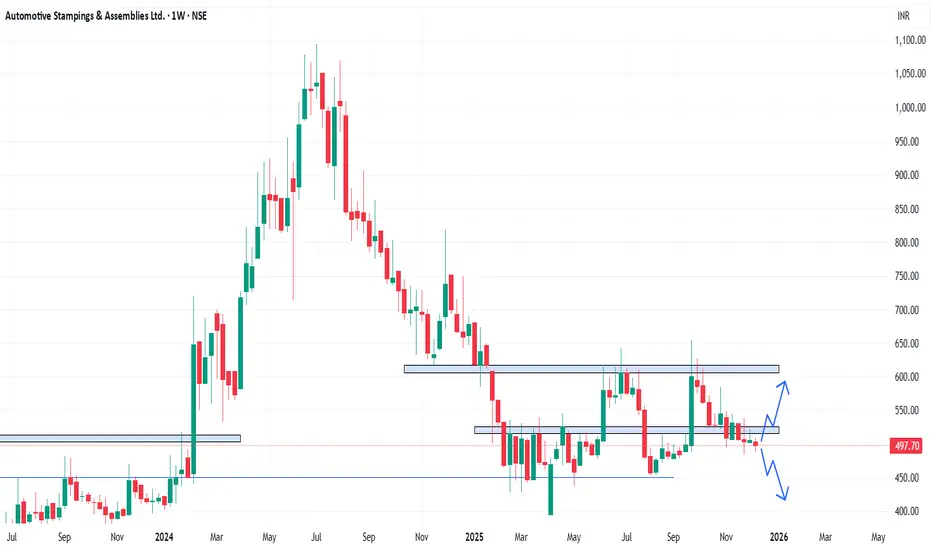
ASAL - Weekly AnalysisIn the Weekly Chart of ASAL ,
we can see that, it is at decision making point.
Possible momentums are shown in chart.
Bank Nifty: Hanging Man Confirmed Despite Fed CutLast week, Bank Nifty printed a valid Hanging Man at the Wave (5) zone, signaling potential trend exhaustion near a key Fibonacci cluster. The setup was deliberately framed as a warning, with confirmation dependent on a close below the candle’s real body.
That condition has now been met.
This week delivered a weekly close below the Hanging Man’s real body , providing bearish confirmation per classical candlestick principles. Notably, this occurred despite supportive macro developments , including a Fed rate cut mid-week , which failed to revive upside momentum. Similar to the earlier RBI action, bullish news once again struggled to extend the rally.
This combination of technical confirmation and macro tailwinds failing to lift price reinforces the view that Wave (5) topping risk is now active . While the candlestick signal confirms reversal risk, the depth and structure of the corrective phase will be determined by how price evolves from here.
Link to last week’s analysis for full context:
Disclaimer:
This analysis is for educational purposes only and does not constitute investment advice. Please do your own research (DYOR) before making any trading decisions.

BPCL | Nice cup and handle breakout and retestBPCL | Nice cup and handle breakout and retest and reversing again now
CMP : 365

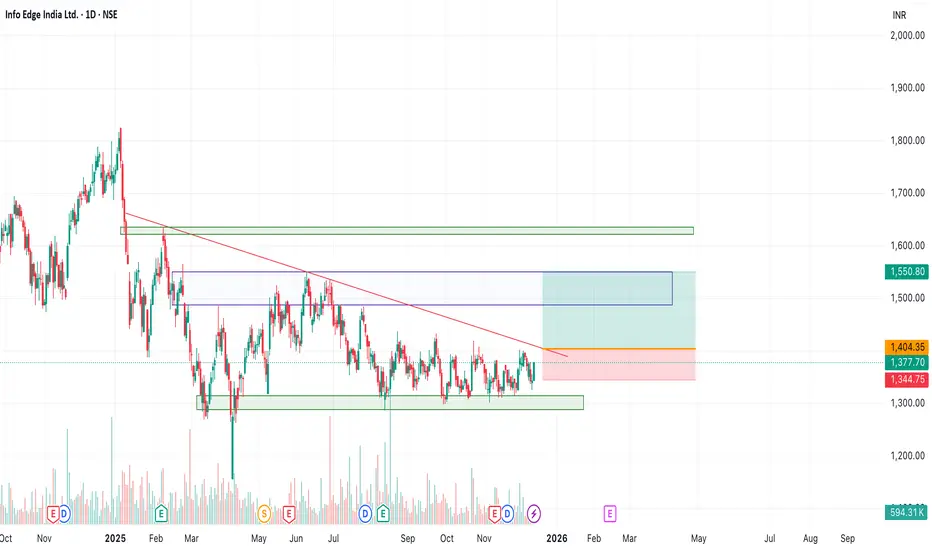
NaukriInfo Edge - Consolidation is ongoing and near breakout.
Above 1405, there is a breakout and target will be in range of 1490-1550.
Above 1550 it will be 1620-40.
Keep hold for the long term will give good returns.
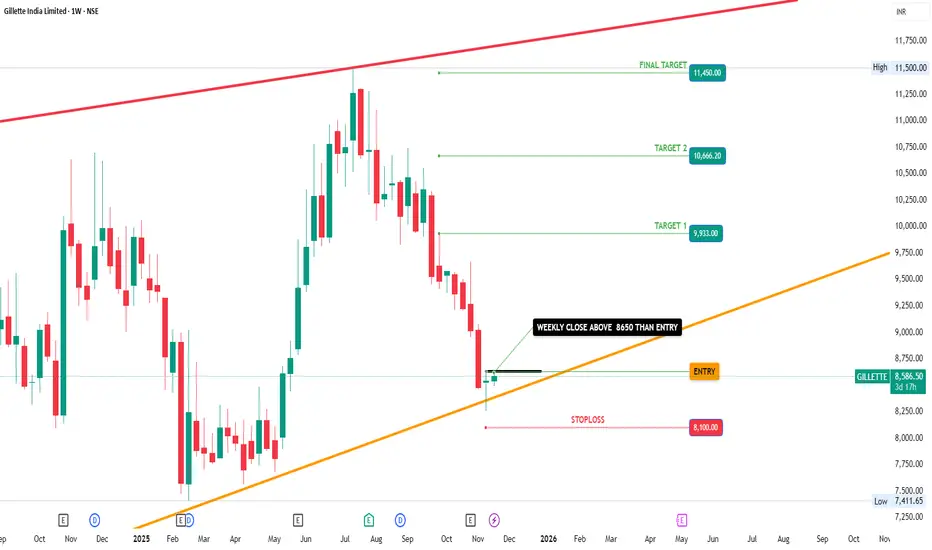
GILLETTE INDIA IN KEEP IN RADARGILLETTE now at strong trend line support on weekly time frame. Very small risk and good reward levels almost 1:4 to 1:5 so its good stock for investment for long term. So keep on watchlist for investment purpose.
FINEORG - Weekly AnalysisIn the Weekly Chart of FINEORG ,
we can see that, it has created a Pinbar on support.
Expected momentum is shown in chart.

XAUUSD Short AnalysisAnticipating Shorts on XAUUSD
Gold has already been at its major resistance point, rejecting the upper resistance point multiple times.
Looking forward for a bearish push on gold with both short and long term PoV's as described in the chart.

#ADANIPOWER – Double Top Danger Zone!📉⚡ #ADANIPOWER 🚨
ADANIPOWER has formed a monthly double top 🔝 near the 179–183 (ATH) zone and is now slipping toward its rising trendline 📉
Price is also trading inside the September monthly candle (182.70–120.00). MCB or sustained close below 120 will signal major weakness ⚠️👇
If selling continues, price may head toward 112.50–124, 92–96 , and the breakout retest supports at 83–87 .
Bulls must defend the trendline to avoid a deeper correction 🛡️🔥
Resistances: 151.20 / 179–183 (ATH)
#ADANIPOWER #PriceAction #DoubleTop #ChartPattern #InsideBar #CandlestickPattern
📌 #Disclaimer: This analysis is shared for educational purposes only. It is not a buy/sell recommendation. Please do your own research before making any trading decisions.

What coming for Nifty weekly Expiry??Today nifty clearly was supported by the 20 EMA on the daily charts while it tested its 60 minutes 200 EMA.
Though both the moving averages has given support to the index on intraday basis. Still a fall is being seen in the market as the index closed 225 points lower.
Head & Shoulder pattern formation on the charts is there which seem to take support from the neckline. If the market remains beaarish and tend to breach the lower levels a clear support is around 25700-50 levels.
While a rising wedge pattern in also there as per the technicals. RSI is showing bearish divergence and a Death cross over (20 & 50 EMA) is there on the hourly charts.
If the market tries to recover a good resistance zone in around 26040-60 levels.
A swing/positional trader can initiate an entry once the neckline is breached and retest the support levels.
Major Trend is sideways and same is the Minor trend of the index.
Bullish entry can be created around the levels, once a positive setup is there on the charts for a target up to the resistance levels.(For intraday play)
Wait for the price action near the levels before entering the trade.
No bearish trade can be initiated as there was a good for on the hourly charts and profit booking can be seen in the upcoming session.
Major Support Zone :- 25850-900
Resistance levels :- 26060, 26200
Patience is the key for a good trading setup to function. Plan as per the plan.

NIFTY FMCG ON 1W TFBulls are trying very hard to sustain the Nifty FMCG above 0.50 fibo level.
We have recently seen Bullish engulfing and hammers at 0.50 fibo level. Let's see how it moves further. My view is bullish.
Note: This post is for education purpose only.

Nifty 50 Price Structure Analysis [08/12/2025: Monday]Top-Down Nifty 50 Price Structure Analysis for 08th December 2025. The day is Monday.
(1) Monthly Time Frame:
Red paper umbrella candle. The body is smaller compared to the lower wick. So far, it is an indecisive market. The main trend is bullish, but the present scenario is indecisive. The major support zone is at 26100 and 26000. Major resistance is at 26300. The view is bullish to indecision.
(2) Weekly Time Frame:
Red paper umbrella candle. The body is smaller compared to the lower wick. There is no upper wick. Thus, there is good buyer participation. Looking at the combination of 3 candles, buyers (or bulls) are getting stronger. The lower wicks are getting longer every week. For the past 3 weeks, the price has been taking very good support at the zone (25850 - 25900). In the present scenario, levels 26100 and 26000 are major support zones. Major resistance is at 26300. Considering, past 8 weeks, the price is in the structure of higher highs and lower lows. Thus, bullishness is intact. Take no bearish trade until the price starts to trade below the zone of 26100 - 26050. Presently, the view is bullish to indecision. If the price keeps sustaining above the level 26200, then probably, the previous all-time high (ATH) will be breached.
(3) Daily Time Frame:
The past 2 days are green days. On 05th December price gave a 200-point bullish rally. However, price is still in the range of the bullish marubozu formed on 26th November (Wednesday). Price needs a stable movement above the level 26200. Presently, 3 levels have emerged as a strong support zone - 26100, 26050, and 26000. So, take no short position unless the price starts to trade below 26000. Any downward move should be doubted. The view is bullish to indecision as the previous ATH and level 26300 are very close.
(4) 30-Minute Time Frame:
The complex correction since 17th October 2025 continues. Presently, price is trying to trade in the upper zone of the rising channel. The direction of the complex correction is bullish but with high volatility and indecisive moves. A strong support zone is formed at the levels 26100 - 26000. A minor resistance is at 26200. Major resistance is at 26300 and the previous ATH (26277.35). Every down move should be doubted. Institutional bias is bullish. The view is bullish.
Event:
No expiries on Monday. No high-impact event. However, the U.S. Fed Interest Rate Decision is on 11th December (Thursday) - a high-impact event in the next week.
Bullish Scenario Set-Up:
(i) Price sustains above the opening price.
(ii) Price sustains above the level 26200 and shows promise of reaching levels 26277.35 (ATH) and level 26300.
Bearish Scenario Set-Up:
(i) Price sustains below the opening price.
(ii) Price starts to sustain below the level 26050 and starts to form a lower lows, lower highs structure below 26000.
No Trading Zone (NTZ): 26200 - 26100.
Expectations (Hypothesis and Insights from Trading Plan):
(i) Take bullish trades only. Price must start to trade above the level 26200.
(ii) Every down move should be doubted. Levels 26100 - 26050 are very strong support.
(iii) Be skeptical of executing trades in the first half of Monday, as level 26277.35 (previous ATH) and level 26300 are close. Also, in case of a gap up or a gap down, be very cautious. A clear price structure is needed for trend clarity.
(iv) Trade only when bullish/ bearish conditions are fulfilled. Otherwise, don't trade. Protect your resources.
NOTE:
"Mark your points. Trade your points. Price is God. Anything can happen. Therefore, trade what you see, not what you believe."
Happy Trading!

Wave (5) Meets a Hanging Man: Trend Fatigue in Bank NiftyBank Nifty has printed a valid Hanging Man at the Wave (5) zone, right inside the 1–1.618 Fibonacci cluster. RSI is flattening near overbought, and the RBI’s Friday rate cut failed to extend the rally. This points to visible trend fatigue.
A reversal, however, will only be confirmed if next week closes below the Hanging Man’s real body.
Disclaimer: This analysis is for educational purposes only and does not constitute investment advice. Please do your own research (DYOR).

Rejection. Divergence. Confirmation? A Short Setup EmergingFeature, Detail
Price Signal: Shooting Star at the peak, showing clear rejection of higher prices and buyer exhaustion
Momentum Signal: Bearish RSI divergence — price made a higher high while RSI formed a lower peak
Consensus: Reversal candle + momentum divergence creates a high-probability pullback setup
Current Price: Trading near the 52-week high of ₹2,011, making the rejection zone psychologically significant
Bias: Short-term correction favored
Action: Enter only after confirmation — a daily close below the Shooting Star’s body
Invalidation (SL): A close above the Shooting Star high negates the bearish setup
Disclaimer: Educational only. DYOR.

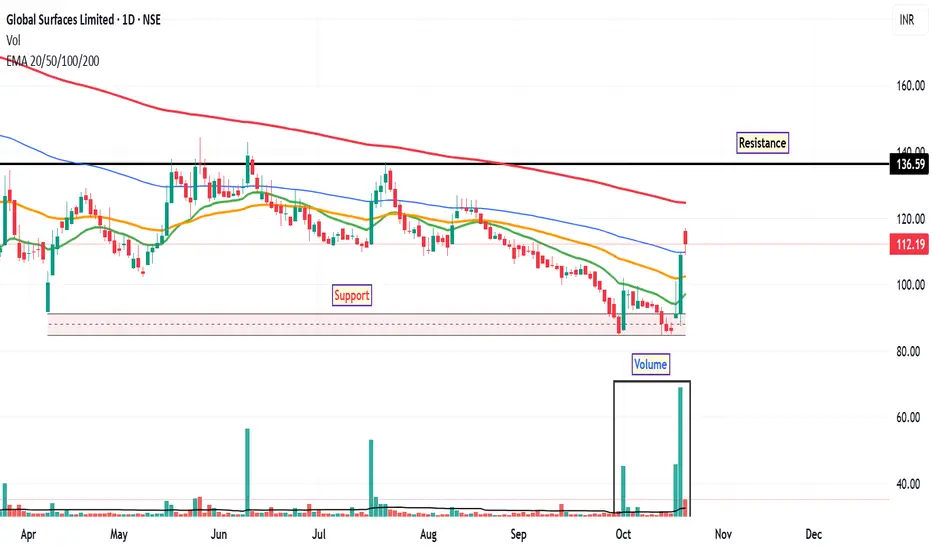
GSLSU: Trend Reversal Signals The stock of GSLSU has been in a sustained downtrend since May, revisiting its discount zone multiple times. However, recent price action suggests a possible shift in sentiment. On Friday, October 17, the daily chart printed an inverted hammer candlestick, a pattern often interpreted by technical analysts as a potential bullish reversal signal—especially when supported by volume and other indicators.
The inverted hammer on the daily timeframe may indicate buying interest at lower levels. This pattern gains significance when it appears after a prolonged downtrend and is accompanied by increased volume. The bullish signal is further supported by a rise in trading volume and a daily close above the 20-day, 50-day, and 100-day EMAs, suggesting short-term strength and potential trend reversal.
In the most recent trading session, the stock found support at the 100-day EMA and rebounded, reinforcing the validity of this level as a short-term base. The RSI has moved above 65, indicating increasing bullish momentum. This level is often seen as a sign of strengthening trend, though not yet in overbought territory.
If the stock sustains its upward movement, the next potential resistance level may be around ₹136 , based on previous price action. The discount zone near ₹84 may serve as a key support level. Traders often monitor such zones for invalidation of bullish setups or potential re-entry points.
Disclaimer: This analysis is intended for educational and informational purposes only. It does not constitute investment advice or a recommendation to buy, sell, or hold any financial instrument. Market participants should conduct their own research and consult with a licensed financial advisor before making any investment decisions.
RELIANCE AT A CRITICAL ZONEBeautiful Chart of Reliance in weekly timeframe and is at an interesting level from where it can go either side.
At weekly levels symmetrical formation of a rally for 3 weeks followed by a bearish engulfing and then crash.
Breakout
If Reliance breaks the high of 1580 the trend will be bullish and 2085 is in horizon in couple of months
Breakdown
If reliance breaks the level of 1535 and further breaks 1485 then it will go down again to the 1120 levels.
Time is of essence.

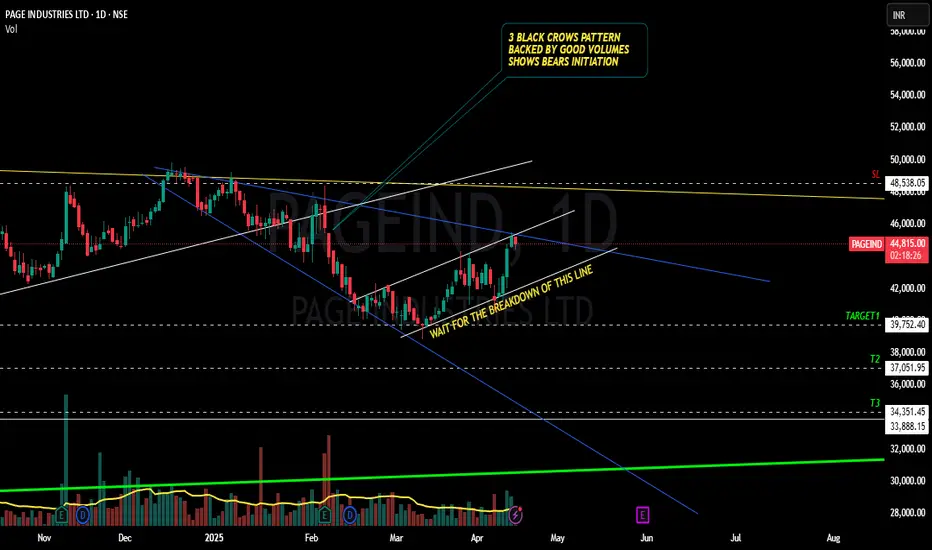
PAGEIND - BEARS READY TO TEAR JOCKEY DOWN TO 20% FALL???YES!!!!! Chart patterns made me think of the above titled opinion.
REASONS FOR MY IDEA
1.MONTHLY CANDLE BREAKDOWN WITH GOOD VOLUME
2. OCT 2022 Highs not tested even during 2024 bullish phase shows weakness
3. Weekly candle too shows a voluminous breakdown as shown below
4. 3 BLACK CROWS pattern in the daily time frame recently adds to the woes
5. I will mostly wait for the white trendline break for the entry.(though it is now at the resistance trendline , recent bullish candles may delay the down rally)
6. Given the sl , target are extreme levels.....will update after the white line breakdown.
LET THE MARKET DECIDE.....WE WILL WAIT AND WATCH!!!!!
This is just my opinion.....not a tip nor advice.
THANK YOU!!!!!!