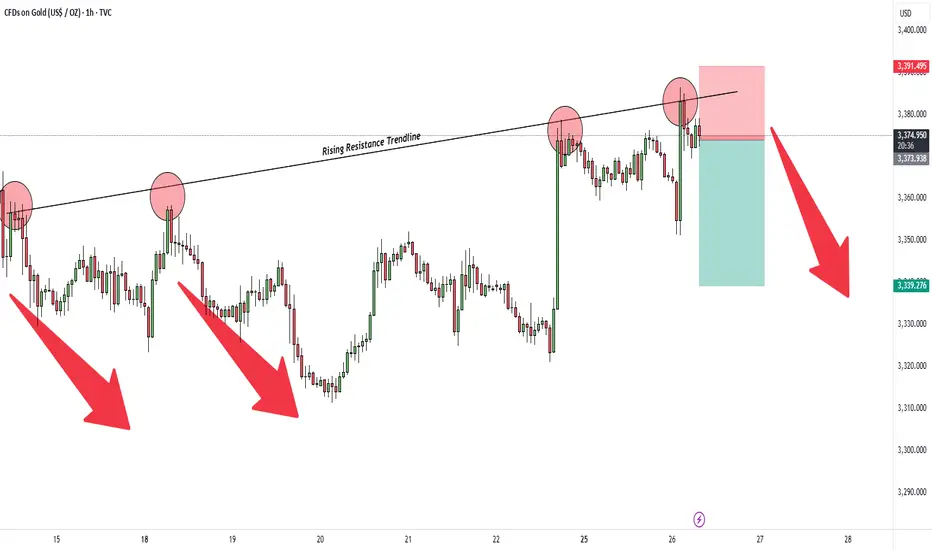
Gold – Rejection from Trendline ResistanceHello everyone, Gold faced rejection from the ascending trendline resistance and formed a bearish setup. A short position has been taken with stop above the recent swing high and target near 3339 support zone.
Key Points:
Trendline Resistance: Price failed to sustain above the trendline.
Risk Management: Stop placed above 3391 to protect against false breakouts.
Target Zone: First support lies near 3339 where price may react.
Disclaimer: This analysis is for educational purposes only, not financial advice.
Cfds
SPX SP500 Trade Idea Setup - SPX looks over extended to me
- All US Indices look over extended to me but you can't short it anyways
- The whole playout here is based on catching retracements and not shorting anything
- IMO trade less unless you find an A+ setup

US 30 Trade Idea Setup - Dow has been moving impulsively for the past months
- The important outlook here is that the trend is slowing down and one rebalancing is needed
- You can keep longing as long as Dow doesn't invalidate 38,900 post that you still need a confirmation
- Calling the TOP out here is stupidity
- follow the trend and long whenever you see deep retracements

US 100 Nasdaq 100- Nasdaq is currently in a zone where we can see more impulsive spikes and drawdowns
- Us100 can show us some retracement anytime in a negative catalyst
- Wait for a retracement and do not execute shorts at this moment.

US 30/ Dow Jones 1D Trade Setup - The US Index is currently trading on its All-Time High
- From a Trade Perspective, I would like to wait and watch out what the FED delivers in the FOMC statement
- The rate-cut bets are now fading away and making it look tough for traders that the FED will cut rates
- Inflation is currently sitting at 3.4%
- Cutting rates fundamentally doesn't look feasible as long as the FED doesn't achieve its target of 2%. We can see a mid-cool-off when FED achieves 2.5% once cut and maybe aggressive hikes post that along with some pause
- From a Trading Perspective, I would like to wait for a liquidity grab and then execute orders depending on the price action
- The inefficiencies currently look a little untapped, once the price taps it, I will start looking for longs
- DOL on this still needs to be tapped before you look for long
- Shorts on a scalp basis are preferable but don't swing short in a bull market

WTI: Bears Are Outnumbering BullsWTI has been forming a flat A-B-C correction.
According to Elliott's wave projection, the oil future looks bearish.
Oil Future has accomplished wave A at 193.17 , and sub-wave (c) of wave ((B)) is creating an ending diagonal.
The ending diagonal is a formation of five waves. WTI is to occur in wave 5 of an ending diagonal.
If you are a safe trader, you can trade after the breakdown of wave 4 at 110 . Your target will be 105-99-93 .
Aggressive traders can sell when the price falls below 119 .
If it goes above the parallel channel, wait for levels to appear.
Thank you
@Money_Dictators

Silver Daily Gann Chart Pointing HigherCurrently, silver has jumped back into the uptrend area. It has also broken the parallel channel in the last trading session. But, the buy is not confirmed yet. The uptrend can be resume if it remains above 0.618 of retracement level and 3/1 & 8/1.
If that happens, then you can buy for the targets of 63900 - 65100 - 65960 - 68454.
What happens if it's fake-out? That's a straightforward scenario on the above chart. MCX silver futures will come under the control of sellers in the downtrend area. It will fall nonstop for the targets of 59960 - 59400 - 58600 - 55765.

Maple Tree Log Tr breaking ResistanceMaple Tree Log Tr breaking Resistance level of 1.30.
Stock made low around 1.18 and shift upwards after forming Doji around this level.
Stock is rising in uptrend with strong momentum.
Momentum indicator like RSI also rising current value pointing to 65.0 level.
Stock can rise till 1.35-1.38 with support comes around 1.23-1.24

Genting Sing Stock (G13) in uptrendGenting Sing (G13) stock tested rising trend line around 0.960 level.
Stock can rise above 1.05.
As per moving averages trading sideways
can be also one indicator that stock going to trade side ways quite some time but give upside breakout after recent higher high formation.

SIA Singapore Airlines can be a range playSingapore Airlines stock will trade in range of 9.50 to 9.90. if stock break this trading range either on upside or downside.
As to look sector as whole airlines stocks globally have headwinds higher fuel prices.Recent fall in oil prices be good for these stocks.
Positive only above break of $10.Below 9.50 slide to 9.30-9.00
