Bullish USDJPY (Long Position)Time Frame: 1-Hour
Trade Direction: Bullish
Entry Price: 148.629
Target Price: 149.262
Stop Loss: 148.108
Risk-Reward Ratio: ~2.3:1
1. Chart Analysis:
The price action has been respecting a strong ascending trendline (blue line) indicating a consistent upward momentum over the past several hours.
Price has recently bounced off the trendline and is approaching a resistance zone near 148.6, showing potential for a continuation upward towards 149.262.
Support Level: The price has previously found support at the 148.1 level, confirming a solid demand zone in the market.
2. Indicator Support:
Exponential Moving Averages (EMA): The price is currently trading above both the 9-period and 20-period EMAs, which is a bullish sign indicating upward momentum. The EMAs are also in alignment, further supporting the bullish case.
Volume Trend: There is an increase in volume accompanying the recent bullish price action, confirming strong buying interest and supporting the idea of a potential breakout towards the target.
3. Risk Management:
The stop loss is placed just below the recent low at 148.108 to provide a reasonable buffer against any price retracement, keeping the trade within an acceptable risk range.
The target is set at 149.262, just below the key resistance level, ensuring that we capture the full potential of the current trend while minimizing the risk.
4. Trade Setup Logic:
This setup is based on the continuation of the uptrend, with strong support from both the price action and indicators. The price action has successfully bounced from the trendline, confirming a potential continuation move towards higher prices.
The target lies near a resistance zone, making it a logical point for potential profit-taking.
5. Conclusion:
The overall market structure and indicators are aligned in favor of a bullish position, providing a high-probability setup. With a clear risk-reward ratio, this trade offers a favorable risk profile and a solid chance for profit.
Chartanalysis

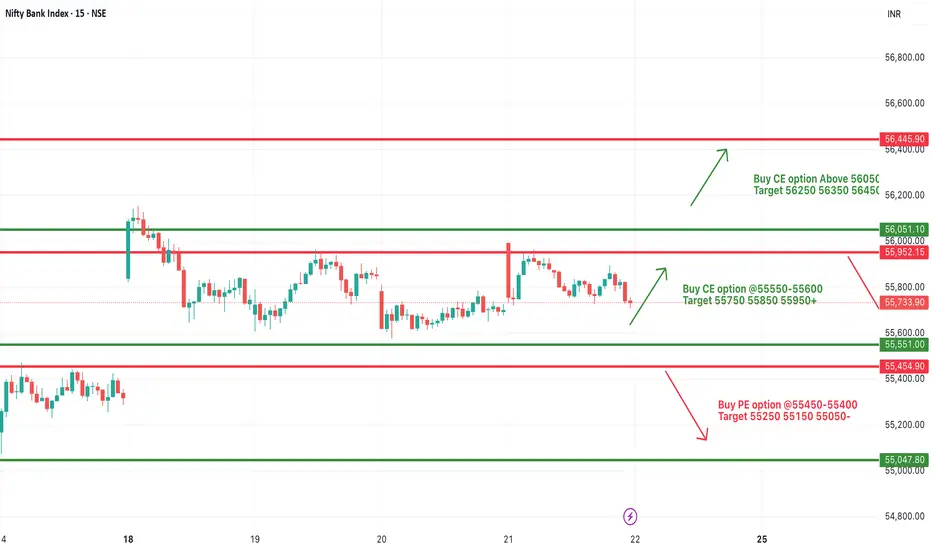
[INTRADAY] #BANKNIFTY PE & CE Levels(22/08/2025)Bank Nifty is expected to open with a gap-down start, continuing its consolidation within the same range it has been stuck in for the last few sessions. The zone between 55,550–56,000 remains a decisive band, and price action here will dictate the intraday trend.
On the upside, a move above 55,550–55,600 can trigger buying momentum, with potential targets at 55,750, 55,850, and 55,950+. Sustaining above 56,050 will open the way for a bigger rally toward 56,250–56,450+.
On the downside, if Bank Nifty slips below 55,450–55,400, fresh selling pressure may emerge with immediate targets at 55,250, 55,150, and 55,050.
Since the index has been consolidating in a narrow range for the last couple of days, a breakout from either side (above 56,000 or below 55,400) could provide the next strong directional move.
INFY Bullish Setup** IF you like my observation, please boost and follow for more content."
Ticker: INFY
Time Frame: 1-Hour
Trade Type: Bullish
Entry Point: 1486.20
Target Price (TP): 1589.15
Stop Loss (SL): 1417.45
Risk-to-Reward Ratio (RRR): 1:1.5
Trade Setup and Rationale:
Market Context:
INFY has been showing signs of recovery, breaking out of a corrective phase. The price is currently positioned for a potential uptrend, supported by a significant bullish pattern forming on the chart.
Entry Point (1486.20):
The price has recently tested a support zone and is now showing signs of a strong reversal. The entry point is set just above this level, ensuring a confirmation of the bullish trend before committing to the trade.
Target Price (1589.15):
The target is set at a key resistance level where price is expected to face potential selling pressure. This level aligns with previous highs and is a reasonable place to lock in profits while riding the trend.
Stop Loss (1417.45):
The stop loss is placed just below the recent swing low, ensuring that the trade has a controlled risk. This placement minimizes the risk of getting stopped out in case of minor fluctuations while keeping the risk-to-reward ratio favorable.
Trade Logic:
The trade is supported by a bullish breakout pattern with increasing volume. After a period of consolidation, price action is showing signs of upward momentum, making this a high-probability trade setup.
The risk-to-reward ratio of 1:1.5 offers a balanced risk for the potential reward, providing a good trading opportunity with a well-placed stop loss.
Volume Confirmation:
Volume is showing a steady increase as the price starts moving upward, indicating that market participants are supporting the bullish move.
Trend Confirmation:
The trend is confirmed by the price breaking above previous resistance, and the bullish setup aligns with the market structure.

ELGIEQUIP (ELGI EQUIPMENTS)ELGIEUIP has re-tested the breakout and looking good, moving above 20-50ema.
Keep an eye on it.
✅ If you like my analysis, please follow me as a token of appreciation :)
in.tradingview.com/u/SatpalS/
📌 For learning and educational purposes only, not a recommendation. Please consult your financial advisor before investing.

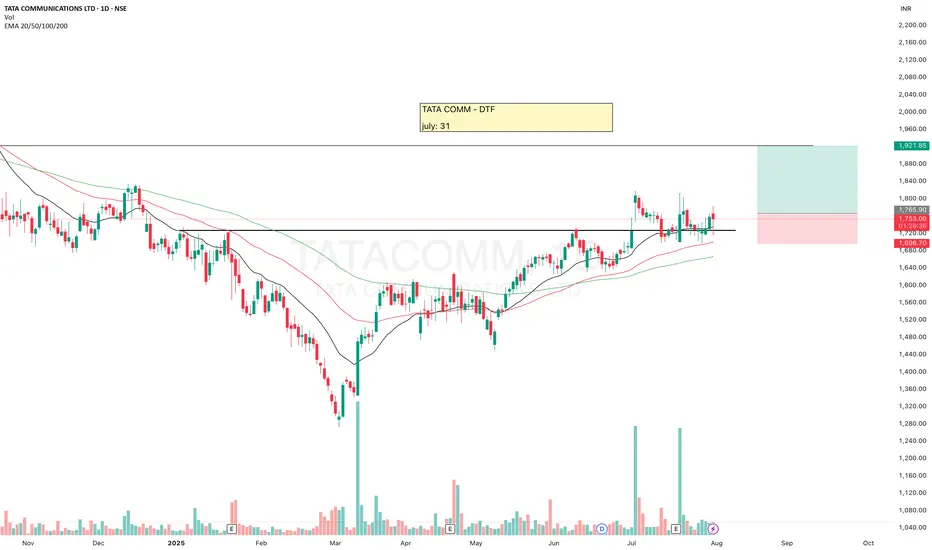
TATACOMMTATACOMM gave breakout after making HH-HL formation
Re-tested and now there is probability of an upside move. SL is must.
✅ If you like my analysis, please follow me here as a token of appreciation :)
in.tradingview.com/u/SatpalS/
📌 For learning and educational purposes only, not a recommendation. Please consult your financial advisor before investing.
POLICYBZR (PB FINTECH LTD.)POLICYBZR gave BO of an old resistance, then re-tested and now seems to be getting ready.
It made VCP pattern. Making Hammer candles, decent volume, above 20-50ema, crossing the resistance again, there is probability of an upside move.
Keep eyes on it 👀
If you like my analysis, please follow me as a token of appreciation :)
in.tradingview.com/u/SatpalS/
For learning and educational purposes only, not trading advice. Please consult your financial advisor before investing.

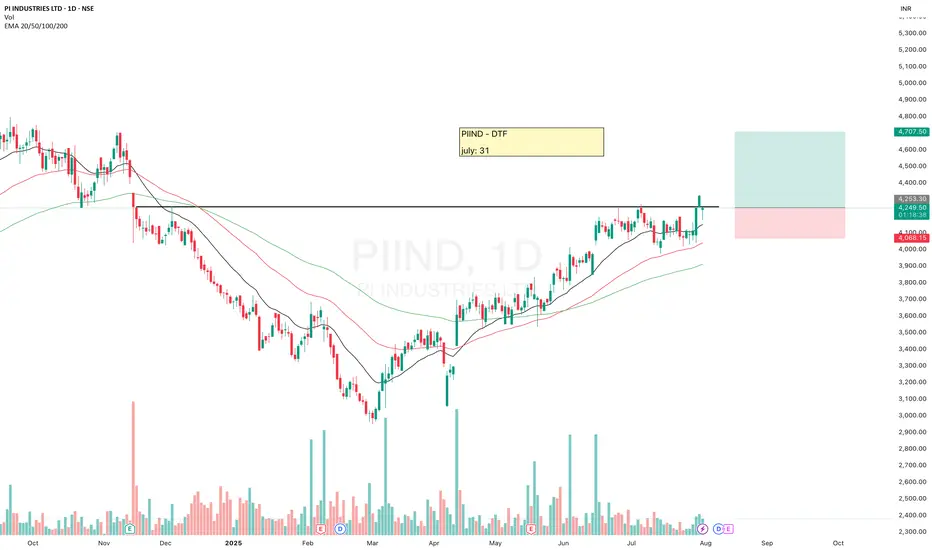
PIINDPIIND is looking good.
It has made HH-HL formation, moving above 20ema and breakout from here may give a good upside move. Keep eyes on it.
✅ If you like my analysis, please follow me here as a token of appreciation :)
in.tradingview.com/u/SatpalS/
📌 For learning and educational purposes only, not a recommendation. Please consult your financial advisor before investing.
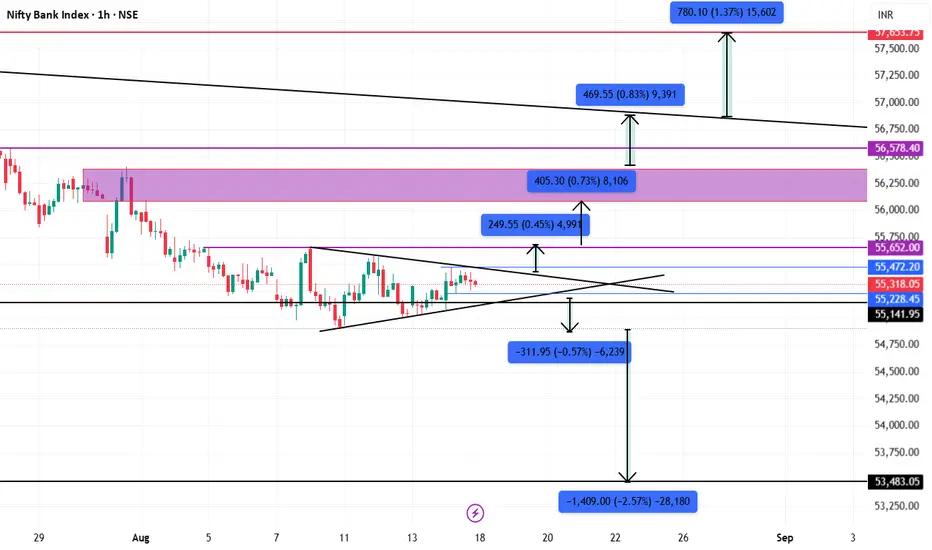
banknifty chart analysis newbanknifty pure price action chart analysis. you can see how
will banknifty move....see chart you can understand.
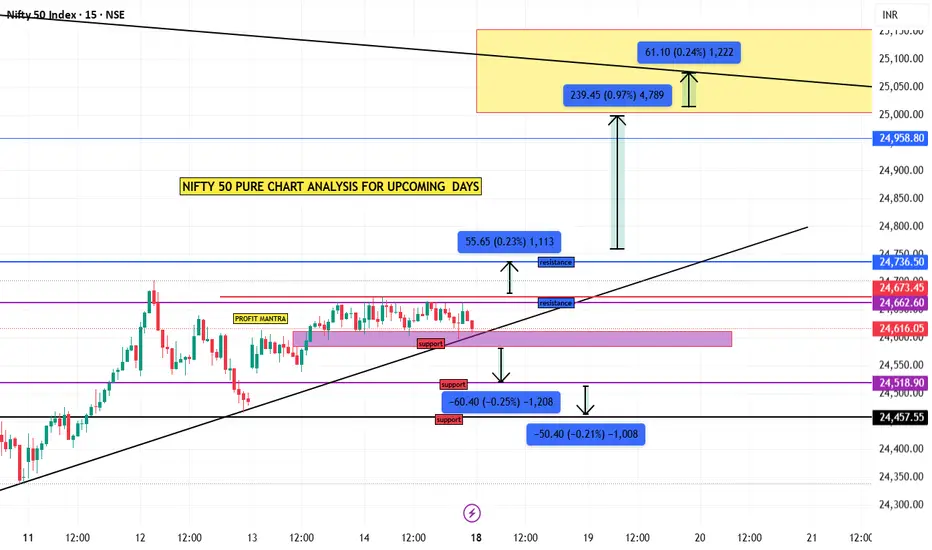
nifty 50 simple analysispure price action chart analysis. here nifty 50 behave sideways
in 15 minute time frame, see chart you can understand.
Ola Electric - stock analysis: updateUpdated : In the last analysis,
The support of 39 still working.
As it stays intact we may expect following, combining technical chart view + some key fundamental investing ratios as well-
Technical Analysis (Weekly Chart)
Current Price: ₹41.31 (+2.00%)
Trend: Stock has been in a steep downtrend since listing (from near ₹120 levels). Recently showing signs of base formation around ₹38-₹42.
Chart Pattern:
Price moving in a falling wedge / downtrend channel.
Multiple attempts to break out above ₹46-₹47 resistance.
Long-term bottoming signs visible.
Key Support Levels
₹39 (major base support)
₹35 (breakdown risk below this)
₹30 (worst-case scenario)
Key Resistance Levels
₹46.3 (immediate resistance)
₹54.2 (supply zone)
₹68.3 (medium-term breakout target)
₹106.9 (long-term resistance if strong rally sustains)
Trading View:
If price holds above ₹39-41, it can attempt a bounce toward ₹54 to ₹68.
Sustained close above ₹68 may open rally toward ₹100+.
If it breaks below ₹39, risk of further fall toward ₹35-30.
Fundamental Snapshot (as per recent financials of Ola Electric)
Note: Ola Electric is a newly listed company (IPO in 2024), so fundamentals are still stabilizing.
Market Cap: ₹36,000 Cr (mid-cap, growth-oriented).
Revenue (FY24): ₹5,000 Cr (fast-growing, >35% YoY growth).
Profitability: Loss-making (negative net profit margin).
P/E Ratio: N/A (since company is loss-making).
P/B Ratio: 6-7 (high valuation compared to traditional auto companies).
Debt-to-Equity: Moderate, backed by fundraises but needs close watch.
EV Industry Growth: Strong demand push by Govt incentives (FAME II, EV subsidies).
Risk Factors:
Still in cash burn mode, uncertain path to profitability.
Competition from Tata Motors EV, TVS iQube, Ather Energy.
Heavy dependency on Govt policy & subsidies.
Conclusion:
Short-Term (Technical): Stock is near bottom support, bounce possible toward ₹54-₹68.
Medium-Term (Investment): Needs consistent revenue growth + reduction in losses for rerating.
Long-Term (5-7 years): Ola Electric could be a disruptor in EV space, but valuation & profitability risk remains high.
Disclaimer:
This analysis is for educational purposes only and not financial advice. Stock markets are risky, especially with new-age loss-making companies like Ola Electric. Please do your own research or consult a SEBI-registered financial advisor before investing.

Indian Bank - Long Setup, Move is ON...#INDIANB trading above Resistance of 427
Next Resistance is at 665
Support is at 299
Here are previous charts:
Chart is self explanatory. Entry, Resistances and Support are mentioned on the chart.
Disclaimer: This is for demonstration and educational purpose only. This is not buying or selling recommendations. I am not SEBI registered. Please consult your financial advisor before taking any trade.

Bullish Setup on Emcure: Previous Resistance Now SupportCurrent Price: 1453
Target Price: 1600
Stoploss: 1385.40
The stock is showing a bullish pattern after breaking above a key daily resistance level, which has now turned into support. Additionally, the 20-day EMA is acting as a dynamic support, helping to sustain the current uptrend. These technical signals indicate strong buying interest around the 1450 level with Reward to risk ratio around 2:1

Gold Plan 12/08 – Captain VincentGold Plan 12/08 – Captain Vincent ⚓
Background:
After sliding from the Storm Breaker 🌊, Gold has broken below the 3358 zone and successfully retested it. The ship is now heading straight towards the Buy Scalp – Quick Boarding 🚤 dock.
Today’s Plan: Only buy when price reaches the pre-defined support zones — no chasing in open waters.
Zone 1 – Quick Boarding 🚤 (Buy Scalp)
Entry: 3,333 – 3,331
SL: 3,327
TP: 3,336 → 3,339 → 3,342 → 3,345 → 3,348 → 33xx
Note: Fast in & out. Take partial profits at each TP hit.
Zone 2 – Golden Harbor 🏝️ (Main Buy Zone)
Entry: 3,311 – 3,309
SL: 3,305
TP: 3,315 → 3,319 → 3,323 → 3,327 → 3,331 → 33xx
Note: Main accumulation zone. Hold longer if buying momentum stays strong.
Today’s Scenarios:
If price hits Quick Boarding → Wait for a reversal signal (pin bar, engulfing) on M15/H1 before entering.
If price dips to Golden Harbor → Observe the bounce strength; enter only on clear confirmation.
If neither zone is touched → Stay on the shore; wait for the next voyage.
Captain’s Note:
“The Gold ship has left the 3358 waters, turning its bow towards Quick Boarding 🚤. If docking is smooth, the crew will sail out swiftly to the open seas. Golden Harbor 🏝️ remains the main refuge if stronger waves push deeper.”

LLOYDSME LLOYDSME is looking good.
It has re-tested the BO and now bouncing from the support zone, above 20ema
✅ If you like my analysis, please follow me as a token of appreciation :)
in.tradingview.com/u/SatpalS/
📌 For learning and educational purposes only, not a recommendation. Please consult your financial advisor before investing.

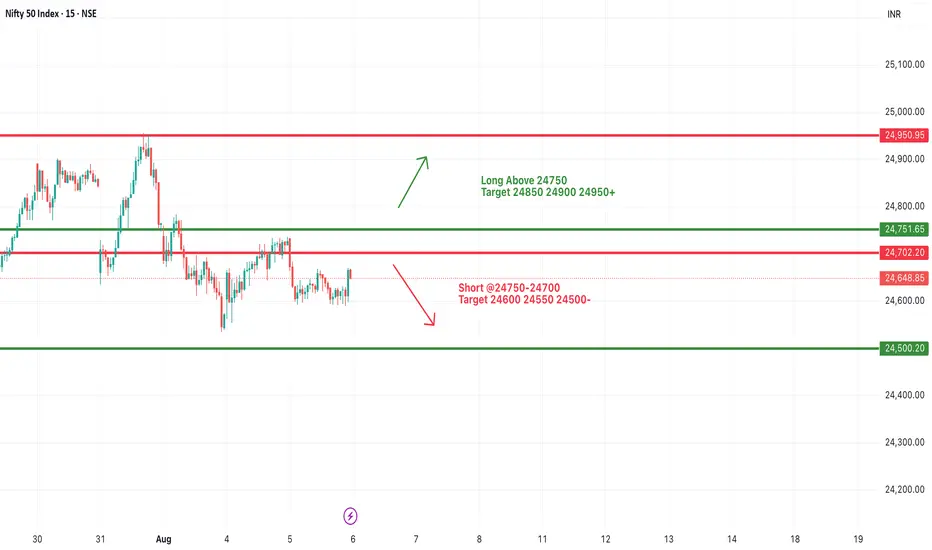
#NIFTY Intraday Support and Resistance Levels - 06/08/2025Nifty is expected to open slightly gap up near the 24,650 level, continuing to consolidate within a defined range. The price action has been forming a tight structure, making directional breakouts crucial for the next move.
On the upside, a long trade can be considered if Nifty sustains above 24,750–24,800, which is the immediate resistance zone. A breakout above this zone could push Nifty toward 24,850, 24,900, and 24,950+ levels intraday.
On the downside, if Nifty fails to hold the 24,750–24,700 level and starts trading below it, a short setup can be activated with potential targets of 24,600, 24,550, and 24,500-. Strong support lies near the 24,500 mark, which will be a critical zone for bulls to defend.
Godfrey Phillips India - Breakout Setup, Move is ON...#GODFRYPHLP trading above Resistance of 6771
Next Resistance is at 9804
Support is at 4339
Here are previous charts:
Chart is self explanatory. Levels of breakout, possible up-moves (where stock may find resistances) and support (close below which, setup will be invalidated) are clearly defined.
Disclaimer: This is for demonstration and educational purpose only. This is not buying or selling recommendations. I am not SEBI registered. Please consult your financial advisor before taking any trade.

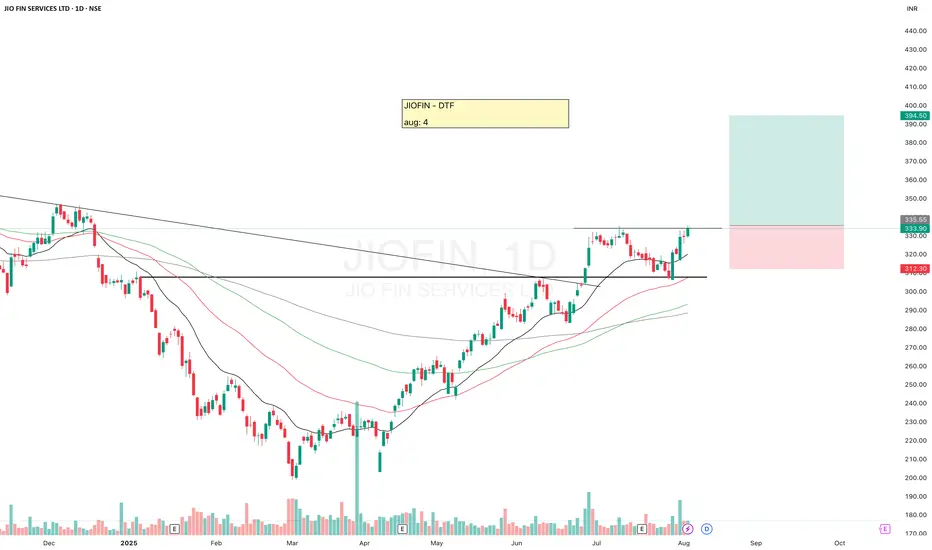
JIOFINJIOFIN is looking good, breakout from here may give a good upside move.
EMAs are aligned, keep eyes on it.
✅ If you like my analysis, please follow me here as a token of appreciation :)
in.tradingview.com/u/SatpalS/
📌 For learning and educational purposes only, not a recommendation. Please consult your financial advisor before investing.
NIFTY FMCGNifty FMCG sector looks strong, might give an upside move in coming days. Add it to your watchlist.
Which FMCG stock are you tracking? I’m eyeing VBL .
Let me know if you want me to analyse any specific stock?
✅ If you like my analysis, please follow me here as a token of appreciation :)
in.tradingview.com/u/SatpalS/
📌 For learning and educational purposes only, not a recommendation. Please consult your financial advisor before investing.

Gold Trading Strategy XAUUSD July 31, 2025Yesterday's trading session, after breaking the rising price channel in the 3318 - 3320 area, the gold price fell sharply to the 3269 area.
Basic news: US Treasury yields fell and the weak US labor market report could boost investor demand. Data released by the US Department of Labor on Tuesday showed that the number of new jobs fell in June after 2 consecutive months of increase. Today, the Federal Reserve will announce a new interest rate decision.
Technical analysis: The rising price channel in the H1 frame was broken, and the gold price immediately fell sharply. Currently, the downtrend of gold is still maintained. The MA lines are still resistance for gold prices.
Important price zones today: 3300 - 3305, 330 - 3325 and 3267 - 3272.
Today's trading trend: SELL.
Recommended orders:
Plan 1: SELL XAUUSD zone 3303 - 3305
SL 3308
TP 3300 - 3290 - 3280 - 3270.
Plan 2: SELL XAUUSD zone 3323 - 3325
SL 3328
TP 3320 - 3310 - 3290 - 3280.
Plan 3: BUY XAUUSD zone 3267 - 3269
SL 3264
TP 3272 - 3282 - 3292 - 3302 (small volume).
Wish you a safe, favorable and profitable trading day.🌟🌟🌟🌟🌟

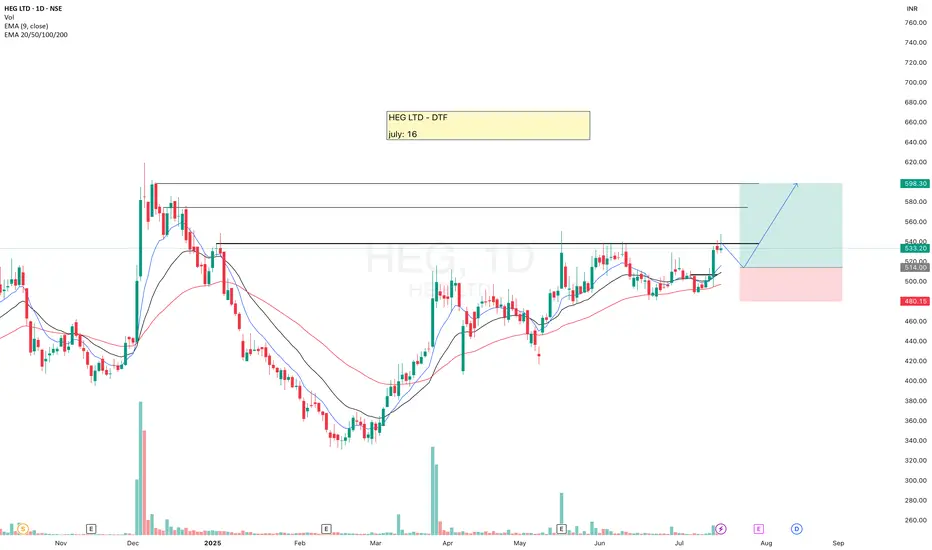
HEGHEG is looking good, moving above 20ema, but I am looking for small retracement for the Entry. In case it starts consolidating at CMP then we'll change our plan accordingly.
Trading is a game of probabilities, keep your ego aside and flow with the market.
✅ If you like my analysis, please follow me here as a token of appreciation :)
in.tradingview.com/u/SatpalS/
📌 For learning and educational purposes only, not a recommendation. Please consult your financial advisor before investing.
Matrimony-A weekly breakout for ATH target is done!Matrimony has finally given weekly closing above its weekly supply zone of 730-750.
Stock can fly if it manages to sustain above this zone.
ATH target can be expected. Not a recommendation.

Cartrade-A risky positional trade for ATH targets!Cartrade has given outstanding Q4 2024 results and bullishness in the stock is indicator of same.
However, these stocks come with good amount of risk with bigger rewards.
Stock has formed beautiful cup & handle pattern and is about to break it.
Once 1000 is crossed, we can see ATH levels soon. I had seen similar breakout in PBFintech (Policybazaar).
If you believe in new age startups, this stock is technically looking bullish.

Lauruslabs-It can fly towards ATH again!Lauruslabs has given a good breakout of trendline and horizontal resistance with volume.
Stock is looking strong for a reversal and can fly towards ATH if market supports.
Keep in watchlist.
