[INTRADAY] #BANKNIFTY PE & CE Levels(19/07/2024) Today will be gap up opening in BANKNIFTY. After opening if banknifty sustain above 52550 level then possible upside rally of 400-500 points upto 52950 level & this rally can extend another 400 points if market gives breakout 53050 level in todays session. Any Major downside only expected in case banknifty starts trading below 52450 level.
Chartanalysis

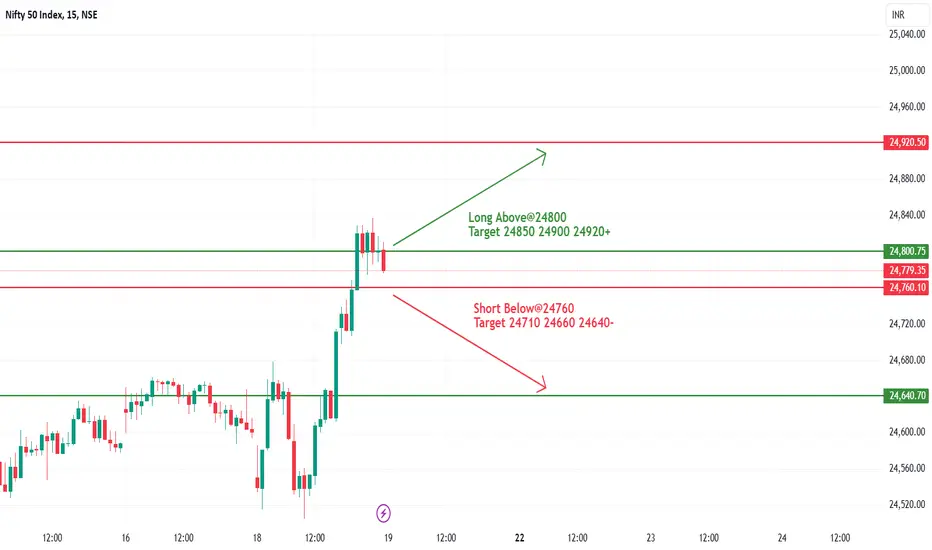
#NIFTY Intraday Support and Resistance Levels -19/07/2024Nifty will be gap up opening in today's session. After opening nifty sustain above 24800 level and then possible upside rally up to 24920 level in today's session. in case nifty trades below 24760 level then the downside target can go up to the 24640 level.
Symmetrical Triangle pattern breakout in BATAINDIABATA INDIA LTD
Key highlights: 💡⚡
✅On 1 Hour Time Frame Stock Showing Breakout of Symmetrical Triangle Pattern.
✅Strong Bullish Candlestick Form on this timeframe.
✅It can give movement up to the Breakout target of 1600+.
✅Can Go Long in this Stock by placing a stop loss below 1520-.

Monarch Networth Capital Ltd Bullish Pattern Current price 573
ABOUT :-
Monarch Networth Capital Limited is a provider of financial services in pure stock broking, primary market operations, mutual funds, insurance and financial planning. It is a strategic amalgamation of two financial service providers Monarch Group of Companies and Networth Stock Broking Ltd.
FUNDAMENTAL:-
Market Cap
₹ 1,939 Cr.
Current Price
₹ 573
High / Low
₹ 690 / 283
Stock P/E
13.3
Book Value
₹ 102
Dividend Yield
0.17 %
ROCE
51.5 %
ROE
43.1 %
Face Value
₹ 10.0
PROS:-
Company is expected to give good quarter
Company has delivered good profit growth of 58.5% CAGR over last 5 years
Company has a good return on equity (ROE) track record: 3 Years ROE 35.8%
Company's median sales growth is 30.6% of last 10 years

CAMS Cup formationlong term cup formation is completed.
Generally when a cup is formed in longer time frame, it is considered to be an up-trend and is a good opportunity to buy stocks.
Need of a handle is based on investor to investor. Some see valid volume on breakout and keep investing on dips, and some wait for proper formation of handle.
In this chart, volume is rising on resistance level. and can be a good buying opportunity for long term.
Please do like and subscribe if you like the idea.
NOTE: This is just for educational purpose only, please do enter in market at your own risk.

Symmetrical Triangle Pattern breakdown in RELIANCERELIANCE INDUSTRIES LTD
Key highlights: 💡⚡
✅On 1 Hour Time Frame Stock Showing Breakdown of Symmetrical Triangle Pattern .
✅Strong bearish Candlestick Form on this timeframe.
✅It can give movement up to the Breakdown target of 3064-.
✅Can Go short in this stock by placing a stop loss above 3196+.

Chennai Petro Big Move AheadHey Family, there is a one more stock Which is showing a great opportunity.
Key Points:-
* Forming Ascending Triangle Pattern in daily TF.
* From Feb 2024 to July 2024 its in range.
* From Feb 2024 to July 2024 Tested & Moving Resistance Many times.
* It's break resistance Zone and trying to Sustain above Resistance Zone with good volume.
* Volume Accumulation (Volume is Rising).
What is your view please comment it down and also boost the idea this help to motivate us. We are Certified. All views shared on this channel are my personal opinion and is shared for educational purpose and should not be considered advise of any nature.
Fundamental Analysis
Industry - Refineries
Variance Full Year Net Profit Variance - 22
Equity Latest Equity - 148.91
Face Value Latest Face Value - 10
Reserves Total Reserve - 8672.01
Dividend Full Year Dividend % - 550
Sales Turnover Full Year Net Sales - 66385.73
Net Profit Full Year Net Profit - 2745.07
Full Year CPS Full Year Cash Per Share - 225
Earning Per Share Full Year Earning Per Share - 184.3
Mar 1, 2024
Latest Quarter Sales - 17720.18
Book value - 592.4
Networth Full Year Return on Networth - 63.45
Price to Book value - 1.834909
Yearly PE ratio Full Year Price to Earning per share - 5.9
Full Year Price to Cash Per Share - 4.8
BSE Value in lakhs - 2737.22
NSE Value in lakhs - 27755.57

Ascending Triangle pattern breakout in NAVINFLUORNAVIN FLUORIN INTERNATIONAL LTD
Key highlights: 💡⚡
✅On 1 Hour Time Frame Stock Showing Breakout of Ascending Triangle Pattern.
✅Strong Bullish Candlestick Form on this timeframe.
✅It can give movement up to the Breakout target of 3885+.
✅Can Go Long in this Stock by placing a stop loss below 3673-.

HBLPOWER move startedHey Family, there is a one more stock Which is showing a great opportunity.
Key Points:-
* Forming Ascending Triangle Pattern in daily TF.
* From Feb 2024 to July 2024 its in range.
* From Feb 2024 to July 2024 Tested & Moving Resistance Many times.
* It's Near resistance Zone and trying to Break Resistance Zone with good volume.
* Volume Accumulation (Volume is Rising).
What is your view please comment it down and also boost the idea this help to motivate us. We are Certified. All views shared on this channel are my personal opinion and is shared for educational purpose and should not be considered advise of any nature.

APOLLOTYRE big move aheadHey Family, there is a one more stock Which is showing a great opportunity.
Key Points:-
* Forming Symmetrical Triangle Pattern & Ascending Triangle Pattern in daily TF.
* From Jan 2024 to July 2024 its in range.
* From Jan 2024 to July 2024 Tested Resistance Many times.
* It's Near resistance Zone and trying to Break Resistance Zone with good volume.
* Volume Accumulation (Volume is Rising).
What is your view please comment it down and also boost the idea this help to motivate us. We are Certified. All views shared on this channel are my personal opinion and is shared for educational purpose and should not be considered advise of any nature.

Parralel channel pattern breakout in MGLMAHANAGAR GAS LTD
Key highlights: 💡⚡
✅On 30 Min Time Frame Stock Showing Breakout of Parallel Channel Pattern.
✅Strong Bullish Candlestick Form on this timeframe.
✅It can give movement up to the Breakout target of 1780+.
✅Can Go Long in this Stock by placing a stop loss below 1711-.

AUDUSD stays on the way to 0.6850 hurdle despite downbeat ChinaAUDUSD prints mild losses while snapping a four-day winning streak and paring the previous gains from a five-week uptrend after China reported downbeat Gross Domestic Product (GDP), Industrial Production, and Retail Sales early Monday. Even so, the Aussie pair defends last week’s upside break of a four-month-old ascending resistance line, now immediate support at 0.6750. The RSI (14) line’s retreat from overbought territory suggests the quote’s additional weakness, but the bullish MACD signals can join the trend line breakout to keep buyers hopeful past 0.6750. It’s worth noting, however, that the pair’s daily closing beneath 0.6750 will direct bears toward May’s peak of 0.6714. Following that, a 61.8% Fibonacci retracement of the June-October downside, near 0.6660, will precede the 200-day Exponential Moving Average (EMA) level of 0.6605 to act as the final defense of the buyers.
On the contrary, the AUDUSD buyers keep the reins beyond 0.6750 and can aim for the 0.6800 threshold for the short term. However, a downward-sloping resistance line from June 2023, close to 0.6850, quickly followed by the late 2023 high of 0.6870, appears tough nuts to crack for the bulls. In a case where the Aussie pair remains firmer past 0.6870, the odds of witnessing a run-up beyond the mid-2023 peak of 0.6900 will be certain, which in turn highlights the 0.7000 psychological magnet for the bulls.
Overall, AUDUSD buyers can ignore the latest retreat unless the quote stays beyond 0.6750.

Rico Auto-A multi year monthly breakout!DO NOT MISS THIS BREAKOUT!
A clean volume breakout with retest done in daily TF.
Stock will fly from here.
A small consolidation can be expected which is best time to accumulate this stock
We might not see this stock at this price in coming few years again.
A good fundamental auto ancillary stock

Great Eastern Shipping Company - Breakout Setup, Move is ON...#GESHIP trading above Resistance of 1330
Next Resistance is at 1714
Support is at 1084
Here are previous charts:
Chart is self explanatory. Levels of breakout, possible up-moves (where stock may find resistances) and support (close below which, setup will be invalidated) are clearly defined.
Disclaimer: This is for demonstration and educational purpose only. This is not buying or selling recommendations. I am not SEBI registered. Please consult your financial advisor before taking any trade.

Ge Power India Limited - Breakout Setup, Move is ON...#GEPIL trading above Resistance of 571
Next Resistance is at 842
Support is at 321
Here are previous charts:
Chart is self explanatory. Levels of breakout, possible up-moves (where stock may find resistances) and support (close below which, setup will be invalidated) are clearly defined.
Disclaimer: This is for demonstration and educational purpose only. This is not buying or selling recommendations. I am not SEBI registered. Please consult your financial advisor before taking any trade.
GLong

Railtel Corporation of India Ltd - Breakout Setup, Move is ON...#RAILTEL trading above Resistance of 531
Next Resistance is at 768
Support is at 411
Here are previous charts:
Chart is self explanatory. Levels of breakout, possible up-moves (where stock may find resistances) and support (close below which, setup will be invalidated) are clearly defined.
Disclaimer: This is for demonstration and educational purpose only. This is not buying or selling recommendations. I am not SEBI registered. Please consult your financial advisor before taking any trade.

Dynacons Systems & Solutions Ltd - Breakout Setup, Move is ON...#DSSL trading above Resistance of 1263
Next Resistance is at 1926
Support is at 815
Here is previous chart:
Chart is self explanatory. Levels of breakout, possible up-moves (where stock may find resistances) and support (close below which, setup will be invalidated) are clearly defined.
Disclaimer: This is for demonstration and educational purpose only. This is not buying or selling recommendations. I am not SEBI registered. Please consult your financial advisor before taking any trade.

Universal Cables Limited - Breakout Setup, Move is ON...#UNIVCABLES trading above Resistance of 807
Next Resistance is at 1018
Support is at 524
Here are previous charts:
Chart is self explanatory. Levels of breakout, possible up-moves (where stock may find resistances) and support (close below which, setup will be invalidated) are clearly defined.
Disclaimer: This is for demonstration and educational purpose only. This is not buying or selling recommendations. I am not SEBI registered. Please consult your financial advisor before taking any trade.

D Link India Limited - Breakout Setup, Move is ON...#DLINKINDIA trading above Resistance of 579
Next Resistance is at 782
Support is at 377
Here are previous charts:
Chart is self explanatory. Levels of breakout, possible up-moves (where stock may find resistances) and support (close below which, setup will be invalidated) are clearly defined.
Disclaimer: This is for demonstration and educational purpose only. This is not buying or selling recommendations. I am not SEBI registered. Please consult your financial advisor before taking any trade.

SJVN - Breakout Setup, Move is ON...#SJVN trading above Resistance of 149
Next Resistance is at 203
Support is at 114
Here are previous charts:
Chart is self explanatory. Levels of breakout, possible up-moves (where stock may find resistances) and support (close below which, setup will be invalidated) are clearly defined.
Disclaimer: This is for demonstration and educational purpose only. This is not buying or selling recommendations. I am not SEBI registered. Please consult your financial advisor before taking any trade.

Talbros Automotive Components - Breakout Setup, Move is ON...#TALBROAUTO trading above Resistance of 344
Next Resistance is at 466
Support is at 258
Here are previous charts:
Chart is self explanatory. Levels of breakout, possible up-moves (where stock may find resistances) and support (close below which, setup will be invalidated) are clearly defined.
Disclaimer: This is for demonstration and educational purpose only. This is not buying or selling recommendations. I am not SEBI registered. Please consult your financial advisor before taking any trade.

Rail Vikas Nigam Ltd (RVNL) - Breakout Setup, Move is ON...#RVNL trading above Resistance of 427
Next Resistance is at 745
Support is at 372
Here are previous charts:
Chart is self explanatory. Levels of breakout, possible up-moves (where stock may find resistances) and support (close below which, setup will be invalidated) are clearly defined.
Disclaimer: This is for demonstration and educational purpose only. This is not buying or selling recommendations. I am not SEBI registered. Please consult your financial advisor before taking any trade.

Breakout in Dynacons Systems & Solutions Limited...Chart is self explanatory. Levels of breakout, possible up-moves (where stock may find resistances) and support (close below which, setup will be invalidated) are clearly defined.
Disclaimer: This is for demonstration and educational purpose only. This is not buying or selling recommendations. I am not SEBI registered. Please consult your financial advisor before taking any trade.
