Clean Trendline Respect on Weekly Chart – 500 DaysPattern Context
Price has been respecting a well-defined descending trendline on the weekly timeframe, with each rally stalling below the previous swing high and reinforcing the broader lower‑high, lower‑low sequence.
Candlestick Behavior
Showing how supply continues to respond at the same diagonal zone. This reaction visually confirms how aggressively the market has been defending the pattern’s upper boundary without implying what comes next, keeping the focus strictly on how price has behaved historically around this line.
Observational Takeaway
This chart serves as a clear example of how a simple, clean trendline can organize price behavior over multiple months and frame where participation repeatedly shifts. The emphasis here is on observing how consistently the structure has been respected and how each touch has shaped the ongoing sequence, allowing traders to study price interaction with a dominant trend rather than anticipate future outcomes.
Disclaimer
This post is for educational and informational purposes only and is not investment advice, stock tips, or a recommendation to buy or sell any security. Readers should do their own research, consider their personal risk tolerance, and consult a registered financial professional if needed before making any trading or investment decisions.
Chartanalysis
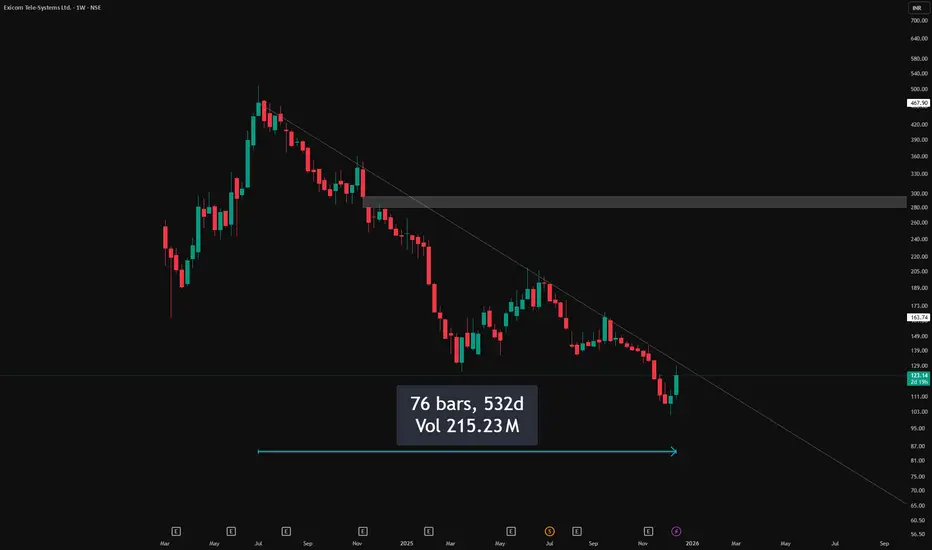
Chart Patterns Financial markets speak a language of price. Every movement on a chart represents the collective psychology of millions of participants—institutions, traders, investors, algorithms, and speculators. Chart patterns and candlestick patterns are the visual translation of this psychology. They do not predict the future with certainty, but they provide probabilistic insights into market behavior, trend continuation, reversals, and momentum shifts. Mastering them allows traders to read price action with clarity, discipline, and confidence.

ICICIBANK 1 Day Time Frame 📊 Current Live Price (approx): ₹1,364–1,365 on NSE as of this session.
🟢 Daily Pivot & Intraday Levels
(from pivot analysis)
Pivot Points (Standard / Daily):
Pivot: ~1363.8
Resistance 1 (R1): ~1371
Resistance 2 (R2): ~1377
Resistance 3 (R3): ~1385
Support Levels:
Support 1 (S1): ~1357
Support 2 (S2): ~1350
Support 3 (S3): ~1343
👉 Price staying above pivot ~1364 suggests slight short‑term strength; a break above R1 ~1371 could see extension toward ~1378–1385. Sustained breaks below S1/S2 may trigger momentum toward ~1350 or lower.

BAJAJ-AUTO 1 Month Time Frame 📊 Current Position
Last price: ~₹8,940 – ₹9,000 range.
52-week range: ₹7,089 – ₹9,490.
🔁 Near-Term Levels (1-Month Time Frame)
📈 Upside / Resistance Levels
These are prices where the stock may face selling pressure or pauses in a rally:
1. Immediate Resistance: ~₹9,100 – ₹9,150
2. Stronger Resistance: ~₹9,200 – ₹9,250
3. Positive Breakout Zone: Above ~₹9,250 – ₹9,300
Closing above these zones in sequence suggests short-term bullish momentum.
📉 Downside / Support Levels
These are key areas where the stock may find buying support if price dips:
1. Immediate Support: ~₹8,850 – ₹8,890
2. Next Support: ~₹8,750 – ₹8,780
3. Deeper Support: ~₹8,600 – ₹8,650
A breakdown below ₹8,850 could see retest of lower supports.
📊 Likely 1-Month Trading Range (Technical View)
Based on current trend and volatility, traders often expect the stock to fluctuate roughly between:
≈ ₹8,750 – ₹9,300 over a 4–6 week horizon, unless strong breakout/breakdown occurs.
This aligns with recent short-term forecast ranges from chart-based models.

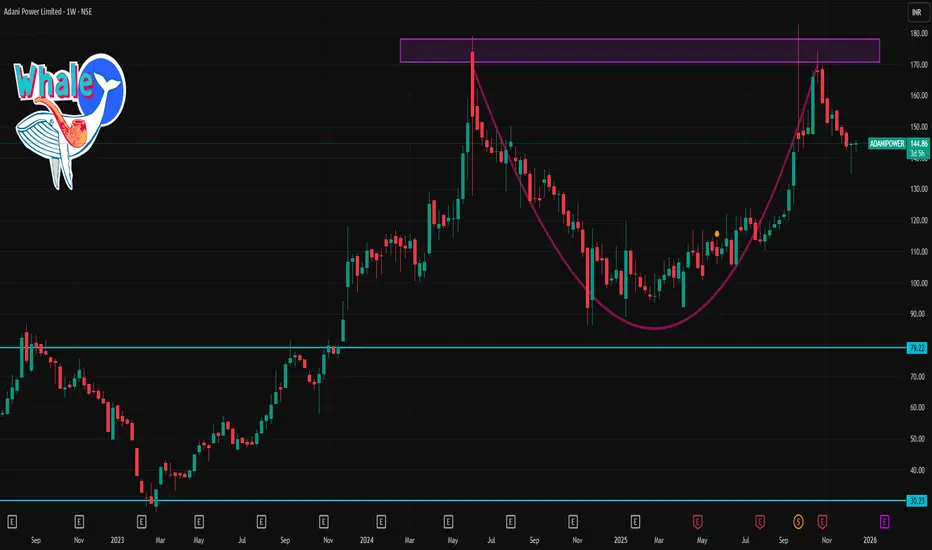
ADANIPOWER 1 Week Time Frame 📊 Current price context
• Share price is around ₹144–₹146 per share (as of latest session).
📈 Resistance Levels (Upside)
These are prices where the stock may face selling pressure or pause before further upmove:
1. ~₹147–₹149 — near short-term resistance cluster.
2. ~₹150–₹153 — pivot/fib resistance from short-term charts.
3. ~₹160–₹165/₹170 — higher target zone if bullish momentum strengthens.
➡️ If the price breaks above ₹150–₹153 with good volume, next upside could test ₹160+ over the week.
📉 Support Levels (Downside)
These are price zones that might act as demand zones if declines occur:
1. ~₹142–₹143 — immediate support from recent pivot levels.
2. ~₹140–₹139 — deeper support if weakness persists.
3. ₹135–₹134 (Lower) — secondary support seen in broader fib/pivot analysis.
➡️ A close below ₹142–₹140 could open the path toward ₹135+ on short-term weakness.
nifty 50 index chart analysis this chart for Tuesday 16th december 2025
nifty 50 index 15 minutes time frame chart analysis
note: Lines/boxes for support and resistance and you know when you take entry sl and exit.

Chart Patterns 🔸 What Are Chart Patterns?
Chart patterns are formed by price movements over time. They represent market structure and help traders anticipate breakouts, breakdowns, or reversals.
🔹 Types of Chart Patterns
1️⃣ Reversal Chart Patterns
2️⃣ Continuation Chart Patterns
3️⃣ Neutral Chart Patterns
4️⃣ Bilateral Chart Patterns
🔹 Key Components of Chart Patterns
✔ Trendlines
✔ Support and resistance
✔ Volume confirmation
✔ Breakout strength

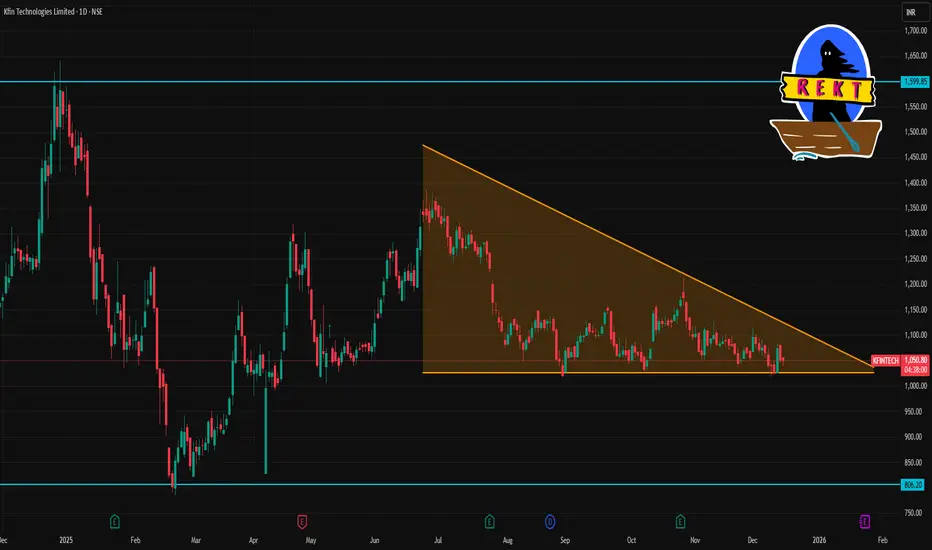
KFINTECH 1 Day Time Frame 📌 Live Price Context
Current price: ~₹1,051.7 on NSE (latest update)
Today’s range: ~₹1,045.6 (low) — ₹1,081.5 (high)
📊 Daily Pivot Support & Resistance (Accurate Today)
Level Price (₹)
R3 ₹1,109.50
R2 ₹1,095.50
R1 ₹1,073.60
Pivot ₹1,059.60
S1 ₹1,037.70
S2 ₹1,023.70
S3 ₹1,001.80
📌 Key Levels to Watch Today
🔺 Upside Resistances
Immediate resistance: ~₹1,073–₹1,095
Strong resistance area: ~₹1,095–₹1,109
🔻 Downside Supports
Near support: ~₹1,037–₹1,023
Lower support zone: ~₹1,001 and below
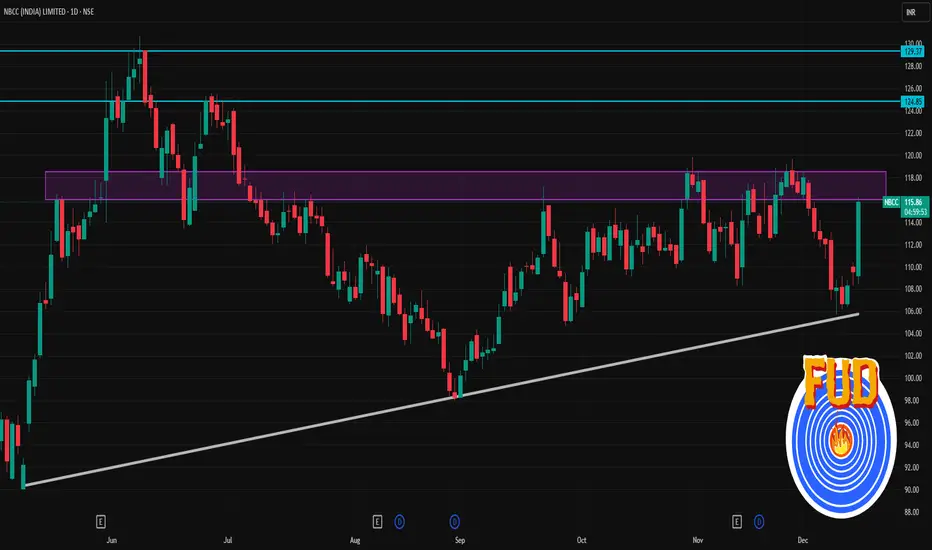
NBCC 1 Day Time Frame 📊 Daily Levels (1D Timeframe)
Current approximate price: ~₹108-110 on NSE (recent session data)
📈 Resistance Levels
R1: ~₹108.7–110.3 (intraday pivot/Bollinger & near recent highs)
R2: ~₹112.3 (upper BB)
R3: ~₹113+ & above recent short-term zone highs
Important psychological/near-term resistances to watch: ~₹112–115 area (previous consolidation zone).
📉 Support Levels
S1: ~₹106.3–106.9 (near pivot S2/Bollinger)
S2: ~₹105.3 (pivot S3 area)
S3: ~₹98–100 (broader confirmed support from recent ranges)
Below ~₹105, structure weakens toward the ~₹98 area, which has acted as support in prior daily ranges.
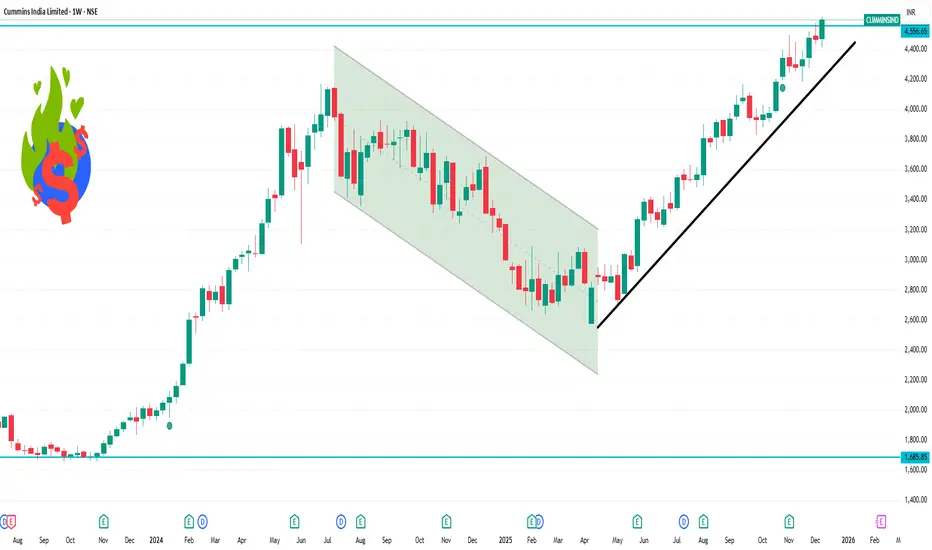
CUMMINSIND 1 Week Time Frame 📌 Current Price Snapshot
Latest price (approx): ₹4,600 on NSE close.
52-week high: ~₹4,615.
Strong upward momentum with price near highs.
📊 Weekly Support & Resistance Levels (Important)
📈 Weekly Resistance (Upside Targets)
R1: ~₹4,720 – ₹4,740 (moderate resistance near recent high zone)
R2: ~₹4,850 – ₹4,880 (extension above new 52-wk high)
📉 Weekly Support (Downside Zones)
S1: ~₹4,520 – ₹4,540 (immediate near current price support)
S2: ~₹4,430 – ₹4,450 (next key support, ~1.5–3% below current)
S3: ~₹4,300 (deeper weekly support if broader market weakens)
➡️ A break above ₹4,740 suggests continuation of current strength.
➡️ A sustained break below ₹4,520–₹4,500 increases risk of correction.
These weekly range levels are derived from pivot interpretations and recent weekly price behaviour.
Premium Chart Patterns Rules for Trading Chart Patterns
Wait for confirmation
Don’t assume a breakout. Always wait for a close beyond the breakout level.
Use volume confirmation
High volume strengthens signals.
Trade only strong patterns
Avoid weak, uneven, unclear structures.
Always check market trend
Pattern reliability increases in the direction of trend.
Use stop-loss
Set SL below support (bullish) or above resistance (bearish).
Measure target using pattern height
Many patterns provide measurable targets.
Combine with indicators
RSI, EMA, MACD improve accuracy.

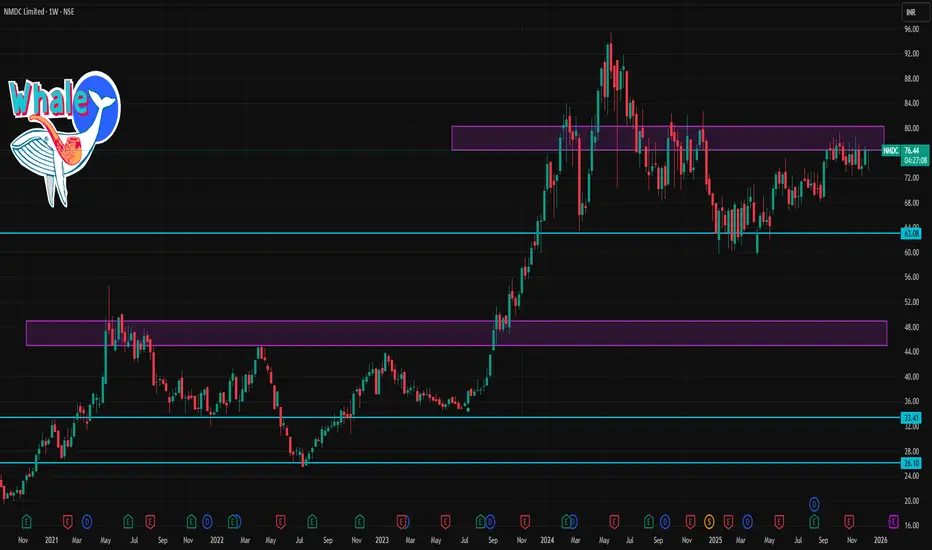
NMDC 1 Week Time Frame 📊 Current Context
The stock is trading around ~₹74–76 recently.
🧠 Notes for the Week
Bullish scenario: Holding above ₹76 could support a move toward ₹78–80.
Bearish scenario: If price closes weekly below ₹73–72, short‑term downside may extend toward ₹71.
Pivot levels and Fibonacci retracements suggest the midpoint resistance ~₹75–76 is key for the next few sessions.
🔎 Quick Summary (1‑Week Levels)
Level Type Zone (Approx)
Strong Support ₹71–72
Immediate Support ₹73–74
Weekly Pivot ₹75.5–76
Immediate Resistance ₹76–77
Higher Resistance ₹78–79
Breakout Zone ₹80+
ANANTRAJ 1 Week Time Frame 📌 Live Price Snapshot (Today)
Current price: ~₹516 – ₹521 on NSE (prices vary slightly by source)
Day range so far: ~₹506 – ₹533
52-week range: ₹376.15 (low) to ₹947.90 (high)
📉 Nearby Intraday Levels (Daily Pivots)
Daily Pivot: ~₹514
Resistance today: ~₹523–₹529
Support today: ~₹499–₹493
📍 How to Use These Levels This Week
Bullish Scenario
✅ If price closes above ₹545 (weekly pivot) — momentum may pick up toward ₹565 → ₹603 zones.
Neutral / Range
➡ Price staying between ₹506 ~ ₹545 → likely sideways consolidation this week.
Bearish Scenario
❌ Break below ₹506 support — targets slide toward ₹486 → ₹448.

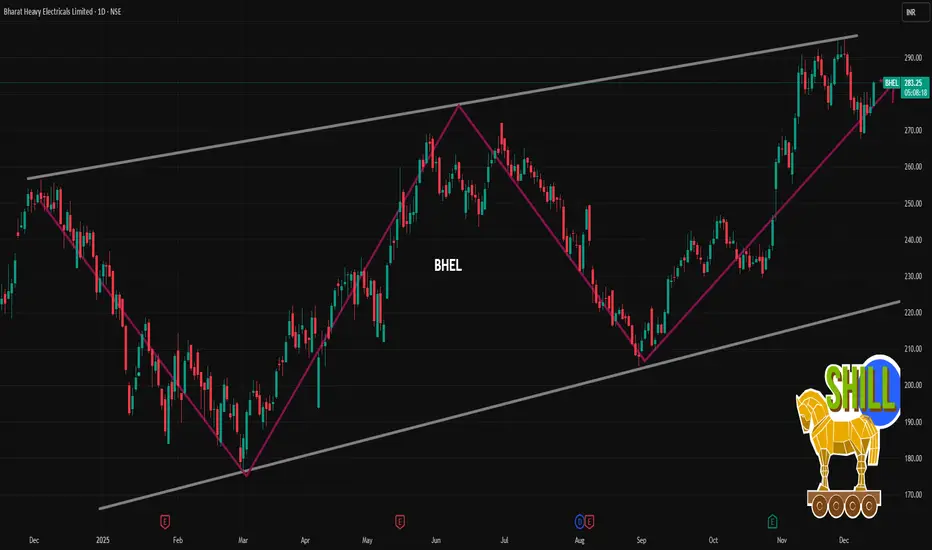
BHEL 1 Day Time Frame 📈 Live/Latest Price (1-Day View)
Current Price (approx): ~₹280.50–₹283.30 per share on NSE (latest intraday range) based on market data today.
Today’s Intraday High/Low: Roughly ₹273–₹279+ so far.
Previous Close / Today Open:
• Previous close near ₹277.75.
• Open around ₹275–₹286 depending on platform/time.
52-Week Range: Low ~₹176, High ~₹291–₹295+.
📊 1-Day Price Change
Recent trading shows relatively small daily movement indicating modest volatility typical of larger PSU stocks.
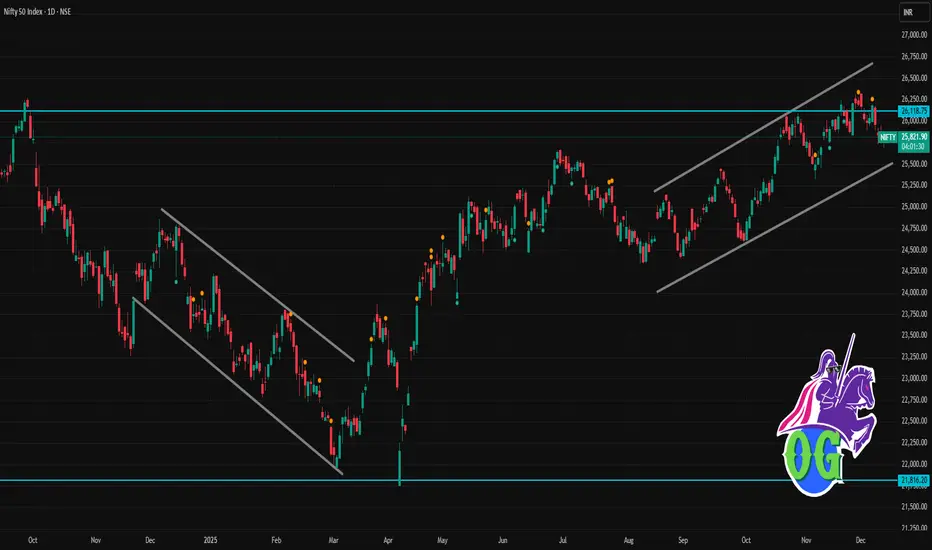
Nifty 50 1 Day Time Frame 📈 Current / Recent Level
Nifty 50 is trading around 25,825–25,830.
Earlier today, it was seen around 25,758.
🔎 Key Short-Term Technical Levels to Watch (1-Day Frame)
Support zone: ~25,600–25,500 — breach below this may signal weakening momentum.
Immediate support: ~25,700–25,750 — near current trading levels; a dip here could test buyers.
Resistance / Near-Term Upside: ~26,100–26,250 — a sustained move above this may re-ignite bullish bias for short-term traders.
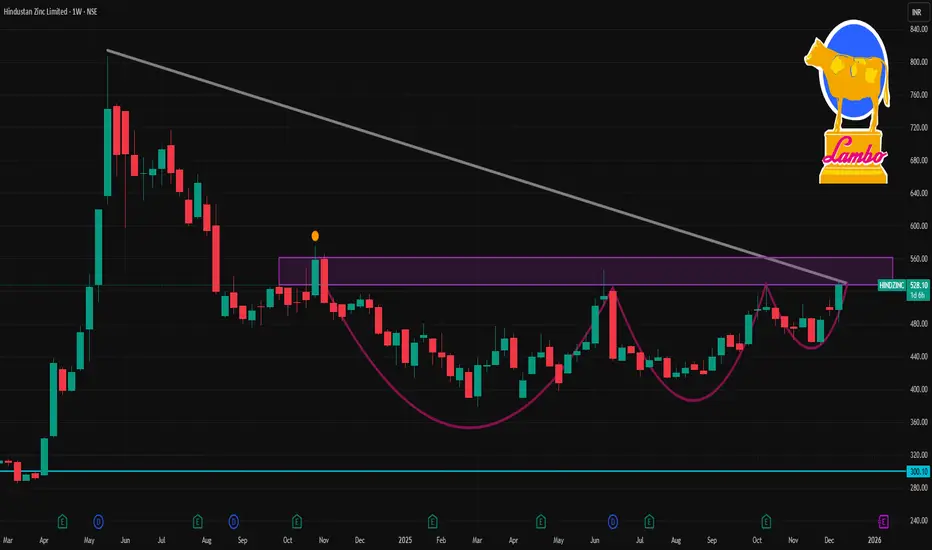
HINDZINC 1 Week Time Frame 📌 Current Situation & Context
Recent trading price (on some platforms) is around ₹528-532.
52-week trading range: ₹378.15 (low) to ₹546.80 (high).
There is renewed analyst interest: some brokerages have flagged HINDZINC among stocks with potential upside (up to ~48%).
⚙️ Key Technical / Pivot Levels (Near-Term)
According to a widely used pivot-point table for HINDZINC:
Level Type Approximate Price (₹)
Weekly Pivot (Standard) ~ ₹488.00
Weekly Support 1 (S1) ~ ₹476.00
Weekly Support 2 (S2) ~ ₹465.30
Weekly Resistance 1 (R1) ~ ₹498.70
Weekly Resistance 2 (R2) ~ ₹510.70
Weekly Resistance 3 (R3) ~ ₹521.40
✅ My Base Case (1-Week)
Given current price strength + analyst interest + global metals/commodity context:
Likely trading range over next week: ₹510 to ₹540, with possible upside toward ₹540–545 if momentum holds.
Key zone to watch (support): ₹498–510 — ideal for dip buying or watching consolidation.
WELENTWELENT is forming a bullish structure. After multiple rejections at resistance, it finally broke out, retested, and is turning bullish again.
There’s good volume and tight contraction near the SHS. If it sustains above 560, there’s a strong probability of an upside move.
Keep this stock on your watchlist.
✅ If you like my analysis, please follow me here as a token of appreciation :)
in.tradingview.com/u/SatpalS/
📌 For learning and educational purposes only, not a recommendation. Please consult your financial advisor before investing.

PARAGMILKStock is sustaining the upside move, staying above 9ema.
Now a breakout from here may give a good upside move. Overall setup is bullish, but always use the SL even when doing paper trading.
Keep it in your watchlist.
✅ If you like my analysis, please follow me here as a token of appreciation :)
in.tradingview.com/u/SatpalS/
📌 For learning and educational purposes only, not a recommendation. Please consult your financial advisor before investing.

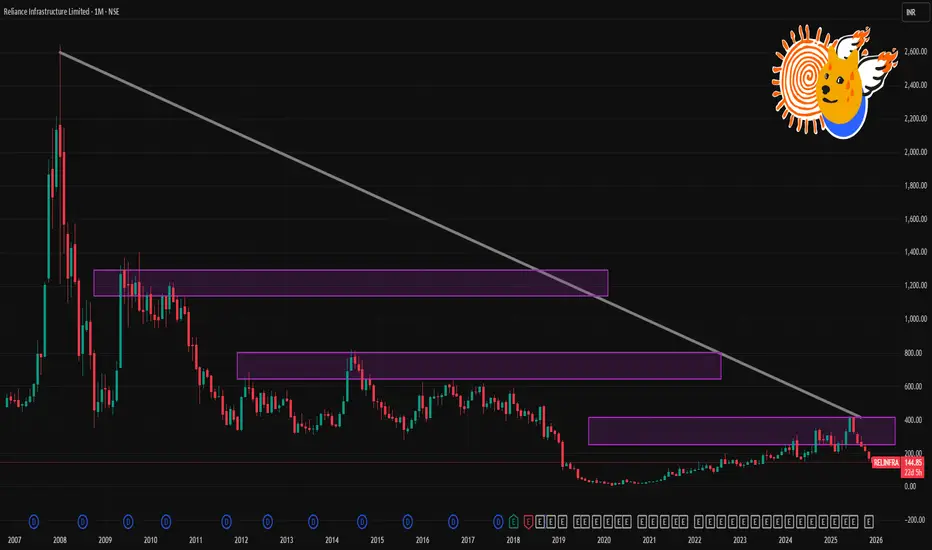
RELINFRA 1 Month Time Frame 📉 What’s Happening Now
As of 8–9 December 2025, Reliance Infrastructure is trading near ₹ 146–147 — its 52‑week low.
Over the past month the stock has seen a sharp drop of ~15–20%.
On 9 Dec it hit a fresh intraday low of ~₹ 139.6‑140, triggering lower‑circuit (i.e. trading halt for the day) — indicating heavy selling pressure.
🔎 Why the Weakness
The recent decline reflects broad selling pressure, partly driven by negative sentiment in its sector and possibly concerns over group‑level regulatory/legal issues.
While the company has been in distress compared with its earlier 52‑week high (~₹ 425), volatility remains high, with the share trading well below major moving averages.
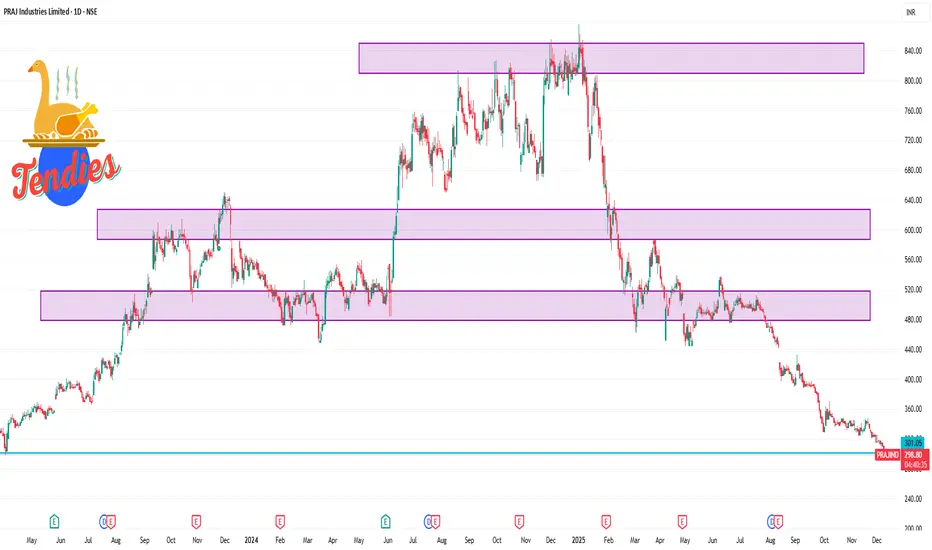
PRAJIND 1 Day Time Frame 📌 Current Live Price & Trend
✅ PRAJIND is trading around ₹300–₹302 on the NSE today (down ~2–3%).
✅ The stock recently hit a new 52-week low, showing a strong bearish trend and weakness.
Market Context (Short-Term Trend):
Price is trading below key moving averages (5D, 20D, 50D, etc.).
This suggests bearish pressure on the 1-day and short-term charts.
📊 1-Day Intraday Levels (Approximate)
🟥 Resistance (Upside Barriers):
R1: ~₹308 – initial resistance near short-term bounce area
R2: ~₹315 – psychological resistance zone
R3: ~₹322 – higher resistance from recent intra-week levels
🟩 Support (Downside Levels):
S1: ~₹297 – immediate intraday support
S2: ~₹290 – lower support from recent swing lows
S3: ~₹280 – significant downside support zone
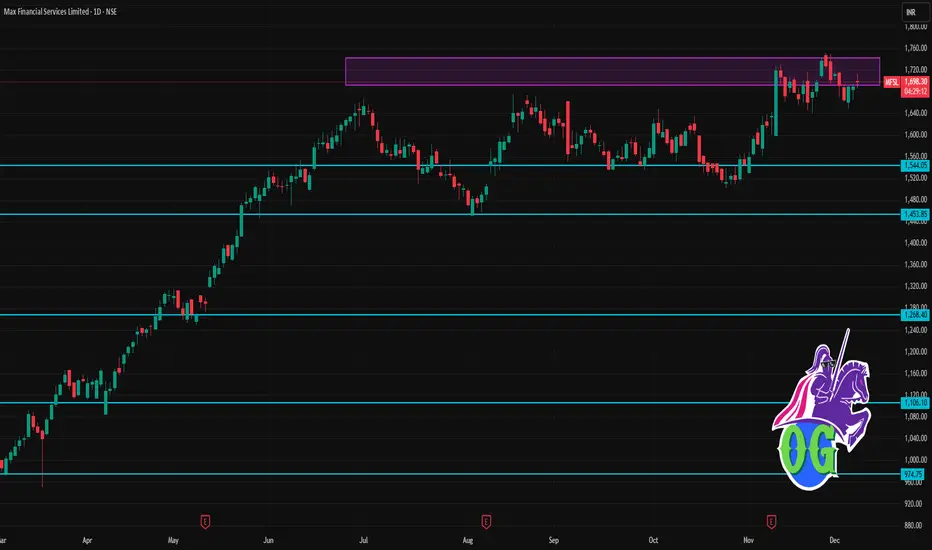
MFSL 1 Day Time Frame 📌 Current status
Latest quote for MFSL is ≈ ₹1,690.20.
52‑week range: Low ~ ₹950 — High ~ ₹1,751.40.
According to one technical‑analysis provider, the short‑term/mid‑term/long‑term bias remains bullish, though price is currently a few percent below recent resistance.
🎯 What this implies (on 1‑day timeframe)
As long as MFSL stays above S1 (~₹1,670), the short‑term trend remains stable; dips toward S2/S3 (~₹1,646 / ₹1,622) could offer re‑entry opportunities if price action stabilizes.
A breakout above R1 (~₹1,716–1,737) and sustained move toward R2 (~₹1,740–1,764) could open up upside potential toward R3 (~₹1,764–1,794).
If price falls below S2/S3, risk of a deeper correction rises — possibly pulling back toward lower support zones or consolidating.
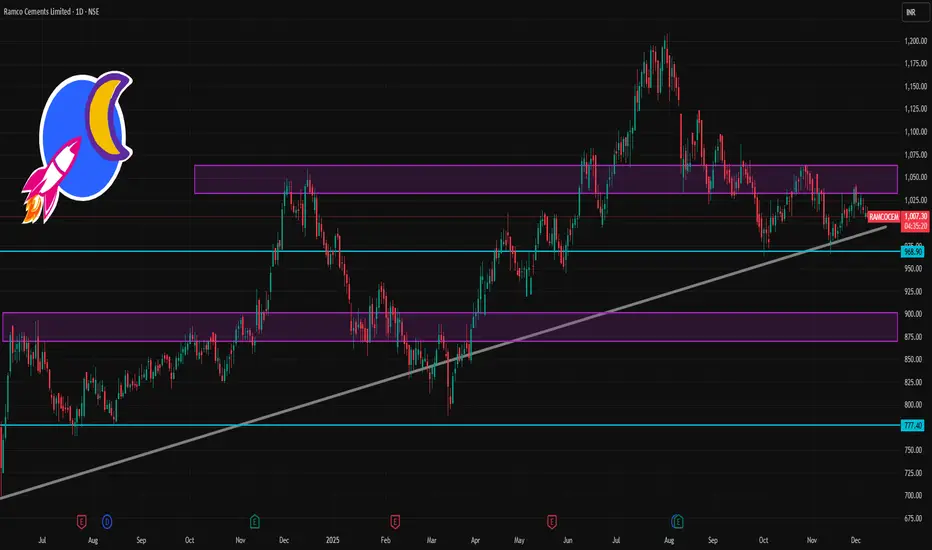
RAMCOCEM 1 Day Time Frame 📌 Current Price (Approx)
₹1007–₹1011 range on NSE during today’s session. Live market shows price around this zone (previous close ~₹1,011).
📊 Daily Pivot & Support/Resistance Levels (Updated)
(from reliable intraday pivot data)
Daily Pivot Zone
Central Pivot Point (CPR): ~₹1,011.4–₹1,011.8 (key equilibrium level)
Resistance Levels
R1: ~ ₹1,019
R2: ~ ₹1,027
R3: ~ ₹1,034–₹1,035
(above these levels can imply stronger upside if sustained)
Support Levels
S1: ~ ₹1,011–₹1,003
S2: ~ ₹996–₹992
S3: ~ ₹988–₹980
(broken support zones may accelerate downside)
✅ Key ODI pivots (Standard daily):
S1 ~ ₹1003.7
Pivot ~ ₹1019.1
R1 ~ ₹1027.3 (minor breakout level)
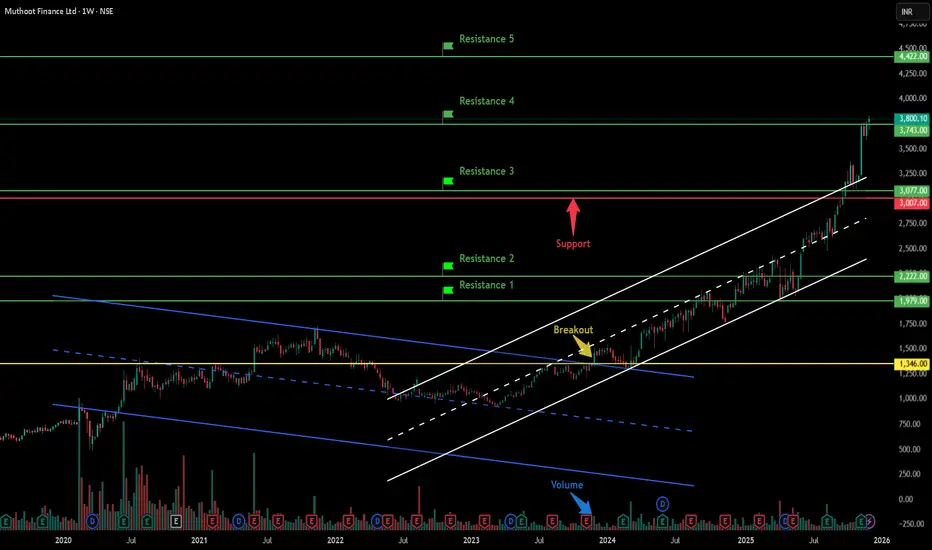
Muthoot Finance Limited - Breakout Setup, Move is ON...#MUTHOOTFIN trading above Resistance of 3743
Next Resistance is at 4422
Support is at 3007
Here are previous charts:
Chart is self explanatory. Levels of breakout, possible up-moves (where stock may find resistances) and support (close below which, setup will be invalidated) are clearly defined.
Disclaimer: This is for demonstration and educational purpose only. This is not buying or selling recommendations. I am not SEBI registered. Please consult your financial advisor before taking any trade.