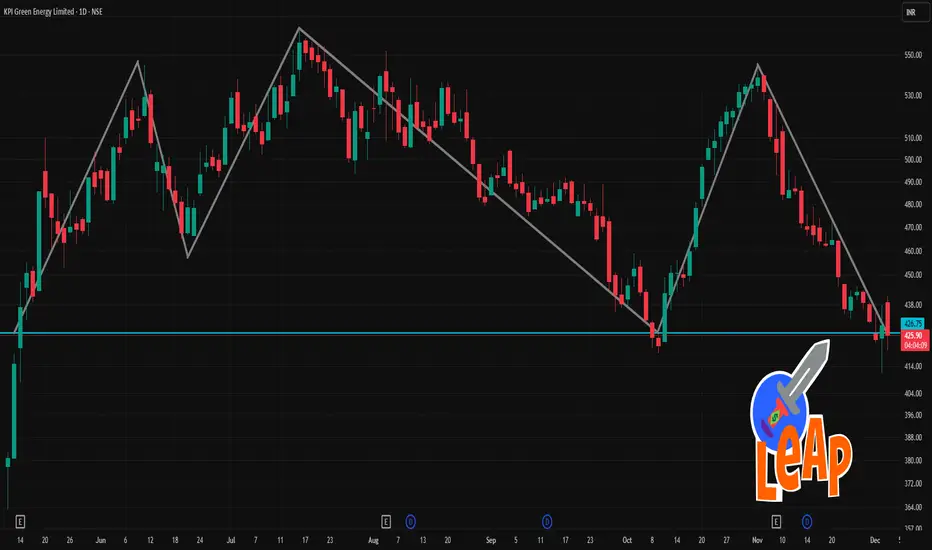
KPIGREEN 1 Day Time Frame 📈 Current Snapshot (as per latest available sources)
Several platforms list the share price around ₹ 429.9 – ₹ 431.4 on NSE in recent sessions.
The 52‑week range for KPI Green remains roughly ₹ 313.40 (low) to ₹ 588.80 (high).
On a recent day, typical intraday swings showed lows around ₹ 430‑431 and highs near ₹ 437‑438, indicating a moderate intraday move.
🧮 What This “Level” Suggests Today
The current price (~₹ 430–431) places the stock substantially above the 52‑week low, but significantly below the 52‑week high — suggesting the stock is in a lower‑to‑mid zone of its yearly range.
Intraday volatility seems modest; the share hasn’t shown large spikes today, indicating relatively stable trading so far.
This could imply either consolidation or market caution — not a strong upward breakout, but also not near floor levels.
Chartbychart
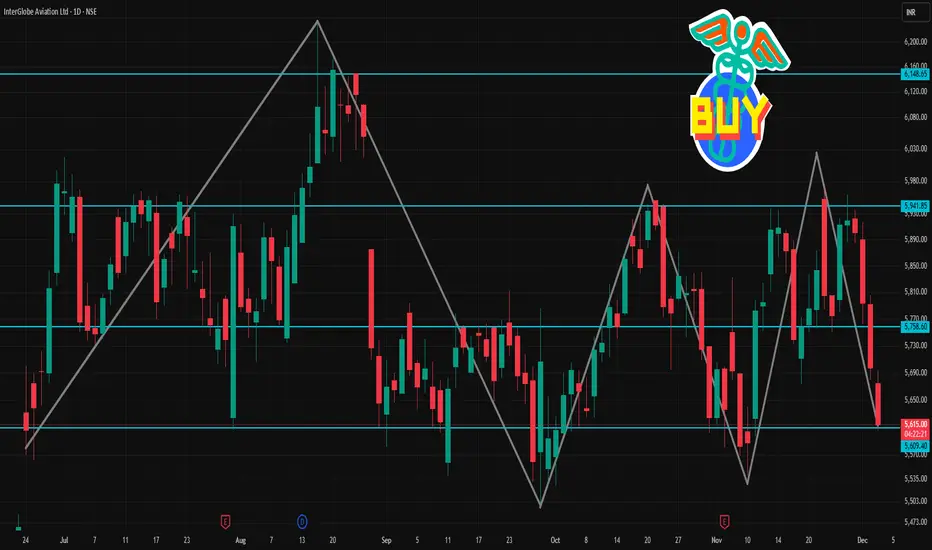
INDIGO 1 Day Time Frame 📌 Latest Price Snapshot & Context
On a recent trading day, the stock’s day’s range was ~ ₹ 5,626 – ₹ 5,694.
The 52-week range remains ₹ 3,945 – ₹ 6,232.50.
Recent closing / quoted prices have been around ₹ 5,900 – ₹ 5,913 (though there are multiple sources — price may fluctuate intraday).
🔄 Daily Pivot & Key Intraday Levels (Standard + Camarilla/Fibonacci from a common pivot-level table)
From a recent pivot-level analysis for “daily” timeframe:
Level Type / Label Price (Approx, ₹)
Pivot (standard daily) ₹ 5,672.33
Support 1 (S1) ₹ 5,634.67
Support 2 (S2) ₹ 5,599.33
Support 3 (S3) ₹ 5,561.67
Resistance 1 (R1) ₹ 5,707.67
Resistance 2 (R2) ₹ 5,745.33
Resistance 3 (R3) ₹ 5,780.67
For “Camarilla” variant on same day: pivot also ₹ 5,672.33, with S- and R- levels slightly tighter: e.g. S1 around ₹ 5,663, R1 around ₹ 5,677.
Some alternate analyses cite supports around ₹ 5,733 / ₹ 5,671 / ~₹ 5,579, and resistances ~ ₹ 5,804 / ₹ 5,832 / ~₹ 5,978 depending on timeframe/ method.
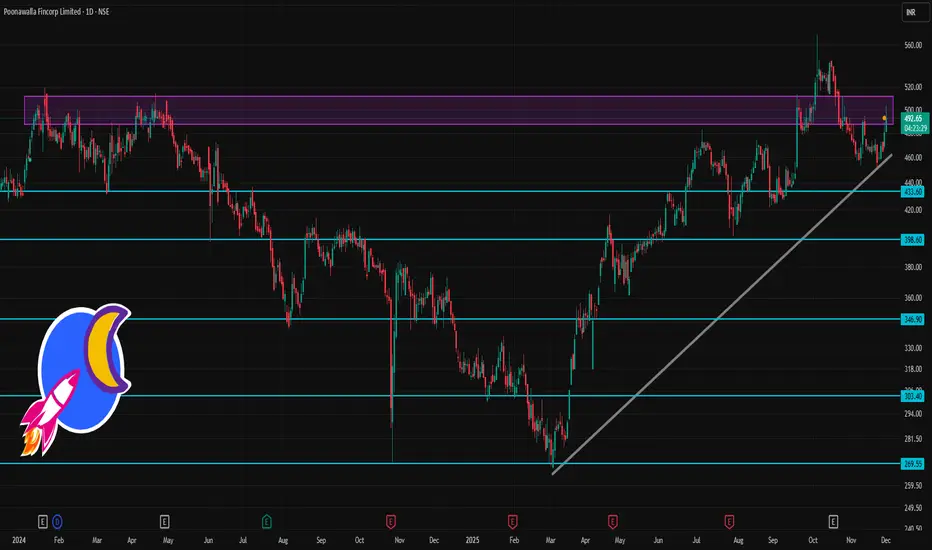
POONAWALLA 1 Day Time Frame 📌 Latest price & context
On one of the latest snapshots, the share price was ~ ₹ 492.65 (as per a public chart)
The stock remains among relatively volatile mid-cap / NBFC counters, with a fairly high beta (i.e. sensitivity to market swings).
✅ Technical Momentum & Risk Profile
Technical sources currently signal a “bullish / buy-leaning” bias based on moving averages (from short-term to long-term) for Poonawalla.
But high volatility & elevated beta mean risk — sharp swings are possible in either direction depending on market sentiment, NBFC-sector news, and macro cues.
⚠️ What to watch out for
The pivot-based levels assume relatively normal volatility — big sector-wide moves, news, or NBFC-specific developments can render them less reliable.
As an NBFC / mid-cap, the stock remains sensitive to interest-rate outlook, credit-sector sentiment, and macroeconomic conditions — not just its own chart.
The “buy bias” from moving averages doesn’t guarantee a smooth upward path — you should watch volume, daily chart pattern, and broader market context.
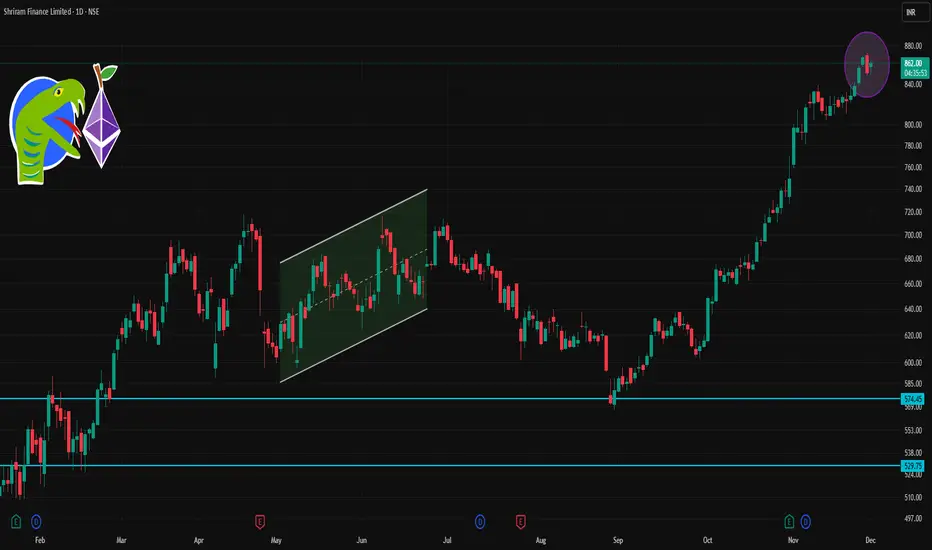
SHRIRAMFIN 1 Day Time Frame 📊 Current Snapshot
Latest live price: ~ ₹852–857 (depending on trade moment).
Today’s high / low range: ~ ₹861.95 high / ~ ₹850.40 low.
52-week range: ₹493.35 (low) ↔ ₹872.00 (high).
✅ What This Means for Intraday / Next Sessions
If price stays above ~₹857–858 (pivot) — bias remains bullish → could target ₹866 → ₹880–881.
If price dips but finds support near ₹842–843, watch for bounce (possible buying opportunity).
A break below ₹834 → ₹820 downward zone might signal risk of further downside — monitor overall market and sector trend.
Use stop-loss (if trading) near support zones to manage risk, given volatility and sensitivity to overall market moves.
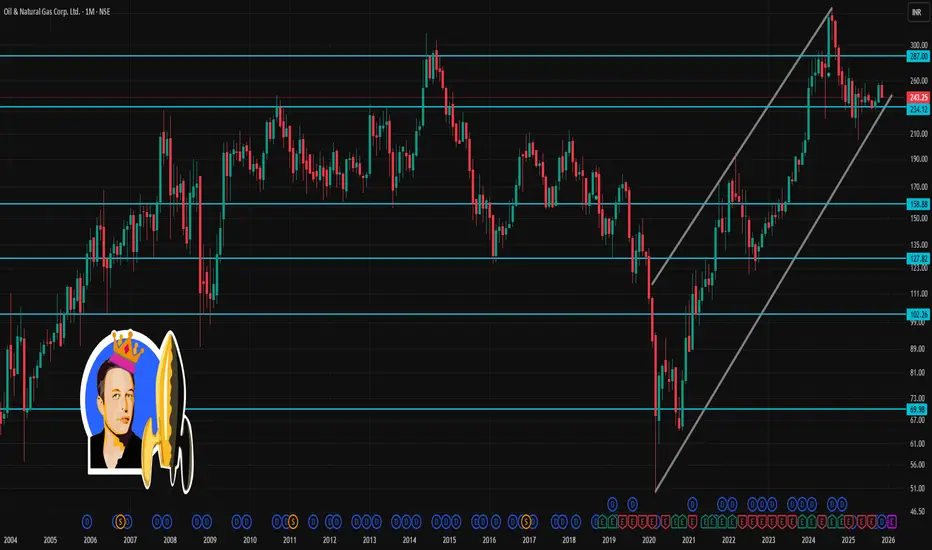
ONGC 1 Month Time Frame 📌 Current snapshot
ONGC last traded around ₹243–₹244.
Over the past month, the stock has dropped ~3–4%.
📈 What could happen in next month
Bearish scenario: If price slips below ₹241 and sentiment (oil prices, global energy demand, investor flows) remains weak — ONGC could test the lower support zone around ₹238–₹240.
Neutral / range-bound: The stock could hover between ₹241–₹251, especially if crude/oil-sector news remains mixed, or broader market is choppy.
Bullish scenario: If ONGC closes above ~₹251 with supportive macro (oil prices, global demand, corporate news) — next leg could push it towards ₹255–₹257 (near-term target).
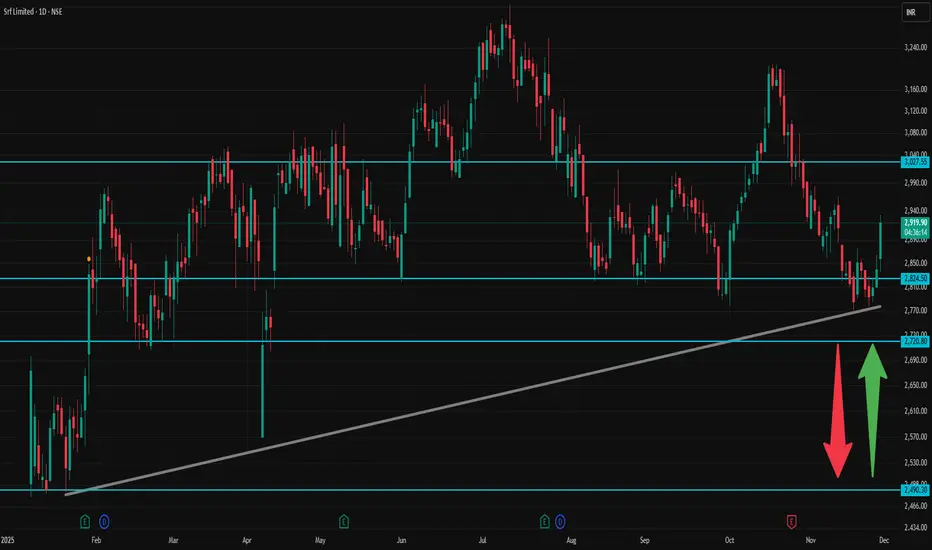
SRF 1 Day Time Frame ✅ Current context
According to public price data, SRF’s recent high for the day is ~ ₹ 2,933, low ~ ₹ 2,836.80.
As per a technical‑analysis summary: moving averages (short-to-medium term) and oscillators on daily timeframe show a bullish bias (Strong Buy on many signals).
🎯 How to interpret / trade with these levels
As long as price stays above Pivot (~₹ 2,866), bias remains mildly bullish — look for R1 → R2 → R3 as possible targets.
If momentum is strong (volume + positive broader market), a break above R2 (~₹ 2,920) could push toward R3 (~₹ 2,933–2,937+).
On downside, supports at ₹ 2,811.93 → ₹ 2,783.87 → ₹ 2,757.73 are key — loss of S1 may open S2/S3.
For conservative traders: good entry or add-on zones could be near S1 or pivot, with stop‑loss a little below S2/S3 depending on risk tolerance.
⚠️ Important caveats
These are static pivot-based levels, and real market moves may overshoot or not respect them depending on news, volume, macro‑market sentiment.
Given volatility (as seen in day’s high-low range), levels above R2 or below S2 can get tested — intraday discipline (stop-loss, position sizing) is crucial.
Always watch volume, overall index trend (Nifty/Sensex), sector news — technical levels work better when confirmed by context.
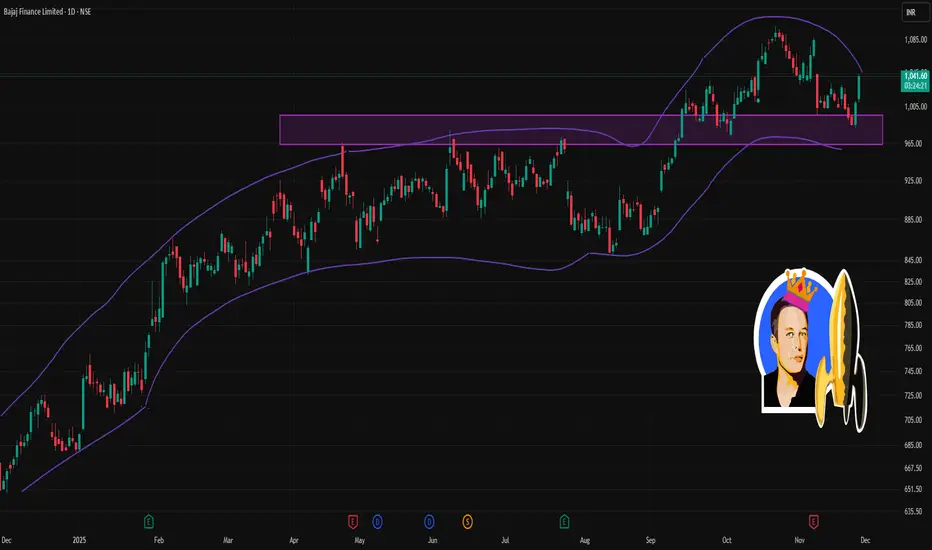
BAJFINANCE 1 Day Time Frame ✅ What we know now (as of latest available data)
1. The latest publicly quoted price for Bajaj Finance is ~ ₹1,042 – ₹1,044.
2. According to a recent report, the stock touched an intraday high of ₹1,042.20.
3. The stock is above its short‑ and long‑term moving averages, which suggests current bullish momentum.
⚠️ Important Notes / Context
These are technical levels derived using standard pivot‑point / support‑resistance calculation methods. They are not guaranteed — markets may overshoot or violently gap.
Always consider fundamentals (company news, sector, broader market sentiment) along with technicals before acting.
Use stop‑loss / risk management because intraday volatility can cause swings beyond these levels.
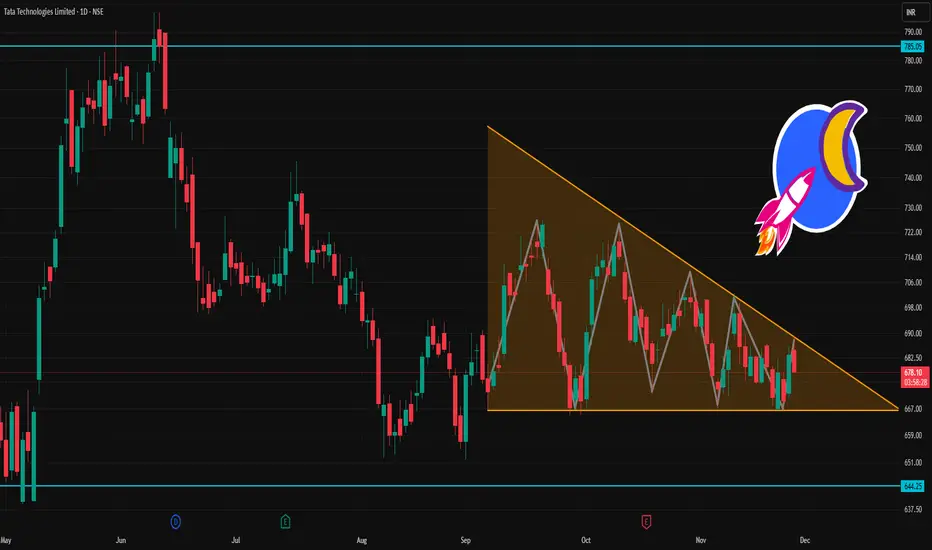
TATATECH 1 Day Time Frame 📌 Key recent data (approx as of last close):
Last traded price: ~ ₹676.75.
Day high / low: ~ ₹679 / ₹670.25.
52‑week high: ~ ₹973.85; 52‑week low: ~ ₹597.
🧮 What this suggests for today (intraday / short‑term only):
If Tata Tech trades above ₹672.7, it could aim for ₹677–684 as short‑term resistance.
A fall below ₹672.7 might push price toward ₹665–661 as support.
₹684–696 could act as a more extended intraday upside zone, if there’s bullish momentum.
🔎 Context & What to Watch Out For
The 52‑week high is still much higher — so in a broader sense, the stock remains far off prior highs.
On short‑term charts, some indicators (e.g. moving‑average crossovers / candle‑pattern heuristics) recently gave bearish / neutral signals.
Volatility and broader market sentiment (especially in the auto / engineering‑services / global tech outsourcing space) can swing prices significantly — so these levels are very approximate.
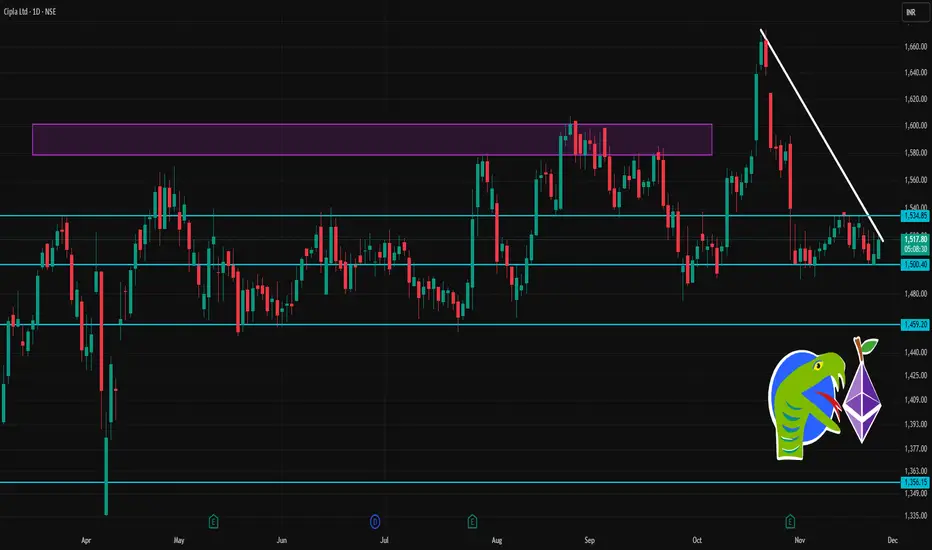
CIPLA 1 Day Tiem Frame 📊 Current Snapshot (approx)
Last traded / Current Price (NSE / BSE): ~ ₹ 1,517
Today’s trading range (so far): Low ~ ₹ 1,505; High ~ ₹ 1,520.90
52-week range: Low ~ ₹ 1,335; High ~ ₹ 1,673.
🔹 Daily Pivot & Key Levels for CIPLA
Based on standard daily pivot-point analysis for today.
Level Type Price (approx)
Pivot (central) ₹ ~1,510.13
Support 1 (S1) ~ ₹ 1,497.6
Support 2 (S2) ~ ₹ 1,487.6
Support 3 (S3) ~ ₹ 1,475.1
Resistance 1 (R1) ~ ₹ 1,520.1
Resistance 2 (R2) ~ ₹ 1,532.6
Resistance 3 (R3) ~ ₹ 1,542.6
Central Pivot (CPR range): ~ ₹ 1,508.8 – 1,511.4
🔍 What to Watch — Intraday Scenarios
Bullish bias: If price stays above pivot (~₹ 1,510), look for near-term resistance at ₹ 1,520 → ₹ 1,532 → ₹ 1,542+.
Bearish trigger: If price breaks below S1 (~₹ 1,497), downside may extend toward ₹ 1,487 → ₹ 1,475.
Momentum context: According to recent technical indicator readings, moving averages (5, 10, 20-day) appear in bullish alignment — which suggests the trend is currently upward to neutral.
Volatility range for the day could realistically span ~ ₹ 1,475 – ₹ 1,545, if price tests extremes.
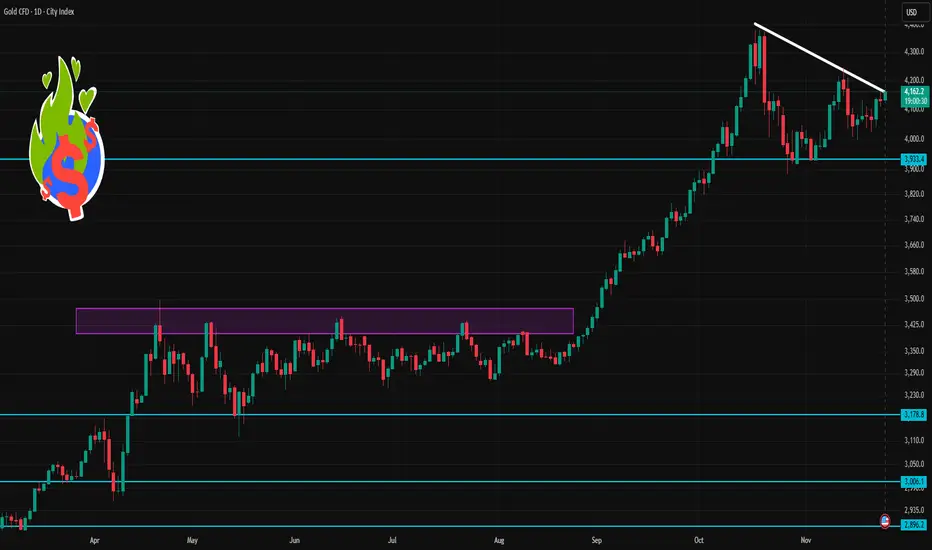
Gold 1 Day Time Frame 🔎 Current Context
1. Gold currently trades around US $4,160–4,165/oz.
2. Many technical-analysis services show daily momentum as bullish: moving averages, RSI/MACD and other indicators point toward a positive bias.
3. But macro factors (strong USD, Fed policy, global risk sentiment) remain important and may cause sharp swings.
⚠️ What to Watch Out For
Volatility: Gold remains sensitive to macro events — USD strength, rate expectations, major economic data — so price can easily break support/resistance zones.
False Breakouts: Even if price crosses a level, it may revert quickly. Combine with other indicators (volume, price action, confirmations) before acting.
Trend Shifts: A major change in global risk sentiment or central-bank moves can rapidly change trend direction, invalidating technical levels.
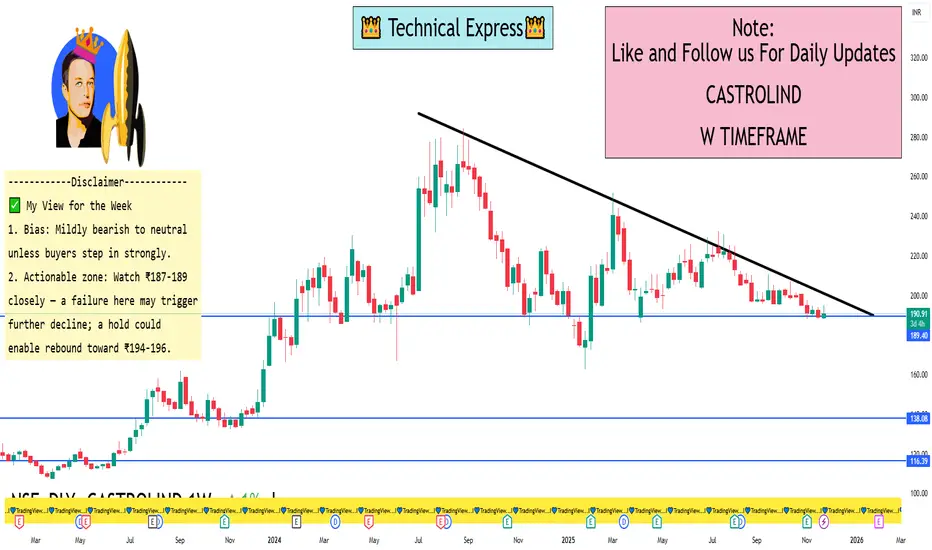
CASTROLIND 1 Week View 🔍 Key Levels
Based on recent technical data:
Support zone: ~ ₹187 – ₹189 (ET Money shows S3 ≈ ₹185.42, S2 ≈ ₹186.71)
Pivot / near-term equilibrium: ~ ₹190 – ₹191 (Weekly central pivot ~₹190.42)
Upside resistance: ~ ₹194 - ₹196 (Weekly R1 ~₹192.83, R2 ~₹196.64)
📈 Short-Term Bias & Likely Scenarios
The momentum indicators (RSI ~33, CCI negative) show the stock is under downward pressure/weak momentum.
If the price stays above ₹187-189, one could anticipate a bounce up into the ₹194-196 zone this week.
If it breaks below ~₹187-189 decisively, support further down could be ~₹183-185 (based on extension levels)
✅ My View for the Week
Bias: Mildly bearish to neutral unless buyers step in strongly.
Actionable zone: Watch ₹187-189 closely — a failure here may trigger further decline; a hold could enable rebound toward ₹194-196.
If you want a more aggressive trade setup (with stop-loss, reward ratio), I can map that too.
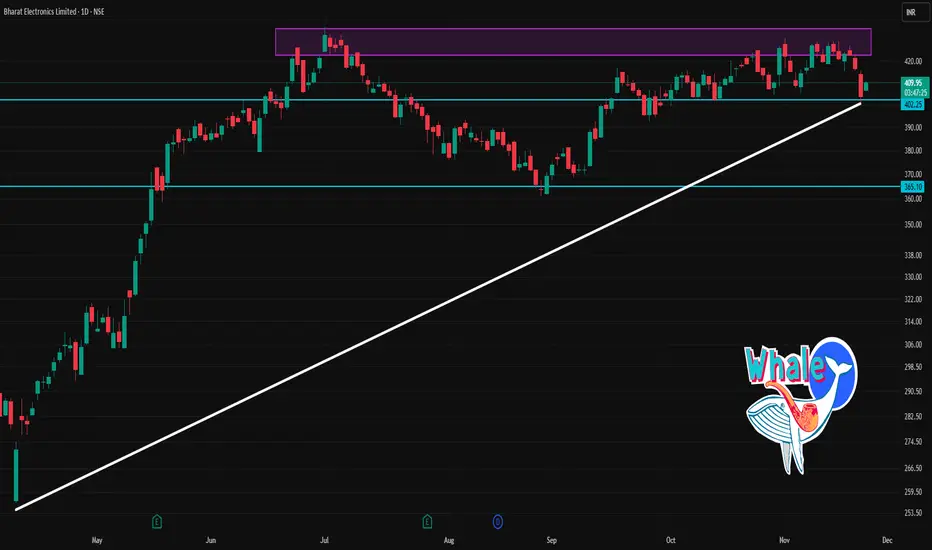
BEL 1 Day Time Frame✅ Current Status
Latest price around ₹407 – ₹410 on the NSE/BSE.
Technical indicators (daily time frame) are leaning bearish/weak: e.g., daily moving averages show more “sell” signals than “buy”.
📌 Key Levels to Watch (Daily Chart)
Based on available pivot/level data and recent price action, here are approximate levels:
Support levels:
S1 ~ ₹407–₹408
S2 ~ ₹405–₹406
A deeper support zone if this breaks might be ₹400-₹404.
Resistance levels:
Pivot ~ ₹413-₹414
R2 ~ ₹416-₹417
R3 ~ ₹419-₹420+
🔍 Short-Term Outlook
Because the stock is hovering just above support (~₹407-₹408), holding above this zone is important to maintain near-term structure.
If price breaks below ~₹405, risk of further weakness increases.
On the upside, a successful breakout above ~₹416-₹417 could open space towards ~₹419-₹420.
The current momentum is weak/negative, so any upside will likely need a catalyst (volume, news) to gain strength.
ENRIN 1 Day Time Frame 🔍 Key Price Info
Last traded ~ ₹3,090 (as of ~10:44 AM IST) on 25 Nov 2025.
Day’s high-low range: ~ ₹3,090 – ₹3,303 (intraday high reported ~₹3,303).
52-week range: ~ ₹2,508.80 – ₹3,625.00.
🎯 Support & Resistance Levels (Short Term)
Support Levels:
~ ₹3,050 – ₹3,070: close to current price, would be first level of support.
~ ₹3,000 – ₹3,030: if the stock breaks below the above, this zone becomes important.
~ ₹2,950 – ₹2,990: deeper support and closer to lower end of recent consolidation.
Resistance Levels:
~ ₹3,250 – ₹3,300: recent high zone around ₹3,303, so getting above this would be bullish.
~ ₹3,350 – ₹3,400: next significant zone before approaching the 52-week high.
~ ₹3,600+: near the 52-week high (₹3,625) and a major resistance barrier.
📉 Intraday Trading View
If the stock holds above ~₹3,050-₹3,070 with strong volume, it could attempt a push toward the resistance zone of ~₹3,250-₹3,300.
If it loses support at ~₹3,050, watch for potential slide toward ~₹3,000 or lower ~₹2,950 zone.
Volume, market sentiment & any corporate news will greatly influence whether it can break resistance or find support.

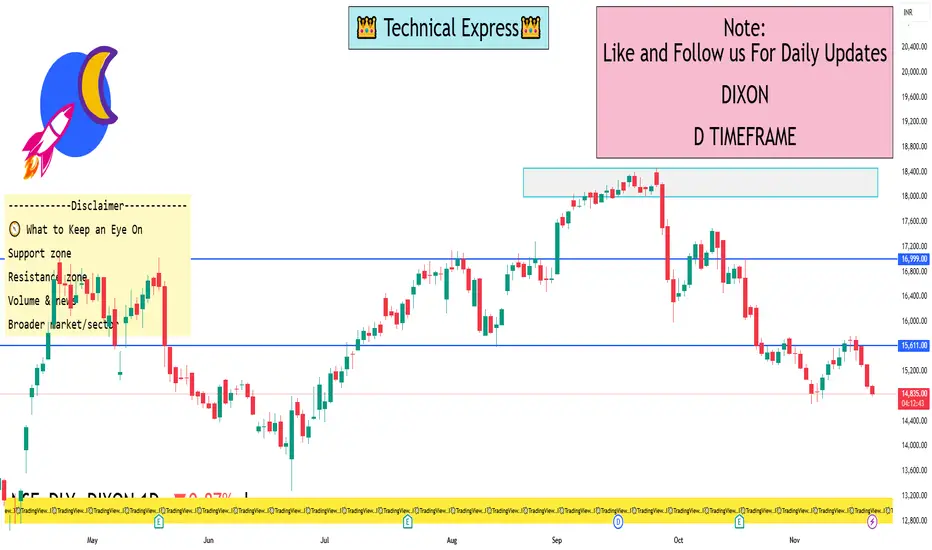
DIXON 1 Day Time Frame 🔍 Price & Pivot Levels to Watch
1. Latest live price: ~ ₹14,825 (as of intraday in India) from Groww.
2. Pivot levels (classic) for the day (based on Moneycontrol data):
Pivot ~ ₹15,065
S1 ~ ₹14,820
R1 ~ ₹15,209
3. Key moving-average resistances:
50-day SMA ~ ₹15,578 (price is below)
200-day SMA ~ ~₹15,738 – ~₹15,789 range (price is well below).
🧭 What to Keep an Eye On
Support zone: Near the S1 pivot (~₹14,820) and possibly the intra-day low zone (~₹14,700-14,800)
Resistance zone: The pivot (~₹15,065) and then R1 (~₹15,209) and the nearby moving averages (~₹15,500-15,600)
Volume & news: A sharp uptick in volume or a positive corporate/catalyst event could change the short-term dynamic.
Broader market/sector: Since Dixon is in electronics manufacturing, macro sentiment, export incentives, and input cost changes matter.
TVSMOTOR 1 Day Time Frame 📌 Key levels (approximate)
Pivot (classic) for recent day: around ₹ 3,408.73.
Resistance levels:
R1 ≈ ₹ 3,448.47
R2 ≈ ₹ 3,510.43
R3 ≈ ₹ 3,550.17
Support levels:
S1 ≈ ₹ 3,346.77
S2 ≈ ₹ 3,307.03
S3 ≈ ₹ 3,245.07
🎯 What to watch for possible trade decisions
Bullish scenario: If price breaks above the pivot (~₹3,409) and holds above R1 (~₹3,448), a move toward R2 (~₹3,510) or higher may be possible.
Bearish scenario: A break below S1 (~₹3,347) could open risk toward S2 (~₹3,307) or S3 (~₹3,245).
Neutral/Ranging: The stock may also trade between ~₹3,347 and ~₹3,448 while the trend remains unclear.

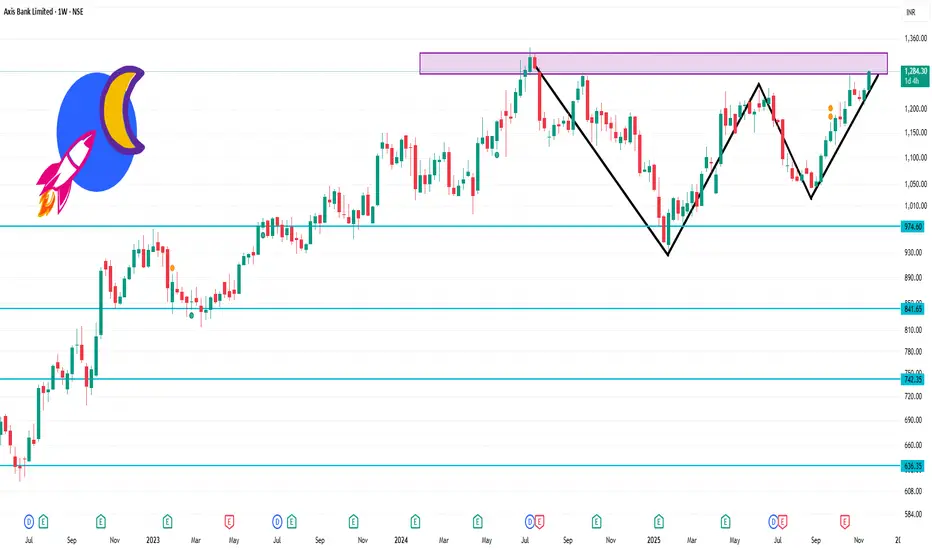
AXISBANK 1 Week Time Frame 🔍 Key Levels for the Week
Based on recent pivot/technical data:
Resistance levels: ~ ₹1,276 to ₹1,282 (around daily R1/R2)
Higher resistance: ~ ₹1,290-₹1,302 if uplink happens
Support levels: ~ ₹1,252-₹1,246 as near-term floor
Broader weekly support: ~ ₹1,232-₹1,218 region if deeper pullback
⚠️ Things to keep in mind
Current price is near the 52-week high region (~₹1,284) which increases risk of resistance/strain.
Short-term signals/pivots are useful but market news, macro banking events, FII/DII flows can quickly shift dynamics.
Use stop-losses or risk-controls if trading around these levels given the tight range and possible whipsaw.
CAMS 1 Week TIme Frame 📊 Key current context
The stock is trading around ₹4,020 to ₹4,040 (approx).
52-week range: ~₹3,031 (low) to ~₹5,367 (high).
Technical pivot data shows weekly support/resistance and pivot levels.
If price holds above ~₹3,900-₹4,000 zone and shows strength, a move toward ~₹4,100-₹4,150 is plausible.
If price breaks below ~₹3,900 decisively, then ~₹3,800 and even ~₹3,670 could become the next zones to watch.
Break above ~₹4,150-₹4,200 would increase odds of testing ~₹4,300-₹4,400 zone.
⚠️ Things to watch & caveats
The technical levels are approximate and different sources give slightly different numbers; always use stop-loss discipline.
Weekly charts smooth out short-term noise, but in volatile sectors things can move fast.
Always check for upcoming news, earnings, macro conditions, as these can override technicals.
These levels are not guaranteed entry/exit signals — treat them as potential zones.

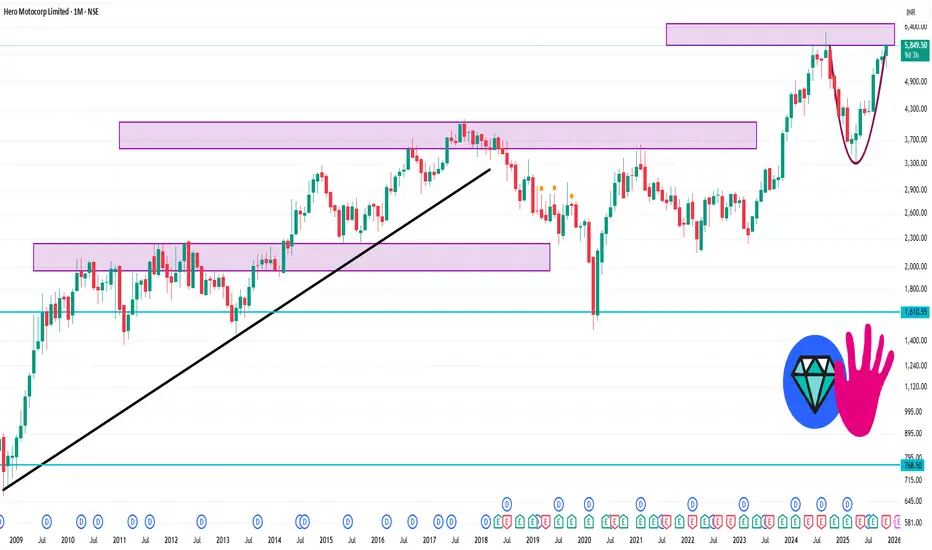
HEROMOTOCO 1 Month Time Frame 🎯 Key Price Levels (1-Month Timeframe)
Here are approximate support & resistance levels you may watch in the next month:
Resistance levels:
~ ₹5,850-₹5,900: Price is already trading around this band (Trendlyne shows ~₹5,850).
Next major resistance might lie closer to ~ ₹6,000-₹6,100 if momentum carries on (psychological level + prior swing highs).
Support levels:
First major support: ~ ₹5,600-₹5,650 (just under current trading zone)
Secondary support: ~ ₹5,300-₹5,400 zone — a deeper pull-back level if the first support gives way.
Pivot / mid-zone:
A pivot or neutral zone around ~ ₹5,700-₹5,800 may act as a battleground between bulls & bears.
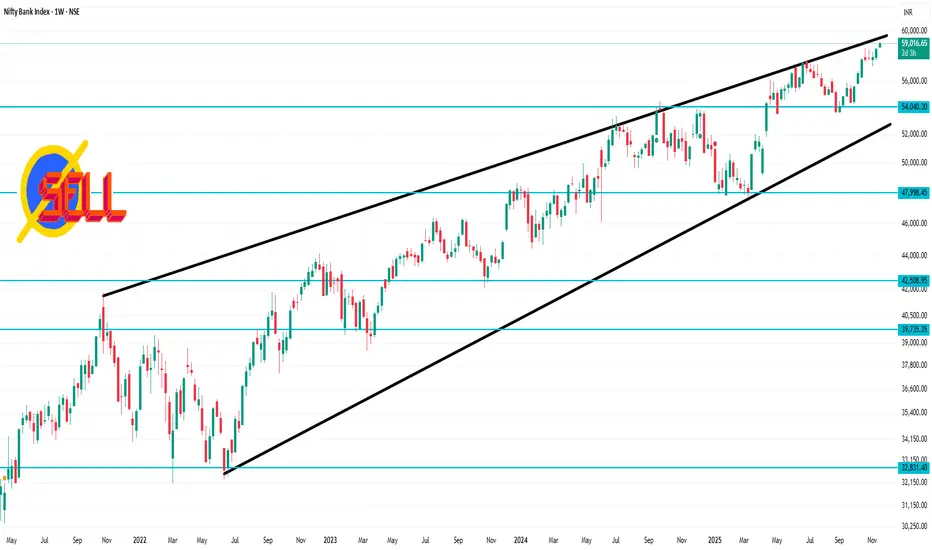
Bank Nifty 1 Week Time Frame🔍 Current snapshot
The index is trading around ~ 58,900-59,000 points.
It recently hit a fresh all-time high of around 59,100 points in recent sessions.
The structure shows it is near upper-resistance territory and signs of short-term exhaustion appear.
✅ Key Weekly Time-Frame Levels
Resistance zones
~ 59,100 – 59,300 points: This is the immediate upper resistance (recent ATH level) which bulls need to clear for a fresh leg up.
On a breakout above ~59,300, the next psychological target zone might be ~59,500-60,000+.
Support zones
~ 58,600 – 58,300 points: A key near-term support zone. Breakdown below ~58,800 may trigger weakness toward this zone.
A stronger support below that is around ~ 57,500 – 57,200 points, which becomes relevant if heavy selling or structural break occurs.
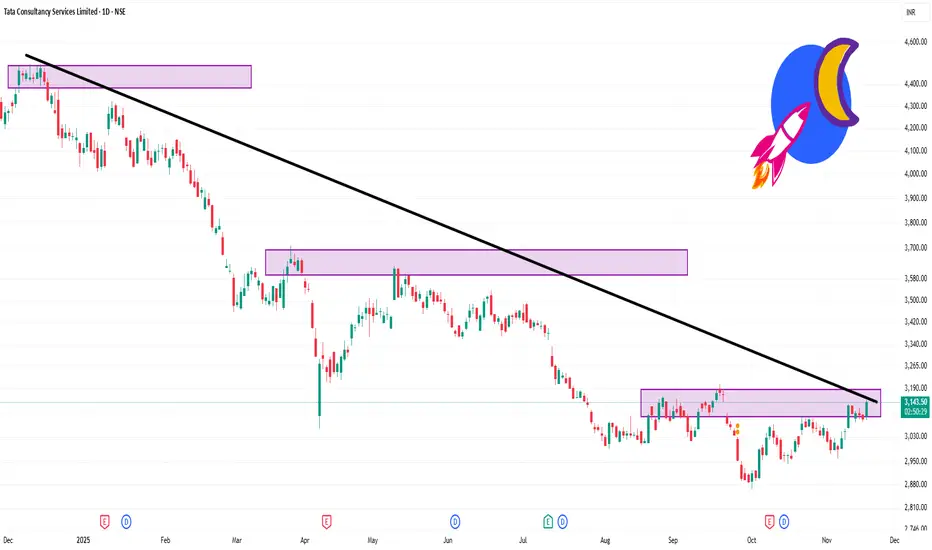
TCS 1 Day Time Frame ✅ Key numbers
Current price: ~ ₹3,147 (NSE)
Today’s range: Low ~ ₹3,083.50, High ~ ₹3,149.90
Previous close: ~ ₹3,087.10
📊 Key levels to watch on daily timeframe
Support zone: If price drops, watch around ~ ₹3,080-₹3,100 (today’s low region)
Immediate resistance: Today’s high ~ ₹3,149.90. If that breaks, next resistance may show up near ~ ₹3,200-₹3,250 (psychological + recent historic minor highs)
Trend pivot: The open of ~ ₹3,097 suggests a pivot point; staying above this gives short-term bullish lean, dropping back below may bring weakness
Risk zone: If price falls back and breaks below ~ ₹3,050, it may test lower support around ~ ₹2,990-₹3,000 (recent structural support area)
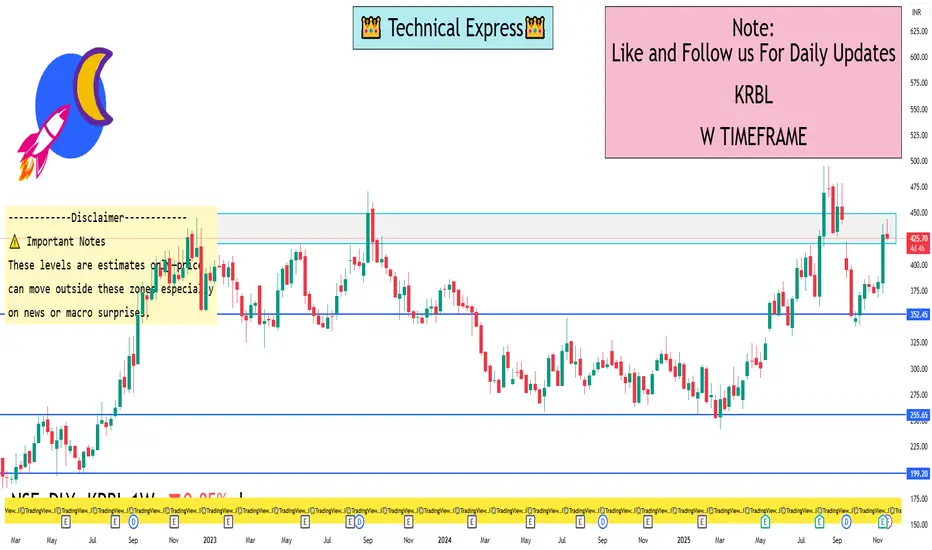
KRBL 1 Week View 🔍 Current data snapshot
Last quoted price: ~ ₹ 425 to ₹ 430.
Recent high trades around ~ ₹ 443.90 (1-day high) and low around ~ ₹ 424-425.
On the weekly view, the stock is in an upward leg, with recent momentum.
📊 1-Week Timeframe Support & Resistance Estimate
Support zone: ~ ₹ 410-420 — a near-floor based on recent consolidation around ~₹ 424-425.
Key pivot zone: ~ ₹ 430-435 — if price stays above this range, the short-term bullish bias remains intact.
Resistance zone: ~ ₹ 450-460 — an approximate upper barrier if momentum continues; the chart mentions ~₹ 480-490 as a broader resistance.
⚠️ Important Notes
These levels are estimates only—price can move outside these zones especially on news or macro surprises.
Use this as part of broader strategy (volume, trend, risk management) rather than relying solely on the levels.
Because the stock just bounced strongly, the risk of a short-term pullback to support is present.
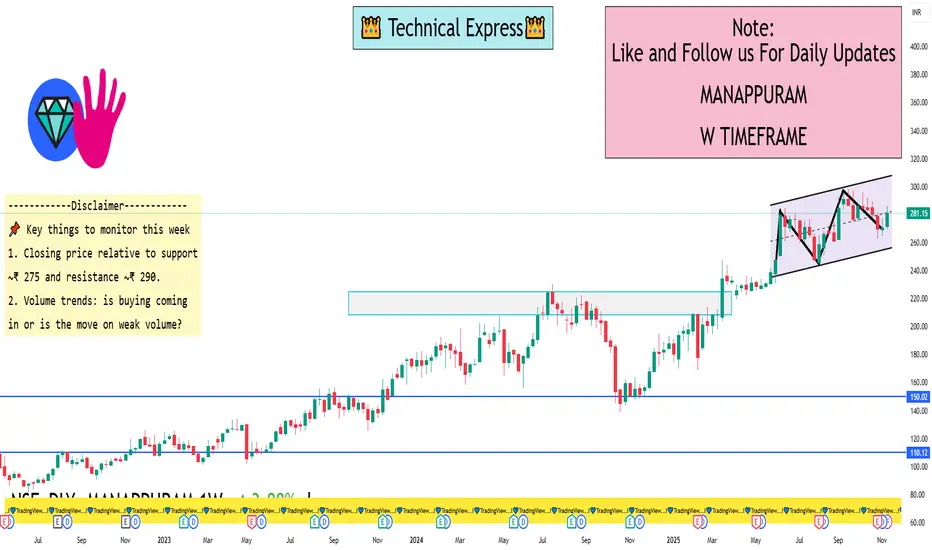
MANAPPURAM 1 Week View✅ Current state & context
The stock is trading around ₹ 281.15 as of 14 Nov 2025.
Recent technical scan shows a “Buy” to “Strong Buy” rating in the 1-week horizon via trading-view style indicators.
From the weekly performance note: the 20-day moving average crossover appeared recently, which historically has seen a ~3.9% average gain in ~7 days (on this stock) when that signal appears.
On the fundamental side, the stock is trading at relatively high valuations (P/E ~ 50+ times) and has seen significant price appreciation in recent months.
🎯 Key support & resistance levels for the next week
From the recent price action and technical indicators:
Support zones to watch
Near the recent swing low / consolidation area around ₹ 270-275. If price pulls back, this zone could act as first buffer.
Next deeper support around ₹ 260-265, which might catch if a stronger correction shows up.
Resistance zones to watch
Immediate resistance around the recent high ~ ₹ 290-295 (given the 52-week high is ~₹ 298).
If momentum continues, a break above ~₹ 300 might open further upside, but that would require strong volume and favourable catalyst.
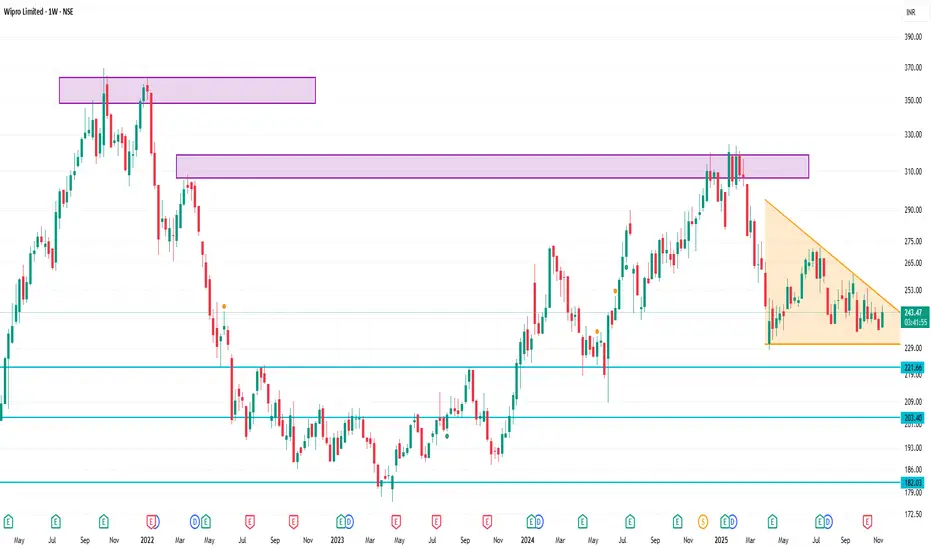
WIPRO 1 Week Time Frame🔍 Key levels
Current price (approx): ₹ 236.49.
Recent weekly low zone / support: around ₹ 235–238. (Recent lows noted ~₹ 236.00)
Near-term resistance / recent highs: around ₹ 243–245.
Technical sentiment: The 1-week technical rating from one source shows a “Sell” bias.
🎯 Implication for the next week
If WIPRO holds above the support ~₹235-238, it could attempt a bounce toward ~₹243-245.
If support breaks below ~₹235, next downside risk could open up (so watch for a break).
Because sentiment is weak (Sell bias), expect any rebound to be modest unless strong catalyst appears.