BEL Triangle & Flag BreakoutBEL is attempting breakout from Triangle and Bull Flag Pattern on 1D timeframe. Watch for closing at End of the Day. Watch for Earnings because this stock carries earnings risk.
Chart Patterns

AI & Technology Sector LeadershipNavigating Innovation, Strategy, and Global Impact
The Artificial Intelligence (AI) and broader technology sectors have become pivotal drivers of the global economy, reshaping industries, markets, and societies. Leadership within this domain is not simply about managing companies; it requires a visionary approach, combining technological expertise, strategic foresight, and an understanding of societal impact. Effective leadership in AI and technology is thus characterized by the ability to navigate rapid innovation, drive sustainable growth, and maintain ethical stewardship over emerging technologies.
1. The Landscape of AI & Technology
The AI and technology sector is remarkably diverse, encompassing areas such as software development, cloud computing, machine learning, robotics, semiconductors, cybersecurity, and more recently, generative AI and quantum computing. The sector’s growth trajectory has been exponential, fueled by data proliferation, advances in computing power, and evolving consumer behavior. According to industry reports, AI alone is expected to contribute trillions to the global economy over the next decade, with applications ranging from autonomous vehicles and precision medicine to personalized marketing and predictive analytics.
This rapid expansion places unique demands on leadership. Unlike traditional industries, technology leaders must contend with disruption as a constant, where yesterday’s innovation quickly becomes obsolete. Successful leaders are those who can anticipate trends, align their organizations with emerging opportunities, and foster a culture of continuous learning and adaptability.
2. Core Traits of Technology Sector Leaders
Leadership in the AI and technology space is defined by several core traits:
a. Visionary Thinking: Technology leaders must envision the future impact of their innovations. For instance, AI leaders are not merely focused on developing algorithms; they must understand how these solutions reshape industries, improve efficiency, and enhance human experiences. Visionary leadership entails strategic foresight, the ability to identify trends, and the courage to pursue transformative projects even amidst uncertainty.
b. Technical Acumen: While leadership encompasses more than technical expertise, understanding the technological underpinnings of one’s business is critical. Leaders must grasp AI architectures, cloud systems, cybersecurity frameworks, or software development processes to make informed strategic decisions, allocate resources efficiently, and guide teams effectively.
c. Agility and Adaptability: The pace of technological change demands leaders who can pivot quickly. Organizations led by adaptive leaders can respond to disruptive innovations, emerging competitors, and shifting regulatory landscapes. Agility also extends to workforce management, ensuring that talent development, recruitment, and reskilling initiatives keep pace with evolving technological demands.
d. Ethical and Responsible Leadership: With AI and technology increasingly influencing society, ethical considerations are central to leadership. Leaders must navigate issues such as data privacy, algorithmic bias, environmental sustainability, and the societal impact of automation. Ethical stewardship enhances public trust, mitigates reputational risks, and aligns technology deployment with human-centered values.
e. Collaborative and Inclusive Leadership: Innovation rarely occurs in isolation. Leaders must foster collaborative environments where cross-functional teams, diverse perspectives, and open communication drive creativity. Inclusivity in hiring, team management, and product development ensures that solutions are equitable and resonate across diverse markets.
3. Strategic Pillars of Leadership in AI & Technology
a. Innovation Management: At the core of technology leadership is the ability to manage and scale innovation. This involves identifying promising research areas, funding exploratory projects, and maintaining a balance between short-term returns and long-term breakthroughs. Companies like Google, Microsoft, and Tesla exemplify how strategic investment in R&D fuels competitive advantage.
b. Talent Acquisition and Development: Human capital is the lifeblood of AI and technology companies. Leaders must attract top engineers, data scientists, and researchers while fostering a culture of continuous learning. Initiatives such as hackathons, mentorship programs, and partnerships with academic institutions enable the cultivation of skills that align with future technological trends.
c. Market and Competitive Strategy: Successful leaders must translate technological capability into market advantage. This includes understanding customer needs, differentiating products, and leveraging partnerships or acquisitions to expand technological capabilities. Strategic decisions in AI, for example, may involve whether to focus on enterprise applications, consumer-facing solutions, or industry-specific platforms.
d. Regulatory and Policy Navigation: AI and technology sectors operate under increasing regulatory scrutiny. Leaders must proactively engage with policymakers, comply with evolving regulations, and anticipate geopolitical implications of technology deployment. Cybersecurity, data governance, and AI safety regulations require a proactive approach to risk management and corporate responsibility.
4. Case Studies in Leadership
a. Sundar Pichai – Alphabet Inc.: Under Pichai’s leadership, Alphabet has maintained dominance in AI and cloud computing while expanding into new arenas such as autonomous vehicles and quantum computing. Pichai exemplifies a balance of technical understanding, visionary strategy, and global market navigation.
b. Satya Nadella – Microsoft: Nadella’s tenure is a testament to transformative leadership. By pivoting Microsoft toward cloud computing, AI, and enterprise solutions, he revitalized the company’s growth trajectory. Nadella emphasized culture, collaboration, and inclusivity, demonstrating that technological leadership is inseparable from organizational culture.
c. Jensen Huang – NVIDIA: Huang has led NVIDIA to become a global leader in AI hardware, leveraging GPU technology to drive advances in machine learning. His focus on innovation, market foresight, and ecosystem-building underscores the importance of aligning technological capability with strategic market positioning.
5. Challenges and Future Directions
a. Rapid Technological Change: Leaders must continuously monitor emerging technologies and assess their relevance. From AI generative models to quantum computing, staying ahead of technological curves is a constant challenge.
b. Ethical Dilemmas: As AI systems influence decision-making in finance, healthcare, and law enforcement, leaders face heightened scrutiny over fairness, transparency, and accountability. Navigating these ethical dilemmas is increasingly central to leadership effectiveness.
c. Global Competition and Geopolitics: Technology leadership is also shaped by international dynamics. Trade restrictions, intellectual property disputes, and differing regulatory frameworks require leaders to adopt globally informed strategies.
d. Workforce Evolution: Automation and AI are reshaping job roles, creating opportunities and displacing traditional functions. Leaders must manage workforce transitions, reskill employees, and foster a culture that embraces change.
6. The Role of AI in Leadership Itself
Interestingly, AI is also transforming leadership practices. AI-driven analytics and predictive models enhance decision-making, optimize operations, and improve customer insights. Leaders who leverage AI for strategic foresight, risk management, and organizational efficiency gain a competitive advantage. However, reliance on AI also requires caution to avoid overdependence on algorithms at the expense of human judgment and ethical considerations.
7. Conclusion
Leadership in the AI and technology sector is multidimensional, combining vision, technical expertise, ethical stewardship, and strategic agility. It is not simply about producing innovative products but shaping the trajectory of industries and societies. Leaders must navigate rapid technological change, global competition, regulatory complexities, and ethical dilemmas while fostering inclusive and innovative organizational cultures.
The future of AI and technology leadership will increasingly demand a synthesis of human and artificial intelligence capabilities, where leaders not only leverage technological tools but also ensure that their applications align with societal values and global progress. Those who can balance innovation with responsibility, agility with strategy, and technical insight with ethical foresight will define the next era of technological advancement, driving growth, transformation, and sustainable impact worldwide.

Geopolitical Risk PremiumsUnderstanding the Concept and Its Market Implications
In global financial markets, the notion of risk is central to how investors price assets, allocate capital, and manage portfolios. Among the different forms of risk, geopolitical risk has become increasingly significant in the 21st century, as globalization, interconnected economies, and rapid information flows amplify the impact of political events on financial markets. The concept of a geopolitical risk premium refers to the additional return investors demand for holding assets that are exposed to uncertainties arising from political, military, or social instability across countries or regions.
At its core, the geopolitical risk premium represents compensation for potential negative outcomes stemming from events such as wars, terrorist attacks, political upheavals, trade disputes, sanctions, or abrupt policy changes. Unlike traditional financial risks, which are often quantifiable using historical data, geopolitical risks are inherently uncertain, discontinuous, and asymmetric, making the estimation of a risk premium both complex and subjective.
The Mechanism of Geopolitical Risk Premiums
Financial theory suggests that the expected return on an asset reflects not only the risk-free rate of return and market-wide risks but also idiosyncratic risks specific to that asset or region. Geopolitical events can introduce shocks that disrupt cash flows, trade, supply chains, or economic growth. As a result, investors demand a premium—essentially a cushion for potential losses—when investing in environments where such risks are prevalent.
For example, consider an investor evaluating bonds issued by a country with a history of political instability. Even if the bonds offer a higher yield relative to a stable country, the investor must assess the likelihood of default, currency devaluation, or capital controls triggered by political events. The additional yield above the normal market rate compensating for these uncertainties constitutes the geopolitical risk premium.
Factors Driving Geopolitical Risk Premiums
Political Stability and Governance: Countries with weak institutions, frequent government changes, corruption, or opaque policymaking tend to have higher geopolitical risk premiums. Investors perceive that sudden policy shifts, regulatory changes, or mismanagement could adversely impact investments.
Military Tensions and Conflicts: Wars, armed conflicts, or regional tensions create immediate and sometimes long-lasting disruptions to trade, energy supplies, and markets. For instance, heightened tensions in the Middle East often lead to spikes in oil prices, reflecting a premium priced by markets for geopolitical uncertainty.
Economic Sanctions and Trade Disputes: Sanctions imposed by one country on another, or protracted trade disputes, can significantly affect corporate profits and currency values. Investors factor these risks into asset pricing, demanding higher returns for exposure to affected regions.
Terrorism and Civil Unrest: Beyond formal military conflicts, terrorism, insurgencies, and civil unrest can damage infrastructure, reduce investor confidence, and impair economic growth. Markets respond by incorporating a risk premium for affected assets.
Resource and Energy Dependence: Countries heavily reliant on commodities or energy exports may experience higher geopolitical risk premiums. Political instability or conflict in resource-rich regions can disrupt global supply chains, influencing asset prices far beyond local borders.
Globalization and Contagion Effects: In an interconnected world, geopolitical events rarely remain isolated. An attack or policy change in one region can have ripple effects on global markets, magnifying the perceived risk and inflating the geopolitical risk premium.
Measurement of Geopolitical Risk Premiums
Unlike interest rate or credit risk premiums, which can be measured relatively directly, geopolitical risk premiums are derived indirectly through market pricing. Several approaches exist:
Bond Yield Spreads: Sovereign bonds issued by politically unstable countries often carry higher yields relative to similar-maturity bonds from stable nations. The excess yield can be interpreted as a geopolitical risk premium.
Equity Market Volatility: In periods of heightened geopolitical tension, equity markets typically experience increased volatility. Analysts may estimate the risk premium embedded in stock prices by comparing expected returns during calm periods versus times of uncertainty.
Commodity Price Spikes: Commodities like oil, gold, and precious metals are highly sensitive to geopolitical events. Price surges in these markets often reflect a risk premium for potential supply disruptions due to conflicts, sanctions, or political unrest.
Currency Fluctuations: Emerging market currencies are particularly susceptible to geopolitical shocks. A depreciating currency during periods of tension implies a higher required return for investors holding assets denominated in that currency.
Geopolitical Risk Indices: Academic and commercial entities, such as the Baker, Bloom, and Davis Geopolitical Risk Index (GPR), quantify geopolitical risk based on the frequency of news articles mentioning conflicts, terrorism, and international tensions. These indices can be correlated with asset returns to approximate the risk premium demanded by investors.
Implications for Financial Markets
Geopolitical risk premiums influence nearly every segment of financial markets, from equities and bonds to currencies and derivatives. The key implications include:
Capital Allocation: Investors may shift capital toward safer assets or regions with lower geopolitical risk, creating a "flight to safety." This can lead to increased demand for government bonds of stable economies and a temporary decline in emerging market investment.
Asset Pricing Volatility: Geopolitical events tend to induce sharp, sudden market reactions. Risk premiums fluctuate rapidly in response to news, making pricing more sensitive and increasing overall market volatility.
Portfolio Diversification: To manage geopolitical risk, investors often diversify across countries, sectors, and asset classes. However, systemic geopolitical events, such as global conflicts or major trade wars, can reduce the effectiveness of traditional diversification strategies.
Impact on Risk Models: Standard financial models often assume normal market conditions and historical correlations. Geopolitical events can invalidate these assumptions, resulting in underestimation of risk unless a geopolitical risk premium is explicitly incorporated.
Policy and Central Bank Response: Central banks and governments may intervene in markets to stabilize financial conditions during periods of heightened geopolitical risk. Such interventions can temporarily alter risk premiums and market dynamics.
Challenges in Managing Geopolitical Risk Premiums
While investors recognize the importance of geopolitical risk, accurately quantifying and managing it is challenging:
Unpredictability: Geopolitical events are often sudden and extreme. Unlike economic indicators, they cannot be forecasted reliably using historical trends alone.
Complex Interconnections: Events in one region may affect multiple countries and markets, making the assessment of the total risk premium difficult.
Behavioral Biases: Investor sentiment can exaggerate perceived risk, leading to temporary overshooting of premiums during crises.
Hedging Limitations: Instruments like options, futures, or insurance policies may provide partial protection but rarely eliminate geopolitical risk completely.
Examples of Geopolitical Risk Premiums in Action
Middle East Conflicts and Oil Prices: Tensions in the Strait of Hormuz or conflicts in oil-rich countries often trigger sudden spikes in crude prices, reflecting a risk premium for potential supply disruption.
Brexit and European Markets: The uncertainty surrounding the UK’s exit from the EU led to higher risk premiums for UK assets, including government bonds and equities, as investors demanded compensation for policy and market uncertainty.
Russia-Ukraine Conflict (2022 Onwards): Global markets priced in significant risk premiums due to sanctions, disrupted energy supplies, and economic fallout, affecting commodity prices, equities, and sovereign bonds worldwide.
Conclusion
The geopolitical risk premium is a crucial component of asset pricing in a globally connected economy. It represents the compensation investors require for bearing risks stemming from political instability, military conflicts, terrorism, trade disputes, and policy uncertainty. While difficult to quantify precisely, geopolitical risk premiums influence capital flows, asset prices, and portfolio strategies across markets. Understanding and monitoring these premiums is vital for investors seeking to navigate the uncertainties of global finance, manage risk exposure, and optimize returns in an increasingly complex geopolitical landscape.
By acknowledging both the magnitude and unpredictability of geopolitical events, financial professionals can make more informed decisions, incorporate appropriate risk-adjusted pricing, and better anticipate market reactions in times of political turmoil. In essence, geopolitical risk premiums are not just an abstract concept—they are a real, measurable, and actionable factor shaping the modern financial ecosystem.

Kiwi Analysis: Bullish ContinuationThe NZD/USD has exhibited strong bullish momentum over the last few days, successfully climbing out of the 0.5980 consolidation zone. We are currently seeing a classic technical setup: the Break and Retest of a key structural level.

Fiscal Policy Risk and Its Impact on Debt Markets1. Understanding Fiscal Policy Risk
Fiscal policy risk refers to the uncertainty that arises from government budgetary actions, particularly when those actions impact the broader economy and financial markets. It is associated with the possibility that fiscal decisions—such as changes in tax rates, spending programs, or public debt issuance—may have unintended consequences on economic stability, inflation, and investor confidence.
Key elements of fiscal policy risk include:
Budget Deficits and Surpluses: When a government spends more than it collects in revenue, it runs a budget deficit, often financed through borrowing. Persistent deficits can raise concerns about fiscal sustainability, potentially leading to higher interest rates on government bonds. Conversely, surpluses may reduce borrowing needs, positively impacting debt markets.
Public Debt Levels: High levels of government debt relative to GDP can create risk perceptions among investors. Large debt stocks increase the likelihood of fiscal stress, which can lead to credit rating downgrades, rising borrowing costs, and lower demand for sovereign bonds.
Policy Uncertainty: Uncertainty about future fiscal measures—such as potential tax hikes, spending cuts, or structural reforms—can deter investment and destabilize markets. Unclear or inconsistent policy can increase volatility in debt markets.
Structural Imbalances: Fiscal policies that fail to address structural economic weaknesses, such as inefficient subsidies, high social welfare spending, or poorly targeted tax systems, can amplify risks over time. Markets often respond to these imbalances by demanding higher yields on government securities.
2. Debt Markets: An Overview
Debt markets, also known as bond markets, are platforms where governments, corporations, and financial institutions issue debt securities to raise capital. These markets are critical for economic functioning, as they provide governments with financing for infrastructure, social programs, and other initiatives.
Key components of debt markets include:
Government Bonds: Issued by central governments to fund deficits and manage liquidity. They are generally considered low-risk investments, particularly in stable economies.
Corporate Bonds: Issued by corporations to finance expansion, operations, or refinancing existing debt. Risk levels vary based on the issuer’s creditworthiness.
Municipal Bonds: Issued by local governments to fund public projects. Risk is influenced by the local government's financial health.
Sovereign Debt in Emerging Markets: Often carries higher risk due to political instability, currency fluctuations, and weaker fiscal frameworks.
Interest rates, inflation expectations, credit ratings, and global capital flows heavily influence debt markets. Fiscal policy plays a crucial role in shaping all these factors.
3. Interaction Between Fiscal Policy and Debt Markets
The relationship between fiscal policy and debt markets is complex and multidimensional. Changes in fiscal policy directly affect the supply of government debt, investor perceptions of risk, and the overall interest rate environment.
Impact on Interest Rates:
When governments increase borrowing to finance deficits, the supply of bonds in the market rises. If demand does not keep pace, bond prices fall, and yields rise.
Conversely, a reduction in borrowing or fiscal consolidation can lower interest rates by reducing supply pressures.
Influence on Inflation Expectations:
Expansionary fiscal policy, characterized by high spending or tax cuts, can stimulate economic growth but may also lead to higher inflation if the economy is near full capacity.
Higher expected inflation erodes the real returns on fixed-income securities, prompting investors to demand higher yields.
Tight fiscal policies, on the other hand, may ease inflationary pressures, stabilizing bond markets.
Credit Ratings and Market Perception:
Credit rating agencies evaluate a country’s fiscal position, including debt-to-GDP ratios, budget deficits, and debt servicing capacity.
A deteriorating fiscal position can lead to downgrades, increasing borrowing costs and reducing demand for government bonds.
Investors closely monitor fiscal sustainability as a measure of default risk.
Crowding Out Effect:
Large-scale government borrowing can absorb financial resources that might otherwise flow into private investment.
This “crowding out” can push up interest rates in broader debt markets, affecting corporate financing costs.
Market Volatility and Investor Confidence:
Sudden or unexpected fiscal measures, such as emergency spending or tax reforms, can create uncertainty and volatility in debt markets.
Transparent and credible fiscal policy frameworks tend to reduce risk premiums demanded by investors.
4. Types of Fiscal Policy Risk Affecting Debt Markets
Sovereign Risk:
This is the risk that a government may default on its debt obligations.
High debt levels, fiscal mismanagement, and political instability increase sovereign risk, leading to higher yields and lower bond prices.
Inflation Risk:
Expansionary fiscal policy can fuel inflation, which erodes the purchasing power of fixed-income returns.
Inflation-indexed bonds or higher yields often compensate investors for this risk.
Interest Rate Risk:
Fiscal deficits often prompt central banks to adjust monetary policy to control inflation, indirectly influencing interest rates.
Rising interest rates reduce the value of existing bonds, especially long-duration securities.
Liquidity Risk:
Fiscal uncertainty can make government bonds less liquid, especially in emerging markets where investor confidence is fragile.
Political and Policy Risk:
Policy changes stemming from elections, regime shifts, or coalition governments can introduce unpredictability.
Investors often demand a premium for exposure to countries with unstable fiscal policy environments.
5. Managing Fiscal Policy Risk in Debt Markets
Governments and investors adopt several strategies to mitigate fiscal policy risks:
For Governments:
Maintaining sustainable debt levels relative to GDP.
Implementing credible fiscal rules, such as limits on deficits or debt growth.
Enhancing transparency in budget formulation and debt management.
Using debt instruments with staggered maturities to manage refinancing risks.
For Investors:
Diversifying portfolios across countries and asset classes.
Monitoring fiscal indicators like debt-to-GDP ratios, budget deficits, and contingent liabilities.
Hedging interest rate and currency risks using derivatives.
Investing in inflation-protected securities to offset potential erosion in returns.
6. Global Perspectives and Recent Trends
In the wake of crises such as the COVID-19 pandemic, fiscal policy has become even more central to debt market dynamics. Governments around the world increased spending dramatically, leading to elevated deficits and debt levels. This expansionary fiscal stance caused varying responses in debt markets:
In developed markets, strong institutions and high investor confidence kept borrowing costs relatively low despite rising debt.
In emerging markets, increased borrowing and fiscal imbalances often resulted in higher yields and capital outflows, reflecting heightened fiscal policy risk.
Additionally, global investors now closely monitor sovereign fiscal health as part of risk assessment for emerging markets. Ratings agencies, economic think tanks, and international organizations provide guidance on fiscal sustainability, directly influencing capital flows into debt markets.
7. Conclusion
Fiscal policy risk is a critical determinant of debt market performance. Government decisions regarding spending, taxation, and borrowing influence interest rates, inflation expectations, and investor confidence. For debt markets, both in developed and emerging economies, fiscal sustainability, transparency, and credibility are essential for stable bond yields and efficient capital allocation.
Understanding fiscal policy risk requires analyzing macroeconomic indicators, debt levels, political dynamics, and global economic trends. Investors must remain vigilant to fiscal developments, while governments must manage policy choices carefully to avoid adverse market reactions. Ultimately, the interplay between fiscal policy and debt markets underscores the delicate balance between economic growth objectives and financial stability.

gold spot or mcx update after fresh breakoutgold spot eyes on 5200$ if mkt close abv than next up side move 5400-5800$ near terms where support 5230 if stay blow than down side expect 5210--5190--5170$ over all looks boom but profit booking expect . mcx gold April looks abv 173000 up side move 177-185000+++ where support 169000 if stay bleow than down side correction expect til 165--161000+++ no if and but.
yes a;; eyes on support lvl if mkt hold thna no doubt to up side buy on dip good way

Interest Rates and Central Bank PolicyIntroduction
Interest rates are a cornerstone of modern economies, influencing borrowing, spending, saving, and investment behavior across households, businesses, and governments. They represent the cost of borrowing money or the return for lending it. Central banks—such as the Federal Reserve in the United States, the Reserve Bank of India, or the European Central Bank—play a critical role in determining the level of interest rates through monetary policy. By influencing interest rates, central banks aim to achieve macroeconomic objectives, including price stability, full employment, and sustainable economic growth. Understanding how interest rates work and how central bank policies shape them is fundamental for investors, businesses, and policymakers alike.
Understanding Interest Rates
1. Types of Interest Rates
Interest rates can take several forms, each with specific functions in the economy:
Policy or Benchmark Rates: These are set by central banks and serve as a reference for other interest rates in the economy. For example, the federal funds rate in the U.S. or the repo rate in India.
Market Rates: These are determined by supply and demand in financial markets. Examples include interbank lending rates and bond yields.
Consumer Rates: These affect individuals directly, including mortgage rates, personal loans, and credit card interest rates.
Corporate Rates: Businesses borrow at rates that reflect risk, collateral, and creditworthiness, influenced by policy and market rates.
2. Nominal vs Real Interest Rates
Nominal Interest Rate: The stated rate without adjusting for inflation.
Real Interest Rate: Nominal rate minus inflation. Real rates measure the true cost of borrowing or the real return on savings and investment.
3. Influence on Economic Behavior
Interest rates affect the economy in multiple ways:
Consumption: Lower interest rates reduce the cost of loans, encouraging consumers to borrow and spend. Higher rates do the opposite.
Investment: Businesses are more likely to invest in capital projects when borrowing costs are low. High rates may delay expansion.
Saving: Higher interest rates incentivize saving, while lower rates encourage spending.
Currency Value: Higher domestic interest rates can attract foreign capital, strengthening the currency. Conversely, lower rates may weaken the currency.
Central Bank Policy
Central banks are responsible for managing a country’s monetary system. Their primary tools and objectives are designed to maintain economic stability, control inflation, and support growth.
1. Objectives of Central Bank Policy
Price Stability: Controlling inflation is the primary goal of most central banks. Moderate and predictable inflation supports economic confidence.
Economic Growth and Employment: By adjusting interest rates and money supply, central banks aim to promote sustainable growth and reduce unemployment.
Financial Stability: Preventing financial crises through regulation, liquidity provision, and supervision of banks and financial institutions.
Currency Stability: Maintaining the value of the domestic currency in international markets, often tied to trade and capital flows.
2. Tools of Monetary Policy
Central banks use a combination of conventional and unconventional tools:
Policy Rates:
Repo Rate (Repurchase Rate): The rate at which commercial banks borrow short-term funds from the central bank. Lower repo rates encourage lending and spending; higher rates curb inflation.
Reverse Repo Rate: The rate at which banks park excess funds with the central bank. Used to control liquidity.
Discount Rate / Federal Funds Rate: Key U.S. benchmark, influencing borrowing costs across the economy.
Open Market Operations (OMO): Central banks buy or sell government securities to influence the money supply. Buying securities injects liquidity, lowering interest rates; selling withdraws liquidity, raising rates.
Reserve Requirements: The minimum fraction of deposits that banks must keep as reserves. Lowering reserve requirements increases lending capacity; raising them restricts credit.
Forward Guidance: Communicating future monetary policy intentions to influence expectations and market behavior.
Quantitative Easing (QE): Unconventional policy used during crises, where central banks purchase large amounts of government or corporate bonds to lower long-term interest rates and stimulate borrowing.
Interest Rate Transmission Mechanism
The transmission of central bank policy through the economy involves several channels:
Bank Lending Channel: Lower policy rates reduce banks’ funding costs, encouraging more loans to businesses and households.
Asset Price Channel: Lower rates raise stock and bond prices, boosting wealth and consumption.
Exchange Rate Channel: Lower rates may depreciate the currency, increasing exports by making domestic goods cheaper internationally.
Expectations Channel: Central bank guidance shapes public and business expectations about future inflation, spending, and investment.
Types of Monetary Policy
Central banks implement monetary policy based on prevailing economic conditions:
Expansionary Policy: Lowering interest rates or increasing money supply to stimulate growth, typically used during recessions or slowdowns.
Contractionary Policy: Raising interest rates or reducing liquidity to control inflation or an overheating economy.
For example, during a recession, a central bank may cut policy rates and purchase government securities to encourage borrowing and spending. Conversely, in high inflation periods, tightening policy through higher rates reduces consumption and cooling inflation pressures.
Global Implications
Interest rates are not only domestic policy tools; they have international consequences:
Capital Flows: Higher domestic rates attract foreign investment, impacting exchange rates and balance of payments.
Global Borrowing Costs: Countries with debt denominated in foreign currencies are affected by rate changes in major economies like the U.S.
Commodity Prices: Changes in rates affect commodity prices indirectly by altering demand and currency values.
Financial Markets: Equity and bond markets react sensitively to central bank announcements, often leading to volatility around policy decisions.
Challenges and Considerations
Central banks face numerous challenges in setting interest rates:
Inflation vs Growth Trade-Off: Aggressive rate hikes control inflation but may slow growth; low rates boost growth but risk higher inflation.
Lagged Effects: Monetary policy effects take time to permeate the economy, sometimes 6–18 months.
Global Integration: International capital flows and foreign monetary policies constrain domestic policy autonomy.
Expectations Management: Public confidence in central bank credibility is crucial. Poor communication can lead to volatility in markets and consumer behavior.
Recent Trends
In the past decade, central banks have faced low-interest-rate environments post-global financial crises, requiring unconventional measures like QE and forward guidance. Inflation surges following supply chain disruptions and geopolitical tensions have prompted rapid interest rate adjustments, demonstrating the dynamic interplay between policy and economic realities.
Conclusion
Interest rates and central bank policies are vital levers for guiding economic activity. They affect borrowing, spending, saving, investment, and currency values, influencing both domestic and global economic landscapes. By using tools like policy rates, open market operations, and unconventional interventions, central banks seek to balance growth, employment, and inflation. Understanding these mechanisms helps investors, businesses, and individuals make informed decisions, as interest rates ultimately shape the rhythm of economic life.
Effective central bank policy requires not only technical skill but also careful attention to timing, communication, and the broader global context. With economies increasingly interconnected, the ripple effects of interest rate decisions extend far beyond national borders, making central bank actions a focal point for both policymakers and markets worldwide.

TATAELXSI 1 Week View 📊 Current context
The stock price is in the range of around ₹5,350–₹5,450 (as of last close).
📈 1‑Week Technical Levels
These are typical support/resistance values used by short‑term traders (daily/weekly pivots & swing levels):
🧭 Weekly Support
1. ~₹5,270–₹5,280 — first major weekly support zone.
2. ~₹5,106–₹5,110 — secondary support before lower breakdown risk.
3. ~₹4,700 area — strong downside zone (52‑week low area).
🚧 Weekly Resistance
1. ~₹5,618–₹5,620 — initial weekly resistance level.
2. ~₹5,950–₹6,000 — higher breakout zone for bullish momentum.
3. Above ₹6,300 — strong breakout continuation level.
These weekly levels are useful for planning trades across the next 5–7 sessions — gains above initial resistance suggest near‑term strength, while breaks below support indicate further weakness.
🔁 Daily Pivot Levels (for intraday / short swing)
Pivot Point: ~₹5,400–₹5,407
Support†: ~₹5,355 → ₹5,295 → ₹5,250
Resistance†: ~₹5,460 → ₹5,505 → ₹5,565 (higher targets)
These pivot levels help define day‑to‑day trading range within the week.

GBPUSD: Post-BOS Retest | Long Opportunity at Demand ZoneGBPUSD has shown a clear bullish character shift on the 1H timeframe. After a series of Break of Structure (BOS) moves to the upside, the price has created a fresh Demand Zone (Order Block) around the 1.37400-450 level.

SbinThe daily time frame chart shows that the price is bouncing from the trend line support. In the lower time frame, the price has formed a rounding bottom.
Buy above 1048 with the stop loss of 1040 for the targets 1054, 1060, 1068 and 1076.
A rounding bottom pattern can form a candle if it has a pullback. At the same time, in the daily chart, the price should hold the trend line support.
Always do your analysis before taking any trade.

LUPIN 1 Day View 📊 Current Market Snapshot (Latest Available Close)
Price: ~₹2,137.20 (NSE) — price range on the most recent session was ₹2,130.30–₹2,178.00.
Previous Close: ₹2,163.20.
52‑week range: ₹1,795.20 low ~ ₹2,226.30 high.
📈 Daily Pivot & Key Levels (Short‑Term Technical)
🔁 Pivot (Reference Level)
Pivot point: ~₹2,166–₹2,160 zone — this is the central level that often defines bull/bear bias intraday.
🔼 Resistance (Upside Levels)
R1: ~₹2,185–₹2,189 — immediate upside barrier.
R2: ~₹2,206–₹2,208 — next medium resistance.
R3: ~₹2,227–₹2,238 — stronger resistance zone (intraday to short‑term).
🔽 Support (Downside Levels)
S1: ~₹2,143–₹2,119 — initial support from recent pivot structures.
S2: ~₹2,124–₹2,100 — mid downside support.
S3: ~₹2,102–₹2,071 — deeper support if bearish momentum accelerates.
🧠 How to Use These Levels Today
Bullish view: Stay above pivot (~₹2,160–₹2,166) for upside bias toward R1→R2.
Neutral/Range: Between S1 and R1 suggests consolidation — trade bounces within this zone.
Bearish breakdown: A close below S2/S3 can indicate deeper correction — watch S2 as key risk cutoff.
(These are not buy/sell recommendations, just short‑term technical reference points.)

XAUUSD (Gold) 45-Minute Chart – Strong Bullish Continuation AbovTrend:
Gold is in a clear bullish trend. Price has made higher highs and higher lows, accelerating strongly on Jan 28 with a breakout and momentum expansion.
Market Structure:
Earlier consolidation zones (value areas) were broken to the upside, followed by acceptance above prior ranges.
The most recent move shows impulsive buying, suggesting institutional participation rather than a weak breakout.
Volume Profile (VCP):
Previous High Volume Nodes (HVN) around 5,080–5,120 acted as resistance, now flipped into support.
Current price is trading above the Point of Control (POC), which confirms bullish control.
Low volume above indicates price discovery, meaning less resistance overhead.
Key Levels:
Resistance: 5,270–5,300 (current highs / psychological zone)
Immediate Support: 5,120–5,100 (previous value area high)
Deeper Support: 5,020–4,980 (range low & demand zone)
Bias:
Bullish while above 5,100
Pullbacks into previous value areas are likely to attract buyers.
Trading Insight:
Best opportunities are buy-the-dip setups rather than chasing highs.
A rejection with high volume below 5,100 would be the first warning sign of a deeper correction.

HINDZINC 1 Month View 📊 Current Price Context (as of late Jan 28, 2026)
Stock is trading near its recent highs around ₹720–₹730 on NSE.
📈 1-Month Key Levels (Support & Resistance)
🔁 Major Resistance Levels
1. ~₹730–₹735 — Immediate resistance around recent highs/upper range of the month (where price struggled on breakout)
2. ~₹750 — Psychological resistance zone above current levels (weekly/medium term trend)
3. ~₹770–₹780+ — Extended upside if breakout sustains (higher supply zone)
(Break above ~₹735 with strong volume can open room toward these higher targets.)
🔽 Immediate Support Levels
1. ~₹695–₹700 — First support pivot zone (near recent consolidation low)
2. ~₹675–₹680 — Next technical support from pivot and short-term averages
3. ~₹650–₹660 — Stronger 1-month base support if the stock pulls back further
4. ~₹620–₹630 — Major support zone if broader weakness emerges (coincides with longer moving averages)
📊 Moving Average Context
The 20/50/100/200-day SMAs/EMAs are generally positioned below the current price, showing positive slope — often interpreted as bullish momentum on the medium-term charts.
📌 Interpretation / Range Estimate (1-Month)
Based on recent trading dynamics and pivot analysis, a reasonable 1-month trading range could be approximately:
Bullish Scenario: ₹735 → ₹770+
Bearish / Pullback Range: ₹700 → ₹650
This gives a sense of where the stock may find near-term resistance and support around the current price action.

GOLD Buy Pullbacks in Bullish TrendMarket Context (M30)
Gold continues to trade within a strong bullish continuation phase, holding firmly inside a well-defined ascending channel. Recent pullbacks are technical retracements for liquidity rebalancing, not signs of distribution or trend exhaustion.
On the macro side, persistent USD weakness, sustained safe-haven demand, and only modest Fed easing expectations keep the broader backdrop supportive for gold. This combination allows upside momentum to remain controlled and constructive rather than emotional.
➡️ Overall bias: Bullish – prioritize BUY setups aligned with the main trend.
Structure & Price Action
M30 structure remains intact with clear Higher Highs and Higher Lows.
Price continues to respect previous demand and key levels, confirming active buyer participation.
No bearish CHoCH has been confirmed.
The current leg is expanding toward higher Fibonacci extensions, reinforcing trend continuation.
Key insight:
👉 As long as structure holds, pullbacks represent opportunity — not risk.
Trading Plan – MMF Style
Primary Scenario – Trend-Following BUY
Focus on patience and execution at discounted levels, not chasing price at extensions.
BUY Zone 1: 5,185 – 5,170
(Short-term demand + channel support)
BUY Zone 2: 5,106 – 5,085
(Key level confluence + trendline support)
➡️ Execute BUYs only after clear bullish reaction and structure confirmation.
➡️ Avoid FOMO at extended highs.
Upside Targets:
TP1: 5,250
TP2: 5,309 (Next ATH extension zone)
Alternative Scenario
If price holds firmly above 5,250 without a meaningful pullback, wait for a break & retest before looking for continuation BUYs.
Invalidation
A confirmed M30 close below 5,044 would weaken the current bullish structure and require reassessment.
Summary
Gold remains in a controlled bullish expansion, driven by structure and macro flow. The edge is not calling the top, but buying pullbacks within demand while the trend remains intact. As long as structure holds, higher prices remain the path of least resistance.

AXISBANK 1 Month View📈 Current Context
As of late January 2026, Axis Bank’s stock is trading around ₹1,300 – ₹1,340 range amid strong recent earnings and price momentum.
📊 1-Month Key Levels (Daily/Short-Term Range)
🔼 Resistance (Upside)
1. ₹1,340 – ₹1,350 – Near recent high/resistance zone (short-term cap)
2. ₹1,355 – ₹1,365 – Next resistance cluster above recent highs
3. ₹1,370 + – Broader higher breakout zone if strong bullish continuation occurs
Note: Weekly/short weekly resistance zones are around ₹1,317-₹1,320 and then ₹1,340-₹1,350.
🔽 Support (Downside)
1. ₹1,280 – ₹1,285 – Immediate support near recent pivot lows
2. ₹1,270 – ₹1,275 – Secondary support zone tracked by moving averages
3. ₹1,260 – ₹1,265 – Broader channel support if price weakens further
🧭 Interpretation for a 1-Month View
Bullish scenario: A sustained break and close above ₹1,350 could extend momentum toward ₹1,365+ in the coming weeks.
Bearish scenario: A break below ₹1,270 might open the path toward ₹1,250 – ₹1,260 support cluster.
Neutral/Range: In sideways conditions, expect most trading between roughly ₹1,270 – ₹1,350.

HINDALCO 1 Month View 📌 Current Price Snapshot
Approximate recent price: ₹961–₹975 on NSE.
52-week range: ₹546.45 (low) to ~₹985 (high).
📊 1-Month Technical Levels (Support & Resistance)
🔁 Pivot & Balanced Level
Pivot Level: ~₹954 – ₹963 (central zone where trend bias often flips)
📈 Resistance Levels (Upside Barriers)
1. R1: ~₹959 – ₹960 — first key resistance above current pivot.
2. R2: ~₹969 – ₹970 — near recent short-term highs.
3. R3: ~₹975 – ₹980+ — upper resistance and psychological round number area.
💡 Above ~₹980: breakout build-up zone toward recent swing highs (~₹985).
📉 Support Levels (Downside Floors)
1. S1: ~₹944 – ₹945 — first major support zone.
2. S2: ~₹938 – ₹940 — next lower support within recent range.
3. S3: ~₹929 – ₹932 — deeper support if price slides further.
4. Lower structural zone: ~₹907 – ₹921 — broader support band from longer-term pivots.
📅 Trend & Market Context (1-Month)
Momentum: RSI around mid-60s suggesting moderately bullish momentum without being overbought.
Moving averages: Price trading above major short & mid-term averages (20/50 DMA), indicating bullish bias on the monthly view.
Volatility: ATR indicates normal volatility — not extreme swings.
Interpretation:
✔ Stays bullish above ~₹944–₹945 support.
✔ Upside can extend to ~₹969–₹980 if momentum persists.
⚠ A break below ~₹932 could signal deeper pullbacks toward ~₹907 area.

AWHCL - Clear Breakout with Volume SurgeAWHCL was forming falling wedge for the last 1 year and it now broke the resistance. Volume is huge which supports the breakout. Now the stock is retesting the resistance line before making a move up.
SL would be below 553.
This is not an investment advice

NIFTY KEY LEVELS FOR 28.01.2026NIFTY KEY LEVELS FOR 28.01.2026
Timeframe: 3 Minutes
If the candle stays above the pivot point, it is considered a bullish bias; if it remains below, it indicates a bearish bias. Price may reverse near Resistance 1 or Support 1. If it moves further, the next potential reversal zone is near Resistance 2 or Support 2. If these levels are also broken, we can expect the trend.
When a support or resistance level is broken, it often reverses its role; a broken resistance becomes the new support, and a broken support becomes the new resistance.
If the range(R2-S2) is narrow, the market may become volatile or trend strongly. If the range is wide, the market is more likely to remain sideways
please like and share my idea if you find it helpful
📢 Disclaimer
I am not a SEBI-registered financial adviser.
The information, views, and ideas shared here are purely for educational and informational purposes only. They are not intended as investment advice or a recommendation to buy, sell, or hold any financial instruments.
Please consult with your SEBI-registered financial advisor before making any trading or investment decisions.
Trading and investing in the stock market involves risk, and you should do your own research and analysis. You are solely responsible for any decisions made based on this research.

SILVER CAN FLY PAST 118 Silver is bullish across all timeframes and could soar past a daily close above 118.

Oil India | Daily | Structural BreakoutAfter months of consolidation, Oil India has broken above a key supply zone with strength.
This move signals a trend shift, provided price sustains above the breakout level.
🔍 Technical Highlights:
• Long base → strong expansion
• Horizontal resistance taken out
• Volume supports the breakout
📌 Status: Breakout done, retest awaited
👉 Strength on dips > chasing highs
⚠️ Educational view only. Not a buy/sell call.
#OilIndia #BreakoutStock #PriceAction #TechnicalAnalysis #IndianStocks #SwingTrading #TrendBreakout

SOLARIND 30% upside possible in next 6-8 Months.SOLARIND 30% upside possible in next 6-8 Months.
Fundamentals:
Company has reduced debt.
Company has delivered good profit growth of 35% CAGR over last 10 years.
Technicals:
Stock has been correcting from high of 17800 Since 7 Months.
Looks like the bottom should be formed near 11800-12500 region taking the stock back to last highs of 17800+
LTP - 13200
Target - 18000+
SL - 11500
Timeframe - 6-8 Months
Happy Investing.

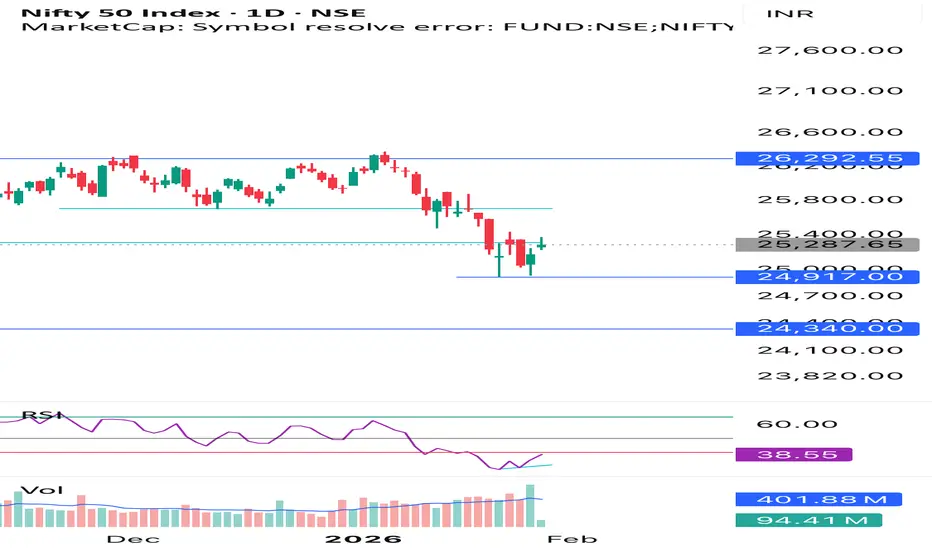
Nifty Base FormationNifty is forming at Good Base with small RSI divergence. A close above 40 RSI and 10 EMA in nifty may result in a new short term upward trend
XAUUSD - H1 Gold structurally bullishXAUUSD – H1 Gold remains structurally bullish near all-time highs| Lana ✨
Gold is extending its bullish momentum for a second consecutive session and continues to trade near all-time highs. Price action remains constructive, with the market holding above key structure while deciding between continuation or a deeper pullback into value.
📈 Market Structure & Trend Context
The short-term and medium-term structure remains bullish, with price respecting the ascending channel.
The recent push above previous highs confirms strong demand, but current price action also shows signs of consolidation near ATH.
This behavior is typical after an impulsive rally, where the market pauses to build acceptance or rebalance liquidity before the next directional move.
As long as price holds above the rising structure, the bullish thesis remains valid.
🔍 Key Technical Zones to Watch
ATH Reaction Zone: 5080 – 5110
This is a sensitive area where price may consolidate, fake out, or briefly reject before choosing direction.
Primary Pullback / Buy Zone: 5000 – 5020
A key structural level aligned with prior resistance-turned-support and the midline of the bullish channel.
Secondary Support (Deeper Pullback): 4920 – 4950
A stronger value area if volatility increases or liquidity is swept below the channel.
Upside Expansion Zone: 5180 – 5200+
If price accepts above ATH, this becomes the next upside objective within the channel.
🎯 Trading Scenarios (H1 Structure-Based)
Scenario 1 – Continuation Above ATH:
If price consolidates above 5080–5110 and shows acceptance, gold may extend toward 5180–5200. This scenario favors patience and confirmation rather than chasing immediate breakouts.
Scenario 2 – Pullback Into Structure (Preferred):
A pullback toward 5000–5020 would allow the market to rebalance liquidity and offer a higher-quality continuation setup. Holding this zone keeps the bullish structure intact.
Scenario 3 – Deeper Correction:
If price loses the primary support, the 4920–4950 zone becomes the next key area to watch for buyer response and trend defense.
🌍 Macro Context (Brief)
Gold continues to benefit from heightened geopolitical risks and ongoing trade uncertainty, reinforcing its role as a safe-haven asset.
At the same time, market attention is shifting toward the outcome of the two-day FOMC policy meeting on Wednesday, which may introduce volatility and short-term repricing.
This backdrop supports gold structurally, while also increasing the likelihood of sharp intraday swings around key levels.
🧠 Lana’s View
Gold remains bullish, but near ATH levels, discipline matters more than conviction.
Lana prefers buying pullbacks into structure, letting price confirm, and avoiding emotional trades during headline-driven volatility.
✨ Respect the structure, stay patient near the highs, and let the market come to your levels.
