GODREJ PROP: IN BUYING ZONE FOR 10% GAINGodrej Properties has completed its retracement in the weekly time frame. It has now shown strength in daily time frame a pivot low in the daily time frame. Bullish sentiment is also observed in the higher time frame It is suggested to buy NEAR 1910-15. Set stoploss if it closes below 1900 . Targets stoploss are given in the chart.
Chart Patterns

GBPNZD - Channel Boundaries in Play! What’s Next?The weekly chart of GBPNZD shows price action respecting an ascending channel structure. The pair has been moving within a well-defined ascending channel since early 2023.
GBPNZD weekly chart highlights price action within an ascending channel structure with key levels in play. Watch for bullish opportunities near the support zone at 2.1400–2.1800 or bearish continuation if price breaks below this zone. What’s your bias? Let me know in the comments! #GBPNZD #Forex #TechnicalAnalysis
Disclaimer:
This analysis is for informational purposes only and should not be considered financial advice. Forex trading involves significant risk of loss and may not be suitable for all investors.

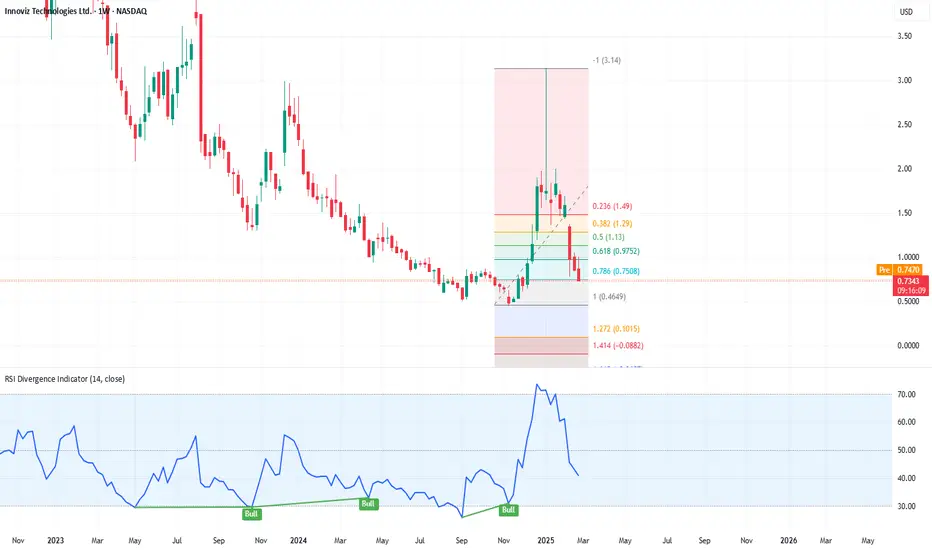
Critical Support Zone: 0.786 Fib Holding?After a strong rally, INVZ has retraced sharply to the 0.786 Fibonacci level (~$0.75). This level is often considered the last line of defense for bulls before a deeper correction.
📌 Key Observations:
✅ Price testing 0.786 Fib—a potential bounce zone if buyers step in.
✅ RSI near 40, approaching a possible reversal territory.
✅ Low-volume selling suggests no strong bearish conviction yet.
🚨 Key Levels to Watch:
🔹 Support: $0.75 (0.786 Fib), $0.46 (1.0 Fib).
🔹 Resistance: $0.97 (0.618 Fib), $1.13 (0.5 Fib).
If this support holds, a strong bounce could take the price back towards $1.13+. However, a breakdown below $0.75 may open the door to lower levels.
What do you think? Will bulls defend this level, or is more downside ahead? Share your thoughts! 📊👇
#INVZ #Fibonacci #Stocks #Trading #TechnicalAnalysis
Breakout and retest done; time to buy ? | CMP: ₹228.65 Greaves Cotton has confirmed a breakout and successful retest on the monthly charts, signaling a strong bullish setup. Adding to the conviction, renowned investors Dolly Kedia and Porinju Veliyath have recently invested in the stock, reinforcing a positive outlook for the company.
The current decline appears to be mere panic selling with low volumes, presenting a great buying opportunity for long-term investors.
📈 Technical + Fundamental Strength = High Conviction Buy!
🔹 CMP: ₹228.65
🔹 Support Zone: ₹215-220
🔹 Target: ₹270 / ₹300+
🔹 Stop-loss: ₹210 (Strict)
#GreavesCotton #StockMarket #Investing #Breakout #TradingView 🚀📊

xau/usdPrice action trading is a method of technical analysis where traders make decisions based on the raw price movements of an asset, rather than relying heavily on lagging indicators. It's about understanding and interpreting the "story" that the price chart tells.

Bitcoin IN CME Gap after Fib circle encounter - what now ?
As mentioned in a previous post, PA got "hit" by the same Fib circle that rejected the 2021 Cycle ATH - the difference being that PA got THROUGH the Fib circle Before turning down and so now, we slide down the outside, in a position of strength to be able to move higher when wanted.
As can be seen on the Daily chart below
This has also brought PA into the CME Gap as expected
Currently, PA is recovering having filled only HALF the gap.
I fully expect PA to return and complete the fill at some point.
Also note the rising line of support that we are heading towards. If we carry on like this, we intersect with it on 3rd March, Next Wednesday at a price around 77400
We will have to wait and see what happens there but this is also where the 50 week SMA will be and so, as said previously, I am expecting PA to bounce strongly
But this is Bitcoin....We have to wait and see what happens and react accordingly.
A Drop Lower would take us out of the Mid 20% Drops we have been having this cycle as can be seen on main chart.
The Next line of rising support on this chart is around -40% and is around the 100 week SMA
I am not to sure we will go there..... But.................

ONGC- Is it ONGC or OUCH!!! (Will You Buy or Sell?) Elliott Wave20th Feb 2025
Last time, ONGC traded at ₹241 on February 20, 2025 , as shown in the snapshot. Today, February 28, 2025, the stock hit a low of ₹223. The big question—Is this a buying opportunity, or is more downside ahead?
Let’s break it down:
Double Divergence Unfolding
- The RSI image on the daily chart (shown above the price chart) indicates a potential reversal.
- Price is making lower lows, while RSI is making higher lows— a regular bullish divergence , signaling that the downtrend is losing strength.
Waiting for the Final Leg Downside ( Since 20th Feb 2025)
- Though the stock has dropped to ₹223 lows as of today ( 28th Feb 2025), we are possibly in the last phase of the correction before a reversal attempt.
Trendline Confluence – Price vs. RSI
- Price chart: The stock has touched a falling trendline three times (1st, 2nd, and 3rd touch points), which could act as dynamic support.
- RSI image: A rising trendline with three touch points suggests regular bullish divergence, strengthening the case for a potential bottom formation.
Andrew Cardwell’s RSI Magic
- According to Cardwell’s RSI principles, a rising RSI against a falling price often signals an upcoming reversal.
Final Thought
- If the RSI divergence holds, ONGC might be nearing a trend reversal, making this a potential buying opportunity.
- However, a break below ₹223 with increasing momentum could invalidate this setup, opening doors for further downside.
Would you buy at these levels, or are you waiting for more confirmation? Have a great weekend
Catch me with another exciting idea from WaveTalks- Market Whispers! Can You Hear Them?
ONGC - The Big Idea - Did You Check Them?
Regards,
Abhishek
WaveTalks

Strong support zone 21500, bounch back expectedAs per weekly chart set up of Nifty 50, it is observed that a bounch back likely to come for a short term duration. Investor can start investing into mutual fund, ETFs in SIP mode, do not gamble in the market, as this is the perfect time to buy stocks or continue the SIP in the Mutual Funds. Healthy correction is always good for the market. As on date 13 % market has fallen from its all time high, no one catch the bottom, so start investing into Flexi cap funds, multicap funds or Large and Midcap funds to take advantage of correction, market will move back in next year to give you healthy returns, Do not trade into options and futures. Invest for your loved ones. Happy investing.

GOLD Trade Idea (Zones) for Friday session of 28-02-25We've got some level's to watch out for this instruments to trade on friday 2881.04 - 2882.55 is the minor Resistance zone highlighted as orange zone in the chart if price goes beyond this and sustained then it will go to it's next resistance zone which is 2889 - 2895 this resistance zone can push price to downward direction look for reversal pattern at this zone and put SL above this zone minor resistance can also cause price to go downward so look for reversal signs to short it minor support level of gold is 2867 - 2868 from here it can for some swing if this price breaked then we can get 2860 - 2854 level , so watch it carefully for the good trade.

Bitcoin Bybit chart analysis February 27 Hello
It's a Bitcoinguide.
If you have a "follower"
You can receive comment notifications on real-time travel routes and major sections.
If my analysis is helpful,
Please would like one booster button at the bottom.
This is Bitcoin's 30-minute chart.
Nasdaq indicators will be announced at 10:30 in a little while.
It is rebounding after breaking away from the previous low yesterday,
but today's main point of view is the Bollinger Band 4-hour chart's center line touch section.
Both Nasdaq and Bitcoin are in similar positions.
I created today's strategy centered on this part.
The purple finger at $82,610 on the lower left
is the 3rd place in the long position entry section on February 26.
* When the blue finger moves,
it is a short->long switching strategy centered on long positions.
1. $88,577.5 short position entry point / stop loss price when orange resistance line is broken
2. $85,093.5 long position switching / stop loss price when green support line is broken
3. $92,090.5 long position 1st target -> Good 2nd target
If it reaches the Good section, the final short position switching
(Approximately the center line of the 12-hour Bollinger Band chart.)
If it falls immediately from the current position,
The 1st section at the bottom, $85,724.5, becomes the long position entry point.
(Same stop loss price when green support line is broken)
Since there is pressure from the 4-hour MACD dead cross in the Tether Dominance that moves in the opposite direction of the beat,
If it succeeds in rebounding in section 1,
There is also a possibility that it will strongly break through the center line of the 4-hour Bollinger Band chart. (Bitcoin is in the process of a 4-hour chart MACD golden cross)
In real time, Nasdaq is touching the center line of the 4-hour chart first.
The proper order has finally been created.
Even if Bitcoin doesn't rest on the weekend,
the order of Nasdaq -> Bitcoin is correct in terms of the pattern.
With the forced coupling with Nasdaq,
today's analysis is particularly difficult from the drawing to the entry point haha
The 2nd section at the bottom is the final long position entry point for today,
and if it reaches this section,
there is a low probability of a sweep in Tether dominance. (Bit case skyrockets)
Bottom is a double bottom -> There is a possibility of additional adjustment in the 3rd section,
so please note, and this week, if possible, it would have been good if the previous low was not broken,
but it ended up breaking and is going through a difficult time.
Up to this point, please use my analysis as a reference and only as a level of use,
and I hope you operate safely with principle trading and stop loss prices.
Thank you.

EURJPY @buyhello good morning everyone today limit entry @eurjpy so place your order & sitback and relax for your target and dont, follow to forget me,

HDFC Bank on crucial Resistance HDFC Ban can be shorted @Rs.1717/- with a SL of Rs.1728/- with a target of Rs.1680/- As can be seen in Chart that upside has been rejected by Resistence by a strong Inverted Hammer on 30 Min Time Frame Chart

Nifty going to test 20300There remains an unfilled gap(front or back candles) at around 20300(refer dashed lines) which might get filled in this downtrend. The trendline suggests this gap to be filled between May end and mid July 2025.

Action Construction Equipment LtdDate 28.02.2025
Action Construction
NSE: ACE
Timeframe : Day Chart
Company Information :
Action Construction Equipment Ltd is engaged in the business of manufacturing and marketing of hydraulic mobile cranes, mobile tower cranes, material handling equipment like forklifts, road construction equipment like backhoe loaders, compactors, motor graders and agriculture equipment like tractors, harvesters, rotavators, etc.
Some Key Values :
PE Ratio = 32.1
ROCE = 42.3 %
ROE = 30.6 %
Book Value = 116
OPM = 14%
Promoter =65.41 %
DII = 1.70 %
FII = 11.90 %
Public = 20.86 %
Strengths
1 Company is almost debt free.
2 Company has delivered good profit growth of 42.6% CAGR over last 5 years
3 Debtor days have improved from 30.5 to 20.6 days.
Weakness
1 Stock is trading at 9.06 times its book value
Regards,
Ankur

CENTURYPLY - VIEWStocks looks good for a Short Sell with Stop Loss of 880 on Weekly Closing basis and with a Target of Rs. 575 thereafter keep Trailing Stop Loss.
Trader's/Investors who are on Long Side be little cautious on this counter.
Disclaimer: All information give is for educational purposes. Please consult your financial advisor before investing.
If you like such content please subscribe and share it with your Trader Friends or Family Members.
For more such content. Stay Tuned.

Is Cholamandalam Finance Ready for a Breakout?Cholamandalam Financial Holdings Limited (CFHL), a prominent entity within the Murugappa Group, stands as a testament to India's dynamic financial services sector. Established in 1978, CFHL has evolved into a comprehensive investment company, holding significant stakes in various financial services and risk management enterprises.
Financial Performance
In the fiscal year 2023-2024, CFHL reported consolidated revenue of ₹258,035.2 million, reflecting a significant increase from ₹181,458.7 million in the previous year. The net income for the same period stood at ₹17,725.2 million, up from ₹12,902.3 million in 2022-2023. Total assets as of March 31, 2024, were valued at ₹1,769,176.7 million, with total liabilities amounting to ₹1,666,759.4 million.
Shareholding Structure
The shareholding pattern of CFHL is as follows:
Promoters: 46.45%
Foreign Investors:17.07%
Institutional Investors:22.94%
Government Holding:0.46%
Non-Promoter Corporate Holding:2.11%
Public and Others:10.97%
Technical Analysis
From December to February, the price remained in a consolidation phase and formed a double bottom pattern. The breakout from this pattern occurred on **27/02/2025**. If the price closes and sustains above 1644 on the daily timeframe, we can anticipate a strong upward movement towards 1981.
R1 (First Resistance):1744
R2 (Second Resistance):1863
R3 (Third Resistance):1981
Disclaimer: This article is for informational purposes only and should not be construed as financial advice. Investors are advised to conduct their own research or consult with a financial advisor before making investment decisions.

XAUUSD GOLD Analysis on(28/02/2025)#XAUUSD UPDATE...!!!
Current price - 2862
If price stay above 2845, then next target 2885,2900 and below that 2830
Plan;If price break 2862-2858 area, and stay above 2860,we will place buy order in gold with target of 2885 and 2900 & stop loss should be placed at 2845

GOLD - BULLISH STRUCTURE SHAKING - WHAT'S NEXT?Symbol - XAUUSD
CMP - 2910
Gold has transitioned from a locally bullish trend to a neutral, sideways market. Despite this shift, bullish forces continue to defend key support levels. What can we anticipate for the precious metal in the near term?
Investor sentiment has gravitated back toward safe-haven assets amid concerns surrounding President Trump's tariff policies and disappointing U.S. economic data. On Tuesday, gold experienced a pullback from its record high of $2,956 due to profit-taking and a decline in Chinese imports. However, a weaker-than-expected U.S. consumer confidence index facilitated a recovery in gold prices.
The upward movement in gold is currently constrained by a strengthening U.S. dollar and rising bond yields, but ongoing trade war concerns continue to fuel demand for the metal.
Key resistance levels: 2921, 2929, 2942
Key support levels: 2905, 2888
As a result, gold is likely to remain within a sideways trading range. There is potential for a short-term decline to retest support in the 2905-2888 range before resuming upward movement. Alternatively, a breakout above resistance levels could signal further gains.
If the bulls manage to sustain trading above the 2921-2929 zone, the metal could resume its upward trajectory.

EURUSD - PRE BREAKOUT CONSOLIDATION - ASCENDING TRIANGLESymbol - EURUSD
CMP - 1.0485
The EURUSD pair continues to display bullish signals, suggesting the potential for sustained upward movement. However, significant resistance lies ahead, and the market is currently undergoing a pre-breakout consolidation phase. The U.S. dollar is experiencing a corrective phase, influenced by economic data, domestic political developments, and indications from both President Trump and Federal Reserve Chairman Jerome Powell regarding the possibility of an imminent interest rate cut.
The euro is benefiting from the weakening dollar, though the duration of this trend remains uncertain, particularly in the context of the ongoing trade tensions between the U.S. and Europe.
From a technical perspective, the current chart suggests a bullish outlook. An ascending triangle is forming within the prevailing uptrend, generally indicative of market optimism. Key focus is placed on the pattern’s base, with resistance located at the 1.0530 level.
Support levels: 1.0450, 1.0400
Resistance levels: 1.0530
Should the dollar continue its downward trajectory, the pair is poised for potential growth. A retest of the trend support level, possibly marked by a false breakout, could occur before a decisive breakout. A successful breakout and sustained consolidation above the 1.0530 resistance level may trigger further upward movement.

Breakaway Gap and Bullish Momentum in SRF Ltd1. Key Observations in Price Action
Price Movement:
The stock has been range-bound for a considerable period, trading between ~2200 (support zone) and ~2600 (resistance zone).
The highlighted blue box captures this range.
Several attempts to break out above 2600 (R3) failed, showing resistance.
Likewise, multiple tests of the support level around 2200 (S3) held strong.
Breakaway Gap on the chart:
A large gap-up candle appears on the right-hand side.
The price surged from the prior resistance (~2400-2500) to a new high of ~2650.
This is indicative of a breakaway gap, often signifying the start of a strong upward trend.
The breakout is further supported by strong volume (visible in the price action characteristics).
The price is now trading above the pivot (P) and nearing R1/R2, suggesting bullish momentum.
2. Pivot Levels and Key Support/Resistance
Resistance Zones:
R1 (2600): Currently being tested.
R2 (2700): The next potential level if momentum continues.
R3 (2900): A longer-term bullish target if the uptrend sustains.
Support Zones:
P (2400-2500): Recent resistance turned support; critical to sustaining the uptrend.
S1 (2300): Immediate support if a pullback occurs.
S2/S3 (2200): The bottom of the prior range and a strong support zone.
3. Breakaway Gap Analysis
What is a Breakaway Gap?
A breakaway gap occurs when the price opens significantly higher (or lower) than the previous close, accompanied by strong volume. It marks the beginning of a new trend.
The gap is often not filled immediately and acts as a strong support/resistance level.
In this case:
The gap has broken out of the 2400-2600 consolidation range, signifying the end of the prior range-bound movement.
If the gap remains unfilled in the coming sessions, it will confirm a breakaway gap and further validate bullish strength.
Support from MACD (discussed below) and pivot levels indicates the price may continue higher.
4. MACD Analysis
The MACD line (blue) is above the signal line (orange), confirming bullish momentum.
The histogram is strongly positive, indicating the strength of the upward trend.
This momentum aligns with the gap breakout and suggests the continuation of the upward move.
5. Trading Implications
Bullish Case:
A sustained move above R1 (2600) can lead to the next resistance at R2 (2700).
The breakaway gap (~2400-2500) will act as strong support, ensuring a higher low structure.
Traders can look for long entries above 2600, with a stop loss near 2500 (gap support) and targets at 2700-2900.
Bearish Case (Invalidation):
A failure to sustain above 2600 could lead to a pullback to the gap level (2400-2500).
If the price fills the gap entirely, it may re-enter the previous range of 2200-2600.
Conclusion
The breakaway gap signals a potential long-term uptrend for SRF Ltd, provided the gap remains unfilled.
MACD and pivot levels confirm bullish momentum, with upside targets at 2700 and 2900.
Key support levels to watch:
Immediate: 2500 (gap zone)
Critical: 2200 (previous range bottom)

Key Patterns, Observations, and Future ScenariosThe stock is trading within a well-defined ascending channel, which is indicative of an overall bullish trend. Over the past few years, the price has consistently respected both the upper and lower boundaries of this channel. This is a strong indication of systematic movement and healthy trends in the stock.
The price has recently bounced off a key support level near the lower boundary of the channel around ₹179, and it’s currently sitting at ₹202. This suggests that the stock might be gearing up for another move toward the upper boundary of the channel.
Fibonacci Levels and Price Action Observations:
The Fibonacci levels plotted on the chart act as critical support and resistance zones. Let’s break this down:
Support levels : ₹179 is a major support level, being close to the S1 level and the lower channel line. Below that, ₹160 and ₹136 also serve as significant supports if the stock witnesses a deeper correction.
Resistance levels: On the upside, ₹225 and ₹237 are immediate hurdles. The ₹225 level aligns with the pivot and has seen price rejection multiple times in the past. Beyond this, ₹263, which is the R3 level, coincides with the upper boundary of the channel and serves as a long-term resistance target.
The price action suggests the stock has been consolidating near the middle of the channel, but with a tendency to test higher levels after each consolidation phase. This is a healthy sign of accumulation and consistent bullish interest.
Momentum Indicators – MACD: T
he MACD (Moving Average Convergence Divergence) indicator below the chart is signaling early bullish momentum: We can see a potential bullish crossover where the MACD line (blue) is about to cross above the signal line (orange). This is a classic signal for potential upward movement in the near term.
Additionally, the MACD histogram is beginning to turn positive, though it’s still in the early stages of a bullish signal. This suggests that while momentum is building, we need to wait for confirmation.
If the price breaks above the ₹225 resistance level with strong volume, it could lead to a rally toward ₹237, which is the next major resistance based on Fibonacci and channel projections.
If the bullish momentum sustains, the price might even target ₹263, the upper channel boundary. This move would signify a continuation of the long-term bullish trend.
It’s also possible that the stock might continue oscillating within the channel boundaries for some time, respecting the key Fibonacci levels for support and resistance. In such a case, we might see the price consolidating between ₹179 and ₹225 before making a decisive move.
I would consider entering long positions near the ₹179 support level or on a breakout above ₹225. The first target for this trade would be ₹237, followed by ₹263, depending on momentum and market conditions. Stop-loss for this trade could be placed slightly below ₹160 to manage risk effectively.

Testing Key Support with Bearish MomentumTata Power is consolidating between 370 INR (support) and 470 INR (resistance). The MACD shows bearish momentum with a negative crossover and declining histogram. If 370 INR breaks, the next major support lies at 336 INR.
The weekly chart of Tata Power indicates a consolidation phase, with the stock trading between 370 INR (support) and 470 INR (resistance). Currently, the price is testing the S1 Fibonacci level (~370 INR), a critical support zone. The following are key observations:
Key Observations:
MACD Indicator:
A bearish crossover is evident, with the MACD line below the signal line.
The histogram is negative and declining, signaling strong bearish momentum.
Support and Resistance Levels:
Current Support: Immediate support is visible near 370 INR (S1 level).
Further Downside: If 370 INR breaks, the next critical support level lies around 336 INR (S2 Fibonacci level).
Resistance: The stock faces resistance near 470 INR (R1 level).
Price Action:
The stock is in a downward trend after failing to sustain above its range near 470 INR.
A potential breakdown below 370 INR could lead to further bearish action toward 336 INR, a strong historical support.
Possible Scenarios:
Bearish Continuation:
A breakdown below 370 INR would confirm bearish sentiment, with the next support at 336 INR.
Traders should watch for strong bearish candles to confirm this move.
Reversal Potential:
If the price consolidates or forms reversal patterns like a hammer or bullish engulfing near 370 INR or 336 INR, it could indicate a potential recovery toward the upper range.
Conclusion: Tata Power is currently at a crucial support zone. A breakdown could lead to further downside, with the next key level at 336 INR. However, any signs of a reversal could present an opportunity for recovery. Traders and investors should monitor price action closely near these levels.

Comprehensive Technical Analysis of IRFC Weekly Chart: TrendsTrend Analysis:
Current Price: ₹145.42 (as shown on the chart).
Trend Direction:
The breakout from the descending wedge earlier suggests bullish momentum. However, the price has been consolidating in a sideways pattern recently, indicating indecision among traders.
A strong support level is evident near ₹140–₹144.
Support and Resistance Levels:
Immediate Support: ₹144 (near Pivot Point and S1 zone).
If the price breaks below ₹144, it could retest lower Fibonacci levels like ₹130–₹125 (S2 and S3).
Resistance Levels:
₹153 (R1): If the price can cross this, further upward movement toward ₹160 (R2) and ₹180 (R3) is possible.
MACD Insights:
Current Status:
MACD is below the signal line, suggesting bearish momentum in the short term.
The histogram shows shrinking red bars, indicating weakening bearish momentum and potential for reversal.
Possibilities:
If the MACD crosses above the signal line, it would confirm bullish momentum.
If bearish momentum persists, expect further price consolidation or a downward move.
Volume and Momentum:
The chart does not explicitly show volume bars, but momentum indicators (like MACD) suggest a slowdown in bearish pressure.
Wedge Breakout and Potential Scenarios:
Bullish Continuation: If ₹145–₹150 is held as support, the price may rally toward ₹160 and eventually ₹180 in the medium term.
Bearish Breakdown: If ₹144 is breached, the price may revisit ₹130, a strong support level from previous consolidations.
Sideways Consolidation: If momentum remains weak, the price could range between ₹144–₹153 for a few weeks.
