Bank nifty Trades and Targets for - 27-1-26Hello Everyone. The market was in a bearish mode today. Sell on rise should be followed. If the market opens flat then we can see continuation of trend. If it opens gap up then we need to see the resistance level to break before looking for CE trades. If it opens gap down then look for PE trades after support zone is broken. Let the market settle in first 15 to 30 minutes then look for directional trades. Book profits every 30 points as we are getting very few trending moves.
Chart Patterns

Nifty Analysis for 27th Expiry Hello Everyone. The market was in a bearish mode previous day. If the market opens flat then we can see continuation of trend. If it opens gap up then we need to see the resistance level to break before looking for CE trades. If it opens gap down then look for PE trades after support zone is broken. Let the market settle in first 15 to 30 minutes as there needs to be premium adjustment and 3 days decay, then look for directional trades. Book profits every 30 points as we are getting very few trending moves. Its expiry day so do not increase your lot size as premiums are low and do not take trades against the trend at any cost.

XAUUSD – Monday Focus: Buy the Dip Toward 5,020–5,043 Market Context
Gold remains firmly supported by a bullish risk environment. The recent impulse leg confirms that buyers are still in control, while pullbacks are being absorbed rather than extended.
This is continuation behavior, not distribution.
The question for Monday is not if Gold is bullish —
but where the dip becomes opportunity.
Technical Structure (H1)
Market has already confirmed bullish BOS
Strong impulsive leg created multiple stacked FVGs below
Current price is consolidating above structure, not breaking it
Pullback is corrective in nature
This is a classic impulse → retracement → continuation setup.
Key Zones to Watch
Immediate resistance / BOS level: 4,969 – 4,970
Intraday BUY zone: 4,933 – 4,940
Upper FVG support: 4,920 – 4,899
Deeper demand (HTF): 4,860 – 4,880
As long as price holds above the upper FVG, bullish bias remains intact.
Scenarios (If – Then)
Scenario 1 – Bullish Continuation (Primary)
If price pulls back into 4,933 – 4,940 and holds
Buyers step in → continuation toward:
5,020
5,043 (1.618 extension)
Scenario 2 – Deeper Pullback (Alternative)
If price loses 4,933
Expect mitigation toward 4,920 – 4,899
Only a sustained H1 close below 4,899 would weaken the bullish structure
Summary
Gold is not overextended — it is rebalancing within a bullish trend.
The structure favors buying pullbacks, not chasing highs.
This is a dip-buying market until structure says otherwise.

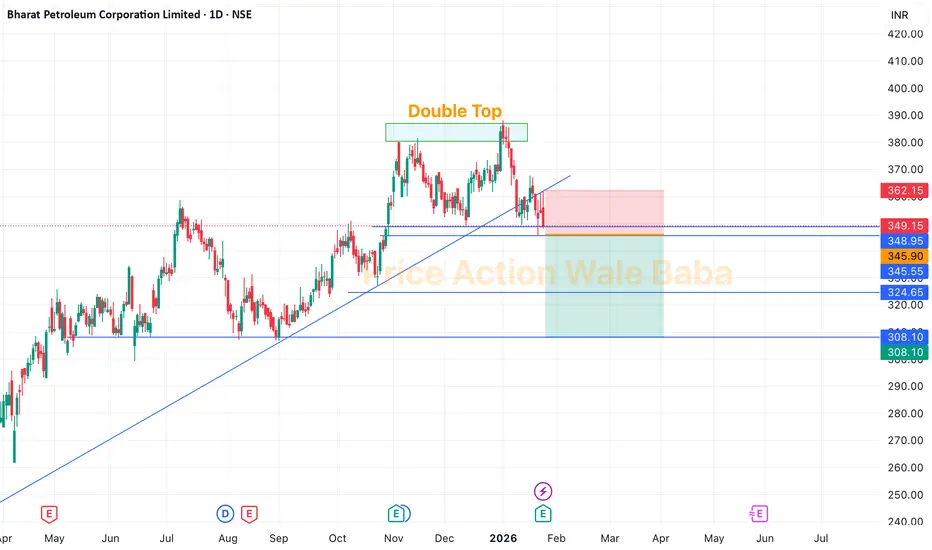
BPCL - Double TopBPCL is forming a Double Top which is has neckline of 345.
Delivery Based Selling Strategy:
Sell below 345,
Keep SL on high of 23rd Jan candle, which is 361.
Targets are 320-300.
Option Buying Strategy
So, for the option trading in this stock, you can choose any PUT option on BPCL, mark high of 21st Jan candle in option, once it breaks it just buy and keep SL below same day's low.
INTRADAY INSTITUTIONAL TRADING Moneyness
In-the-Money (ITM)
Call: Spot > Strike
Put: Spot < Strike
At-the-Money (ATM)
Spot ≈ Strike
Out-of-the-Money (OTM)
Call: Spot < Strike
Put: Spot > Strike

Part 5 Advance Option Trading Option Seller (Short Option)
Advantages:
Benefits from time decay
Higher probability of profit
Works well in sideways markets
Disadvantages:
Unlimited or very high risk
Requires margin
Risk increases sharply during volatility spikes

BUY MOVEMENT EXPECTED IN ATHER
Wait price once will be go for 600-597 then u-turn upside , if weekly close Between 621-625 or + , then enter for target 700+ in next 2-3 month

Nasdaqrisk to reward if good worth taking risk, looking at the geopolitical tension most likely to fall like water

Part 4 Institutional Trading Vs. Technical AnalysisOption Buyer (Long Option)
Advantages:
Limited risk
Unlimited profit potential (for calls)
High leverage
Clear risk-reward structure
Disadvantages:
Time decay works against buyer
Requires strong directional or volatility move
High probability of small losses

TitanTitan forming evening star pattern on weekly time frame.
No buy/sell suggestion only for education purpose.

Part 2 Institutional Trading Vs. Technical AnalysisWhat Is an Option Contract?
An option contract is a legal agreement that gives the buyer the right, but not the obligation, to buy or sell an underlying asset at a predetermined price within a specified time period.
Each option contract has four essential components:
Underlying Asset – Stock, index, commodity, currency, etc.
Strike Price – The price at which the underlying can be bought or sold.
Expiration Date – The date when the option contract expires.
Premium – The price paid by the option buyer to the seller (writer).
There are two parties in every option trade:
Option Buyer (Holder) – Pays the premium, has rights.
Option Seller (Writer) – Receives the premium, has obligations.

Part 1 Institutional Trading Vs. Technical Analysis Introduction to Option Trading
Option trading is one of the most powerful and flexible tools available in modern financial markets. Unlike traditional stock investing, where profits depend mainly on price movement in one direction, option trading allows traders to benefit from price movement, time decay, volatility changes, and even price stagnation.
An option is a derivative instrument, meaning its value is derived from an underlying asset such as stocks, indices, commodities, currencies, or ETFs. Options are widely used by retail traders, institutional investors, hedge funds, and market makers for speculation, hedging, income generation, and risk management.
The key appeal of options lies in their leverage, defined risk (for buyers), strategic flexibility, and adaptability across market conditions—bullish, bearish, or sideways.

BSEBSE
bullish trend is Showing on the chart.
technical indicators and
cup with handle & ascending triangle chart pattern.


Vedanta 13000+ Targets in next 10 Years suggest Quarterly ChartsVedanta 13000+ Targets in next 10 Years suggest Quarterly Charts.
LTP - 685
Targets - 13000+
Timeframe - 10 Years
Technically Vedanta is following its channel since Inception in 1994. It has move from 0.25 to 143 ... 550x ROI from 2000 till 2010. Post this phase it went in sideway consolidation till 2020 making lows of 27.
Post consolidation Stock is again in uptrend & making New Highs on Monthly basis.
This Rally would continue till 2030 ... Vedanta can be Multibagger for long term Investment.
Happy Investing.


#CHENNPETRO#CHENNPETRO
bullish trend is Showing on the chart.
buy signals in
technical indicators and
Retest cup with handle chart pattern.
Buying Range 830/840
Watch for a breakout above 770/780 to sustain the bullish trend. If the resistance holds, there could be a retest towards 640/650 and an uptrend from here.

Weekly analysis of XAUUS/Gold with buy and sell scenarios...Gold has reached to Level 2 as we analysed few weeks back.
Gold has created a strong weekly momentum candle showing positive sentiment. But there is divergence with volume. Candle is strongest amongst last four weekly candles while volume is lowest. On daily time frame there are consecutive 5 buy candles. RSI is also over 80 and oversold All these brings a caution
So, price may take a pause or pull back to adjust pricing. Now we need to be cautious and plan for rangebound pull back.
1. Price has created higher highs in lower time frames and created micro structures.
2. Now price may pull back with some delivery change in lower time frames.
3. Still, we should be positive till delivery changes at 4H/1H TF.
4. Most probably price will take liquidity of FVG/RDRB level and create MSS/CISD/TS/iFVG in LTF.
5. Price should show rejection/reversal in respective LTF (4H/1h/15m) at FVG zone.
6. Take the trade only once clear entry model i.e. turtle soup. iFVG break, CDS or MSS happens on LTF
All these combinations are signalling a high probability and high RnR trade scenario.
Note – if you liked this analysis, please boost the idea so that other can also get benefit of it.
Also follow me for notification for incoming ideas.
Also Feel free to comment if you have any input to share.
Disclaimer: This analysis is for educational purposes only and does not constitute investment advice. Please do your own research (DYOR) and check with your financial advisor before making any trading decisions.

Multiple time frame RSI bearish diversion Tata steelMultiple time frame RSI bearish diversion Tata steel. This content is for educational and informational purposes only and does not constitute financial, investment, or trading advice. Trading financial markets involves significant risk of loss, and past performance does not guarantee future results. Users are responsible for their own investment decisions and should consult a certified financial advisor.

MRPLMRPL
bullish trend is Showing on the chart.
buy signals in
technical indicators and
Ascending Channel chart pattern.
cup and handle pattern
BUYING RANGE 150/155
Watch for a retest 150/155 to sustain the bullish trend. If the resistance holds, there could be a retest towards 120/125 and an uptrend from here.

MTARTECHMTARTECH
bullish trend is Showing on the chart.
buy signals in
technical indicators and
Inverse Head & Shoulders (Weekly) chart pattern.
BUYING RANGE 2800/2820
Watch for a breakout above 2800/2820 to sustain the bullish trend. If the resistance holds, there could be a retest towards 2200/2230 and an uptrend from here.

Weekly Analysis of BTC - Detailed Another week and price still moved as expected in same range. No major view change since last prediction for long term trades.
Further short-term view.
Week is closed bearish and may target recent draw on liquidities of ~84K. Price may move in choppy mode for some time. So, the best idea is to look for small trade rather than long swing trades.
As the market in rangebound/Choppy, so we should keep eye on both side Opps but focus on down side as next high-level draw on liquidity is at downside.
Refer previous details below for larger perspective…
We analysed three weeks back that BTC would be in range for some time before taking any further move, And BTC is following same analysis and trapped within a small range since then. BTC prediction of last week also worked perfectly well and market kept in consolidation mode itself. BTC is still in consolidation zone and may spend some more days. It may develop ABC pattern or reversal at identified daily FVG level, if price has to change its delivery and take turn from here. This zone is kind of make or break. If price is not able to sustain and breakdown, then it may witness ~65-70K levels as well.
We hope for reversal from this level as price is developing the pattern at higher time frame.
1. Price has taken liquidity or 82K and almost touched 80K.
2. It has inversed 1Day FVG and now price is consolidating in the range between EMAs.
3. We may expect price retracement till 1D iFVG and then reversal.
4. Before to that we may see sweep of 92900 (1D CISD) level and then a retracement short trade till 1D FVG
5. Most probably price will take liquidity of FVG/RDRB level and create MSS/CISD/TS/iFVG in LTF.
6. Price should show rejection/reversal in respective LTF (5m/15m) at FVG zone.
7. Take the trade only once clear entry model i.e. turtle soup. iFVG break, CDS or MSS happens on LTF
All these combinations are signalling a high probability trade scenario.
Note – if you liked this analysis, please boost the idea so that other can also get benefit of it.
Also follow me for notification for incoming ideas.
Also Feel free to comment if you have any input to share.
Disclaimer: This analysis is for educational purposes only and does not constitute investment advice. Please do your own research (DYOR) and check with your financial advisor before making any trading decisions.
