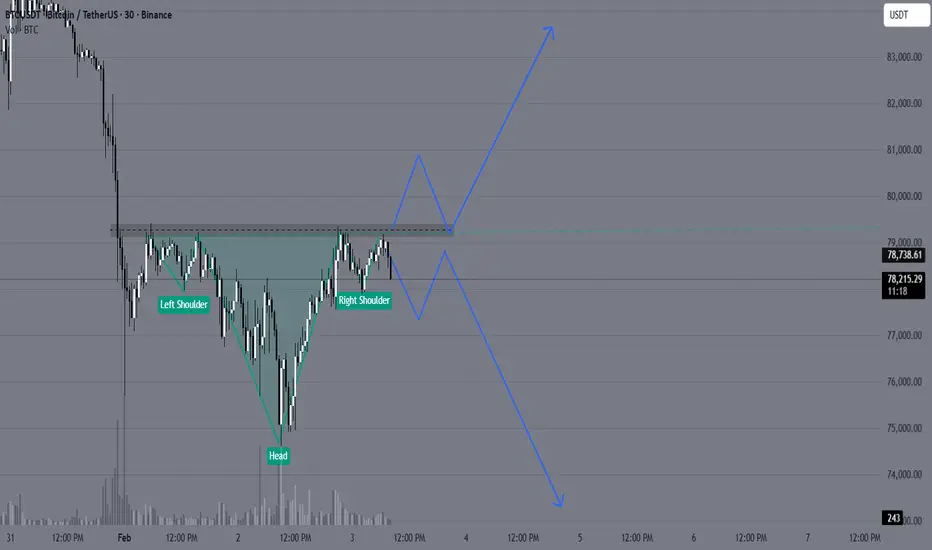
BTCUSD might give Structure Shift Now✅ Pattern: Potential Inverse Head & Shoulders
Look closely:
Left dip → around 76.8k
Deep dip (Head) → around 75k
Right dip → higher low near 76.5k
Now price is pushing back up
This is a classic reversal structure.
✅ Important Level: Neckline Resistance
The dotted zone you marked around:
79,000–79,200
That is the neckline / supply cap.
Price is repeatedly testing it.
📌 Until this breaks, structure is still “building.”
✅ Structure Type: Higher Low Creation
This is the most important:
Previous low = 75k
New low = ~76.2k
That means:
Higher Low → Early Bullish Shift
This is how reversals begin.
🚦What’s Needed for Confirmation?
Bullish Confirmation = Break + Close Above 79.2k
If BTC closes above that zone:
✅ Structure break
✅ Trend reversal likely
✅ Next targets:
80.5k
82k
84.4k (major resistance)
⚠️ Bearish Risk
If price rejects again and breaks below:
76.5k support
Then structure fails and BTC can revisit:
75k
73.8k
📌 Conclusion
BTC is creating a structure:
✅ Base + Range
✅ Higher Low
✅ Possible Inverse H&S
⏳ Waiting for neckline breakout
Chart Patterns
Texas Instruments breaks into price discovery above ATH1 Trend is constructive and the breakout came after a long base, not a random spike
2 The old high was reached, tested, then broken, now price is in discovery
3 The key is whether the market can hold above the breakout zone and stay accepted there
4 Pattern labels are visual context only, they are not required for the signal logic
5 Silent Flow is active, it confirms direction and state, but it does not promise a smooth ride
6 Scenario A is acceptance above the old high, trend can keep working higher
7 Scenario B is a slip back below the old high, then it starts to look like a failed push and price must prove demand again

ETH Reversal or just a pullback?CRYPTO:ETHUSD
Looking at the 4hr TF of ETH. it looks taking a minor pullback from the downward trend.
Yet it has to close Above $2620 to break the character of the current downtrend.
Highly likely it will chase this number successfully as more people are coming in with sentiment of buying the dip.
but Keeping technical analysis as a primary tool here. I am still bearish for long term.
But a Long(buy) swing opportunity can be seen.
For long term I would wait for more cheap price.
till then going short on pullbacks.
:) Happy Trading.

ANGELONEANGELONE
bullish trend is Showing on the chart.
buy signals in
technical indicators and
descending triangle chart pattern.

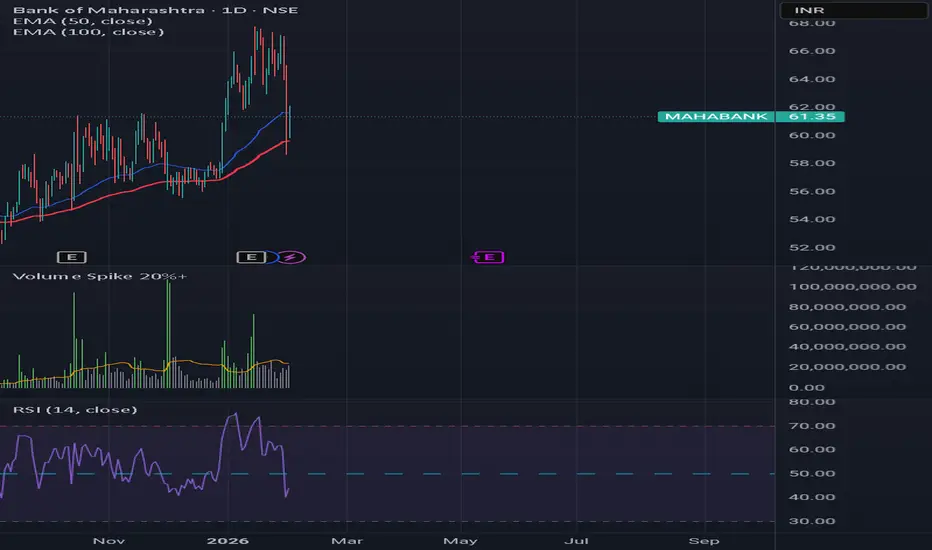
MAHABANKShowing support at 8t 50 days MA
RSI bounced back from its lower level (39 to 43) and becoming stronger.
MACD on monthly chart indicates share prices is preparing for longterm bet.
Bottom Fishing in Nifty InfraCup and Handle breakout being retested on daily timeframe. Upside targets marked in green are valid till support at 8800-8850 is respected. Expecting consolidation between 8850-9500 for few weeks.

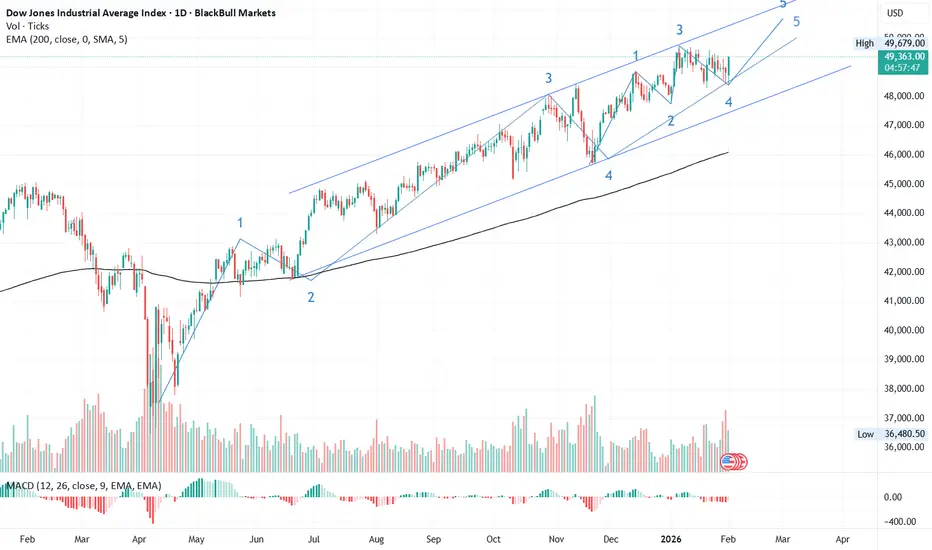
#DJI📊 DJI Technical Outlook – Entering the Final Leg of Its Impulsive Cycle
The Dow Jones Industrial Average (DJI) began a new impulsive cycle in April 2025, marking its 1st wave on 20 May 2025.
• The 2nd wave unfolded as a flat correction with a C-wave failure, ending at 41,835.
• The 3rd wave, the strongest of the cycle, surged to a high of 48,037.
• The 4th wave followed as an elongated flat with an extended C wave.
• Now, DJI has entered its 5th wave on the daily chart.
🔹 Breaking Down the 5th Wave
• The 1st sub-wave appears extended, as the 3rd sub-wave was shorter than the 1st.
• By Elliott Wave principles, the 5th sub-wave should be shorter than the 3rd.
• This structure suggests DJI will continue its bull run, targeting 50,000–50,300 in the near term.
⚠️ Risk Management
A logical stop-loss sits at the end of wave 4, around 48,379.
$TVC:SILVER MOON MISSION:2025-29 is History Repeating Again? TP?🚀 Silver Feature Analysis 2026 – 2029: The Historical Repeat 🚀
TVC:SILVER has recently hit its All-Time High (ATH) three times in history with massive rallies. My analysis is based on the duration and percentage returns of these specific periods:
1️⃣ 1980: (1 Aug 1979 to 29 Jan 1980) – A 6-month rally with returns OVER 511% ($6.5 to $48). 📈
2️⃣ 2011: (1 Oct 2008 to 22 Apr 2011) – A 2y 6m 21 days rally with returns OVER 451% ($8.4 to $47.91). 📈
3️⃣ 2021: (2 Mar 2020 to 10 Feb 2021) – An 11m 8 days rally from $11.63 to $30.09. 📈
🔍 The Current Assumption 🔍
The ongoing rally started on 3 Feb 2025 and is continuing to the present day. Based on price action, silver has been manipulated many times (like in 1980, 2011, and 2021), and I expect this to happen again in the upcoming years of 2028-2029. ⚠️
🎯 Near-Term Goal: This rally is projected to go up to $119 – $129.88. 🔄 The Reversal: After hitting those levels, I anticipate a small reversal back to the $102 – $105 per ounce range. 📉 ⚡ The Final Leg: In Sep 2026 to Nov 2026, we could see a continuation, eventually reaching levels of $179 – $185 in the year 2028-2029 as silver repeats its historic data! 🚀🔥
📑 Key Support & Resistance Levels 📑
Based on the cycles, here are the critical levels to watch:
Year Support Resistance
1979-80 $6.5 $48
2008-11 $8 $47.91
2020-21 $11.63 $30.09
2025-28 $30.97 🟢 $129 - $169 🔴
2025-29 $79 - $86 🟢 $110 - $119 🔴
📊 Technical Snapshot (Current Stats) 📊
🟢 Trend: BULLISH (MTF Trend) 💪 ADX: 44.3 (Strong Trend Energy) 🔥 RSI: 94.5 (Extreme Momentum - Use Caution) ✅ Trade Mode: 🟢 LONG ONLY TILL RESISTANCE 🟢 🎯 Target Projection: Rally expected till the $129.44 level.
💡 Conclusion 💡
History is repeating! 🔁 After the accumulation that started on 03 Feb 2025, silver is on a path to mirror its 1980 and 2011 performance. Watch the $129 level closely for the first major milestone. 🏁💎
⚠️ RISK WARNING & DISCLAIMER ⚠️
This analysis is for educational and informational purposes only. Trading precious metals involves high risk. The projections mentioned (such as the $129 and $185 targets) are based on historical fractal data and current technical indicators, but market conditions can change due to global economic factors. Always do your own research (DYOR) and consult with a financial advisor before making any investment decisions. Past performance is not indicative of future results. 🛑

TRADINGVIEW IS LOOKING FOR A NEW INDIAN REGION MODERATOR!Join Our Team: Exciting Opportunity to Become a Moderator for the Indian Region Community at TradingView!
Hello TradingView Enthusiasts,
Are you passionate about trading and the TradingView platform? We are on the lookout for a new moderator to join our INDIAN REGION Community and help elevate the experience for users like you.
As a moderator, your role is pivotal. You'll guide members, ensure adherence to our community standards, and help users maximize their TradingView experience. This is your chance to shine and directly influence the community dynamics while ensuring a friendly and respectful environment.
The General Tasks are:
✅ Replying to user inquiries that might get sent to you.
✅ Welcoming and encouraging new users
✅ Help reward and recognize users through TradingView Boosts and Editors Picks.
✅ Keeping the peace in our chat rooms
✅ Helping ensure that the site rules are followed
✅ Help maintain the quality of the site - eg unsuggesting poor ideas and untagging non-educational posts.
✅ Being visible - keep posting your ideas, chat with users, post comments on users' ideas etc
While this is an unpaid volunteer position, the benefits are substantial:
✅ Exclusive Access : Engage directly with our internal team, including the founders.
✅ Influence Development : Provide input on platform enhancements and new functionalities.
✅ Free Plan : Enjoy a free ULTIMATE account along with free data packs and exclusive merchandise.
✅ Boost Your Profile : Gain significant exposure, increase your follower count, and enhance your presence across the site.
✅ Career Opportunities : Many of our moderators have transitioned into full-time roles, using this position as a stepping stone to further their careers within TradingView.
We are looking for a Community Leader. We're looking for someone who:
✅ Has in-depth knowledge of the TradingView platform.
✅ Maintains a strong reputation within the community through high-quality content and helpful interactions.
✅ Engages positively with community members, respects diverse opinions, and upholds our community standards.
✅ Can dedicate at least one hour daily to moderating and supporting the community.
✅ Has been an active, respected TradingView member for over six months with minimal rule violations.
✅ Possesses solid general trading knowledge and can communicate effectively in both spoken and written English.
A good indication of this is:
✅ 100 or more posted trade ideas
✅ Have posted educational ideas
✅ Consistently get likes for your posted ideas (quality over quantity)
✅ 100 or more genuine followers
✅ Interact in Minds
✅ Regularly respond to comments on your own and others posts
✅ Have created and posted a Script
You don't need to have done all of these things, but it does help you stand out in the crowd and demonstrate you are familiar with multiple areas of our site.
Think this could be you? Learn more about what it means to be a moderator here:
www.tradingview.com
Ready to apply? Please fill out this form in English:
forms.gle/bsdGF1hw64wc3Epq6
🤔 If you have any questions or need further information, feel free to reach out to @zAngus .
We're excited to see who will join our team next and help us continue to provide a world-class trading community experience.
Warm regards,
💖 TradingView Team

NIFTY : Trading levels and Plan for 02-Feb-2025Trend View : Sideways
🚀 Scenario 1: GAP UP Opening (100+ Points)
(Opening near / above 25,000)
🧠 Psychology
A gap up after a sharp fall usually signals short covering, but higher levels still carry strong supply pressure.
🟢 Bullish Plan
🔵 If price sustains above 25,010 on a 15-min closing basis
🔵 Expect upside towards 25,252
🔵 Momentum continuation only if 25,252 is broken with volume
🔴 Rejection Plan
🔴 Failure to sustain above 25,010
🔴 Expect pullback towards 24,847 – 24,695 (No-Trade Zone)
📌 Why this works
Gap-up moves fail if buyers are weak. Sustaining above resistance confirms real demand.
➖ Scenario 2: FLAT Opening
(Opening between 24,750 – 24,900)
🧠 Psychology
Flat opens after a sell-off indicate confusion and balance. Market first tests both sides for liquidity.
🟢 Upside Plan
🔵 Acceptance above 25,010
🔵 Targets: 25,252
🔵 Suitable for low-risk call spreads
🔴 Downside Plan
🔴 Breakdown below 24,695
🔴 Price may drift towards 24,611 → 24,531
📌 Special Note
🟠 24,695 – 24,847 is a No-Trade Zone
🟠 Avoid trades here unless price breaks decisively
🔻 Scenario 3: GAP DOWN Opening (100+ Points)
(Opening near / below 24,611)
🧠 Psychology
Gap down reflects fear-based selling. Smart money waits to see whether supports attract buyers or fail.
🟢 Bounce Setup
🔵 If 24,531 – 24,611 zone holds
🔵 Expect technical bounce towards 24,847 → 25,010
🔴 Breakdown Setup
🔴 Clean break below 24,531
🔴 Downside opens till 24,377
📌 Why this works
Strong supports either give sharp bounces or fast breakdowns—clarity comes with confirmation.
🛡️ Risk Management Tips for Options Traders
🟢 Trade only after first 15-min candle closes
🟢 Prefer defined-risk spreads in volatile markets
🟢 Avoid trading inside No-Trade Zones ❌
🟢 Risk maximum 1–2% capital per trade
🟢 Book partial profits near next resistance/support
🟢 Discipline > Prediction 📌
🧾 Summary & Conclusion
📌 Market remains volatile and reactive
📌 25,010 & 24,611 are the most important intraday levels
📌 Avoid trades in 24,695 – 24,847 zone
📌 Let price confirm direction, not emotions 📈
⚠️ Disclaimer
This analysis is strictly for educational purposes only.
I am not a SEBI registered analyst.
Please consult your financial advisor before taking any trades.
Market investments are subject to risk.

Symmetrical Triangle Masterpiece : Multi-Layout W,DtfStep into this dynamic multi-layout window opened right in front of you—a split-screen showcase of pure price action artistry.
Left Side: Weekly Timeframe
Here, a symmetrical triangle (a classic continuation or reversal pattern formed by two converging trendlines of equal slope) takes center stage. Framing it are a green uptrend line (connecting higher lows for bullish structure) and a red downtrend line (linking lower highs for bearish pressure), creating a tightening coil of market indecision. A subtle white counter-trend line (acting as dynamic support/resistance opposing the main trend) adds layers of geometric elegance, hinting at its heightened significance when viewed on lower timeframes.
Right Side: Daily Timeframe
Flipping to the daily chart reveals how this white line shines as a pivotal counter-trend barrier, interacting seamlessly with intraday swings. Multi-timeframe analysis (comparing higher timeframe structure with lower timeframe details for confluence) illustrates the fractal beauty......how weekly patterns cascade perfectly into daily price action without a single forecast or bias.
This is markets at their most poetic: old-school chart patterns and trendlines weaving symmetry across scales. No predictions, just appreciation for the elegance.
Disclaimer: This post is for educational and illustrative purposes only, highlighting historical price action and chart patterns. It does not constitute financial advice, trading recommendations, or predictions of future market movement. Always conduct your own research and consult a professional advisor

The Nifty Smallcap 100 index fell in five wavesThe five-wave decline in the Nifty Smallcap 100 index is an important indication of the trend. Even after the announcement of the trade deal, we do not see the index achieve more than a 61.8% retraement so far. The bounce is also abc. We need to see if we can get past and hold above 17265. If we fall from this level then another five wave decline will unfold and take the market with it.

EUR/USD – 1H EURUSD is trading at a discounted price area after a sharp impulsive sell-off, where price has swept sell-side liquidity (LA) and is now stabilizing near equal lows. The recent bearish leg looks exhaustive, suggesting downside momentum is weakening.
Price is currently holding above a key intraday demand / liquidity pocket, forming a base that favors a mean-reversion move rather than continuation lower.
Key Structure & Narrative
Sell-side liquidity taken below prior lows (LA)
Bearish impulse completed, followed by compression and basing
Discount zone respected, aligning with smart-money accumulation logic
Upside Scenario (Primary Bias)
A bullish displacement from current levels can open a path toward the prior H1 supply / imbalance zone (blue)
Acceptance above this zone may lead to a trend continuation toward the higher-timeframe premium area, with projected targets near the 1.2050–1.2080 region
Pullbacks during the move are expected to be corrective, not impulsive
Invalidation
Sustained acceptance below the liquidity sweep low would invalidate the bullish thesis and imply further downside exploration
📌 Bias: Bullish reversal from sell-side liquidity
📌 Framework: Liquidity sweep → accumulation → displacement → expansion
📌 Market State: Transition from markdown to re-accumulation

XAUUSD: Liquidity Swap Near PDL – Relief Bounce Into Sell ZoneDescription
Gold is currently trading inside a key liquidity zone after a strong bearish impulse.
Price swept sell-side liquidity and is now showing a short-term corrective bounce.
What I’m seeing:
Clear bearish market structure (lower highs & lower lows)
Price reacting from sell-side liquidity grab
PDL (Previous Day Low) acting as a magnet and reaction point
Current move looks like a retracement into supply / imbalance
Marked Liquidity Swap zone above → high probability rejection area
Expectation:
Short-term upside correction into the highlighted zone
Once liquidity is taken, continuation to the downside
Targets remain towards lower liquidity pools
Bias:
📉 Sell on rallies, not buys
⚠️ Invalidation if price holds and accepts above the liquidity zone
This is a probability-based idea, not financial advice.
Manage risk accordingly.

$BNB has officially retraced ~47% from its ATH (1374 on Oct 13CRYPTOCAP:BNB has officially retraced ~47% from its ATH (1374 on Oct 13, 2025) and just tagged the 728 zone, which is now the lowest point of this entire correction.
This level is not random. It’s where long-term structure meets fear.
Right now, price is sitting on a major decision area — and this is where smart money either defends… or steps aside.
Strong rejection from ATH → clear distribution phase
Price now below key moving averages → momentum still weak
728 = last major demand before deeper correction
🔽 Bearish continuation scenario
If 728 fails to hold convincingly:
Next downside zones open up at 650 → 530
That would confirm a deeper macro correction phase
🔼 Accumulation / long-term view
If buyers defend this zone:
This is a high-discount region compared to ATH
Ideal area for gradual accumulation, not aggressive leverage
Big coins don’t give discounts often — but they test conviction when they do.

Continuation of the Liquidity Grab concept I make educational content videos for trading, this will be a continuation of what happens after a liquidity grab in the markets
No Bias - No predications - only telling concepts and information on general trends of index

Part 3 Institutional Option Trading Vs. Techncal AnalysisOption Buyer vs Option Seller
Buyer pays premium, limited risk, unlimited profit.
Seller collects premium, limited profit, unlimited risk.
In real market volume, 80–90% of time sellers (institutions) dominate.
Expiry
Every option has a deadline (weekly, monthly).
On expiry day, option either:
ITM: Has value.
OTM: Becomes zero.

Keep MRPL on your WatchlistMRPL forming a Symmetrical Triangle Breakout Setup📈
✔️RSI above 65 and rising
✔️Trading above EMA50
✔️Volume increasing
✔️+11 months of consolidation
enter after breakout confirmation
Disc: not a recommendation. DYOR

XAUUSD/GOLD PMI NEWS FORECAST 02.02.26XAUUSD / GOLD – ISM Manufacturing PMI Trade Plan
Date: 02-02-2026
Hello traders,
Welcome back to Tamil Trading Education.
Today we are analyzing XAUUSD (Gold) based on the ISM Manufacturing PMI news.
This is a news-based breakout and retest strategy, so please avoid emotional or early entries.
🔑 Key Levels Marked on the Chart
Resistance R2 – Major upside target
Resistance R1 – Breakout decision zone
Support S1 – First downside confirmation
Support S2 – Major bearish target
We will trade only after confirmation.
📈 Scenario 1: ISM PMI is NEGATIVE (Bullish for Gold)
If the ISM Manufacturing PMI comes out negative:
Gold is expected to move upward
Wait for a clear breakout above Resistance R1
After breakout, wait for a proper retest
👉 BUY Entry:
Enter BUY only after breakout and retest confirmation
🎯 Targets:
First target near Resistance R

PTL Trade SetupCurrent Market Price (CMP): 41.50
Breakout Context: Consolidation breakout confirmed yesterday with strong volume, which adds conviction.
Target: 46.62 (approx. +12.3% from CMP)
Stop Loss: 40.03 (risk of about -3.5% from CMP)
Key Notes
- A breakout with volume often signals genuine momentum, but watch for retests of the breakout zone.
- If price dips near 41.00–40.50 but holds above stop loss, that’s a healthy retest.
- Trail your stop loss upward if price moves strongly toward the target to lock in gains.

Why Bitcoin’s Stability Is a Warning, Not StrengthBitcoin’s inability to participate in the recent “debasement trade” is not a sign of hidden strength — it’s a sign of waning relevance in the current macro cycle.
While gold and silver surged during the final euphoric phase, Bitcoin’s stagnation near $82,000 suggests that capital actively chose hard assets over digital ones, not that Bitcoin avoided speculative excess. In other words, investors didn’t “miss” Bitcoin — they rejected it.
Rather than having “less froth to shed,” Bitcoin may simply lack incremental demand. The market has already priced in its scarcity narrative, ETFs, and institutional adoption. Without a new catalyst, stability becomes distribution, not consolidation.
The idea that liquidity exiting metals will rotate into crypto assumes that Bitcoin is viewed as a safe alternative store of value. Current flows argue the opposite: in periods of uncertainty, capital is choosing tangible, historically defensive assets, not high-volatility digital instruments.
Bitcoin’s scarcity also cuts both ways. Unlike gold and silver, Bitcoin has no industrial or sovereign demand floor. If speculative demand dries up, there is nothing to absorb sell pressure. Scarcity without utility can amplify downside, not protect against it.
If the Warsh nomination triggers prolonged global liquidity tightening, Bitcoin is likely to suffer more than metals, not less. Cryptocurrencies remain among the most liquidity-sensitive risk assets. Tightening doesn’t just pressure them — it starves them.
Bottom line
Bitcoin’s calm may not be coiled strength. It may be complacency before repricing.
In this view, metals already flushed excess and proved their role. Bitcoin still has to.

NIFTY KEY LEVELS FOR 03.02.2026NIFTY KEY LEVELS FOR 03.02.2026
Timeframe: 3 Minutes
If the candle stays above the pivot point, it is considered a bullish bias; if it remains below, it indicates a bearish bias. Price may reverse near Resistance 1 or Support 1. If it moves further, the next potential reversal zone is near Resistance 2 or Support 2. If these levels are also broken, we can expect the trend.
When a support or resistance level is broken, it often reverses its role; a broken resistance becomes the new support, and a broken support becomes the new resistance.
If the range(R2-S2) is narrow, the market may become volatile or trend strongly. If the range is wide, the market is more likely to remain sideways
please like and share my idea if you find it helpful
📢 Disclaimer
I am not a SEBI-registered financial adviser.
The information, views, and ideas shared here are purely for educational and informational purposes only. They are not intended as investment advice or a recommendation to buy, sell, or hold any financial instruments.
Please consult with your SEBI-registered financial advisor before making any trading or investment decisions.
Trading and investing in the stock market involves risk, and you should do your own research and analysis. You are solely responsible for any decisions made based on this research.

Maruti Suzuki: Gearing Up for a BreakoutMaruti Suzuki (MARUTI) is currently at a strategic inflection point, exhibiting a super bullish outlook as it transitions from a traditional ICE powerhouse to an EV contender. Fundamental strength is anchored by a record-breaking Q3 FY26, where net sales surged 29% YoY to ₹475 billion. The imminent domestic launch of the e-Vitara in February 2026, supported by a ₹250 crore ecosystem investment, serves as a massive catalyst for re-rating.
Technically, despite recent short-term volatility and heavy put activity near ₹14,000, the stock remains resilient above its 200-day moving average. The surge in delivery volumes suggests strong institutional accumulation at lower levels. With the RSI approaching oversold territory on shorter timeframes, a "mean reversion" rally is highly probable.
Key Price Levels
Immediate Support: ₹14,000 – ₹14,350 (Heavy Open Interest zone)
Short-Term: ₹15,500 (Breakout above recent consolidation)
Long-Term: ₹17,500 (Alignment with historical 52-week highs and analyst consensus)
The combination of a 21% domestic volume growth and aggressive capacity expansion at Kharkhoda positions Maruti for a dominant 2026.
