IEX 1 Week Time Frame 📊 Current Context
IEX is trading around ₹138–₹142 range recently.
Short‑term technical indicators show bearish bias but mixed signals overall.
📌 1‑Week Key Levels (Support & Resistance)
📈 Resistance Levels
1. ~₹142–₹143 — Immediate resistance / pivot cluster (key short term)
2. ~₹144–₹145 — Next resistance barrier, breakout level for bullish bias
3. ~₹147–₹150 — Major weekly resistance region (higher breakout zone)
📉 Support Levels
1. ~₹138–₹140 — Immediate support zone (near current value)
2. ~₹135–₹136 — Secondary support if breakdown below immediate zone
3. ~₹133–₹132 — Stronger lower support / swing lows for the week
📍 Short‑Term Technical Sentiment
Weekly ratings suggest a sell/neutral bias, indicating pressure below key resistances.
Oscillators (RSI/MACD) also point to bearish momentum on short timeframes.
📈 Actionable Levels to Watch
Bullish scenario
A clean daily close above ₹144–₹145 increases the likelihood of an upside toward ₹147–₹150.
Bearish scenario
Sustained trading below ₹138 could accelerate selling toward ₹135–₹132.
Neutral/Consolidation
Between ₹138–₹144 may remain a tight range unless triggered by a breakout move.
Chartpatternstrading

COCHINSHIP 1 Day Time Frame Current Price (approx)
• Around ₹1,640–₹1,650 on NSE/BSE.
📈 Daily Pivot / Support & Resistance Levels
(from classic pivot / daily pivot calculations)
Pivot Point (Daily)
• 1653–1654 – central pivot reference.
Resistance Levels (Daily)
• R1: ~₹1,565–1,570
• R2: ~₹1,580–1,585
• R3: ~₹1,600–1,610
Support Levels (Daily)
• S1: ~₹1,520–1,525
• S2: ~₹1,490–1,495
• S3: ~₹1,475–1,480
These pivot‑based levels are useful for short‑term intraday or next‑session trading ranges.
📊 Alternate Daily S/R (from NSE pivot style)
(from other common pivot indicators)
Immediate Support:
✔ ₹1,530–₹1,540 zone
✔ ₹1,500–₹1,510 lower cushion
Immediate Resistance:
✔ ₹1,570–₹1,580 near‑term cap
✔ ₹1,600+ stronger barrier above
📌 How to Use These for 1‑Day Trading
Bullish setups:
• Watch for break & close above ~₹1,580–1,600 for short‑term upside continuation.
Bearish setups:
• If price breaks ₹1,520 major support, next down near ₹1,490–1,475.

360ONE 1 Day Time Frame 📊 Daily Price Range
Typical intraday range: ~₹1,124–₹1,150 (varies per session) — recent daily highs/lows seen in this band.
📈 Important Daily Support Levels
Support 1: ~₹1,134–₹1,135 — near recent intraday lows.
Support 2: ~₹1,102 — secondary downside support.
Support 3: ~₹1,084 — deeper support level if broader sell‑off unfolds.
👉 These are key levels where the stock has found buying interest on the daily chart. Breach below them may indicate more downside pressure.
📉 Important Daily Resistance Levels
Resistance 1: ~₹1,184 — immediate upside barrier.
Resistance 2: ~₹1,202 — next layer of sellers.
Resistance 3: ~₹1,234 — stronger upside pivot.
👉 These are areas where the stock may struggle to move higher on the daily timeframe.
🔧 Technical Bias on Daily Timeframe
Daily indicators (RSI, MACD, moving averages) are currently showing buy/strong‑buy signals, meaning short‑term trend is tilted bullish.
📌 Daily Pivot Reference (Approximate)
Pivot ~₹1,152–₹1,155 — central daily pivot based on recent session price action.

ASIANTILES 1 Day Time Frame 📊 Current Price Context
Asian Granito India is trading around ₹72–73 on the NSE in today’s session.
📈 1‑Day Key Levels (based on recent pivot/technical data)
🔹 Pivot Point (daily reference): ~ ₹73 (central level)
📌 Resistance Levels:
R1: ~ ₹75 – Immediate upside hurdle (recent 52‑week high area)
R2: ~ ₹77 – Secondary resistance if price breaks above R1
R3: ~ ₹79 – Extended resistance zone
📉 Support Levels:
S1: ~ ₹72 – Nearest support below the pivot
S2: ~ ₹70 – Short‑term support zone
S3: ~ ₹68 – Deeper support if market weakens
🛠️ How to Use These Levels
Bullish entry: Above the daily pivot (~₹73) with volume confirmation.
Stop loss: Below ₹70–₹68 if long.
Profit targets: ₹75 → ₹77 → ₹79 on sustained upside.

Chart Patterns CHART PATTERNS
Chart patterns represent big-picture market structures formed over dozens or hundreds of candles. They reveal accumulation, distribution, reversal, and continuation phases.
Patterns are grouped into:
A. Reversal Chart Patterns
B. Continuation Chart Patterns
C. Bilateral / Indecisive Patterns
Chart Patterns
Larger structures for strong trades
Indicate trend continuation or reversal
Higher reliability when combined with candles
Help set clear targets & stop-loss levels

Real Knowledge of Chart Patterns CHART PATTERNS (Market Structure Patterns)
Chart patterns are formed by price movements over a longer period and help traders understand the bigger picture. They indicate whether the trend is likely to continue, reverse, or break out after consolidation. These patterns can be grouped into three major categories:
1. Continuation Patterns
These suggest that the existing trend (uptrend or downtrend) will likely continue after a temporary pause.
2. Reversal Patterns
These indicate a possible change in trend direction.
3. Bilateral Patterns
These can break either up or down, signaling indecision.
Let’s study them in detail.

MCX 1 Day Time Frame 📌 MCX Latest Daily Price Snapshot
Approx. Last Traded Price: ~₹10,172 – ₹10,307 range (recent sessions)
Today’s Intraday Range: ~₹10,181 – ₹10,365 (approx)
52‑Week High: ~₹10,847 and 52‑Week Low ~₹4,408
📊 Daily Time‑Frame Levels (1D)
🔹 Pivot Point
Daily Pivot: ~₹10,386 – ₹10,442 zone (central reference)
🔸 Resistance Levels
R1: ~₹10,519 – ₹10,600
R2: ~₹10,596 – ₹10,650
R3: ~₹10,729 – ₹10,800
These levels act as potential upside barriers on daily closes. A sustained breakout above R1/R2 suggests strength into the next resistance zone.
🔻 Support Levels
S1: ~₹10,309 – ₹10,300
S2: ~₹10,176 – ₹10,170
S3: ~₹10,020 – ₹9,993
If price breaks below S1/S2 on daily close, deeper support may be tested near S3.
📈 Trend & Technical Tone
Technical indicators on daily charts signal a bullish bias / strong buy on daily based on moving averages and buy signals vs. sell signals.
📊 How to Use These Levels (1‑Day)
Bullish View
Long/buy setups near S1‑S2 with targets around R1‑R
A breakout above R2 could extend toward R3
Bearish/Correction View
Failure at R1/R2 with reversal momentum could target S1/S2

JSWENERGY 1 Day Time Frame📌 Live Price (Approx Latest)
Current price: ~ ₹478.2 – ₹478.3 per share (latest close/near real‑time) on the NSE.
Today’s range: Low ~ ₹468.3 | High ~ ₹479.9 (intraday range).
📊 Daily Key Levels (1‑Day Time Frame)
🔹 Pivot (Daily Reference)
Pivot Point: ~ ₹475.5 – central reference for daily trend.
📈 Resistance Levels
R1: ~ ₹482.7
R2: ~ ₹487.1
R3: ~ ₹494.3
(Higher resistances mark potential upside targets if the price moves up today.)
📉 Support Levels
S1: ~ ₹471.1
S2: ~ ₹463.9
S3: ~ ₹459.5
(Below these, risk of deeper pullbacks increases.)
📌 What These Levels Mean Today
✅ Bullish scenario:
A sustained trade above ₹482–₹487 could push toward ₹494+ resistance zones.
❌ Bearish scenario:
A break below ₹471 may open the path to ₹464–₹459 support.
📊 Pivot reference:
Trading above the pivot ~₹475–₹476 suggests positive short‑term bias; below it leans bearish.

JAINREC 1 Day Time Frame 📌 Latest price context:
• The stock has been trading around ₹400–₹410 in recent sessions (range today ~396.5–409) with latest close near ₹401.30.
📊 Daily Technical Levels (Approximations)
🔵 Resistance Levels
R1: ~₹418–₹420 — 1st key upside hurdle — pay attention for breakout.
R2: ~₹425–₹430 — Secondary resistance at previous reaction highs.
R3: ~₹435–₹440+ — Strong supply zone from past tops/52‑wk range.
🔴 Support Levels
S1: ~₹400–₹401 — Immediate floor pivot area around current price.
S2: ~₹390–₹392 — Near short‑term support from recent pullbacks.
S3: ~₹383–₹385 — Deeper support zone below recent correction lows.
S4: ~₹370–₹375 — Major support if price loses the current range.
📍 Daily Pivot (approx)
• Pivot ~ ₹400–₹402 — Price around this level gives neutral bias until breakout.

PFC 1 Day Time Frame 📊 Daily Pivot Levels
Pivot Point (Daily): ~₹343.00–₹343.30
Central Pivot (CPR):
• Top: ₹343.60
• Mid: ₹343.00
• Bottom: ₹342.40
📈 Resistance Levels (Daily)
R1: ~₹344–₹346
R2: ~₹347–₹348
R3: ~₹350–₹351
📉 Support Levels (Daily)
S1: ~₹338–₹341 (minor support)
S2: ~₹335–₹337
S3: ~₹332–₹334
🔍 Intraday Range to Watch
Near‑term range: ₹337–₹354, with crucial rejection/resume zones at ~₹337 (support) and ~₹352–₹354 (upper resistance).
📌 How to Use These Levels
Bullish breakout: Sustained close above the pivot ~₹343 with volume could target R1 → R2 (~₹347–₹350).
Bearish continuation: Failure below S1 (~₹338–₹341) increases odds of a drop toward S2/S3 (~₹335 / ₹332).
Pivot flips: Pivot pivots often act as support if price stays above, and as resistance if below.

RIL 1 Day Time Frame 📊 Current Price Context (approx):
RIL is trading near ₹1,540 – ₹1,550 intraday range today.
📈 1‑Day Resistance Levels
These are levels where the stock may face selling pressure or pause on the upside:
Intraday Daily Resistances (Pivots & Speed Levels):
R1: ~₹1,549 – ₹1,550
R2: ~₹1,557 – ₹1,557
R3: ~₹1,562 – ₹1,563
(above current price)
Extended intraday pivot R4 (if breakout):
~₹1,570+ (from broader pivot series)
📉 1‑Day Support Levels
Key levels where buyers may step in on dips:
Intraday Daily Supports:
S1: ~₹1,536 – ₹1,537
S2: ~₹1,531 – ₹1,532
S3: ~₹1,523 – ₹1,524
(below current price)
Weekly pivot support band (if selling accelerates):
Around ₹1,531 – ₹1,505+ (broader support zone)

IOC 1 Month Time Frame 📊 Current Context
IOC is trading around the ₹166–₹168 range as of mid‑December 2025.
Over the last month, the stock has seen a slight decline (~‑2.7% to ‑3.6% depending on source).
🟢 Key 1‑Month Support Levels
These are levels where the price may find buying interest if the stock pulls back:
✅ Primary Support: ~₹164–₹162
➡️ Near recent lows and pivot zone where short‑term buyers could step in.
✅ Lower Support: ~₹160–₹158
➡️ Broader support band from slight chart congestion.
⚠️ Deep Support: ~₹138–₹135
➡️ A deeper correction zone identified by longer‑term indicators — likely only relevant if broader markets turn very weak.
🔴 Key 1‑Month Resistance Levels
These are price points that may cap upside near‑term:
🚧 Immediate Resistance: ~₹170–₹171
➡️ Short‑term hurdle around recent highs.
🚧 Next Resistance: ~₹172–₹173
➡️ Slightly stronger resistance if stock breaks above ₹171.
🚧 Higher Resistance: ~₹176–₹177+
➡️ Breakout zone toward the upper end of the near‑term range.

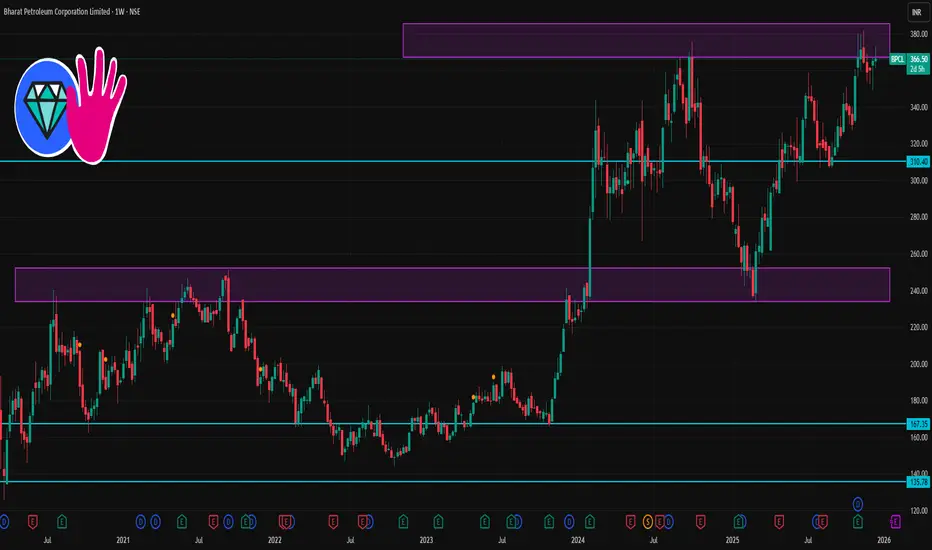
BPCL 1 Week Time Frame 📌 Current Price Context (approx):
BPCL is trading around ₹360–₹366 on NSE in recent sessions.
📈 1-Week Key Levels (Weekly Timeframe)
🔹 Resistance Levels (Upside Targets)
These are important zones where price may pause or reverse if buying pressure weakens:
~₹370–₹372 — Immediate weekly resistance zone where bulls face first hurdle.
~₹374–₹378 — Secondary resistance range on strength.
~₹380+ — Major resistance (also near recent 52-week highs).
Break above ~372–378 with volume could lead to continuation toward higher weekly targets.
🔻 Support Levels (Downside Floors)
These are key support zones where buying interest may emerge:
~₹357–₹360 — Immediate first support — closely aligned with current trading range.
~₹353–₹355 — Next support zone if price dips further.
~₹347–₹350 — Stronger weekly support — break below here could signal deeper correction.
Sustained holds above ~357–360 reinforce bullish/momentum bias on the weekly chart.
IRFC 1 Day Time Frame 📊 Current Price Context
Recent IRFC price ~ ₹112–₹114 (NSE) as of mid-Dec 2025.
📉 Daily Support & Resistance Levels
🔹 Daily Pivot Levels
These are typical daily pivot points used by traders:
Support
S1 ~ ₹112.6–₹113.0
S2 ~ ₹112.0–₹112.6
S3 ~ ₹111.4–₹112.0
(Support zones where price may find buying interest)
Pivot / Median
Pivot ~ ₹113.5–₹116.6
(If price stays above pivot – short-term bullish bias; below pivot – bearish bias)
Resistance
R1 ~ ₹113.7–₹114.0
R2 ~ ₹115–₹117
R3 ~ ₹118–₹119+
(Levels where selling pressure may emerge)
📌 How to Use These Levels
Bullish scenario (short trades):
Break above ₹116–₹118 may open resistance at ₹120+
Bearish scenario:
A break below ₹112 → ₹111 opens the path toward lower support ~ ₹108–₹110 (near recent swing lows).

Chart Patterns Financial markets speak a language of price. Every movement on a chart represents the collective psychology of millions of participants—institutions, traders, investors, algorithms, and speculators. Chart patterns and candlestick patterns are the visual translation of this psychology. They do not predict the future with certainty, but they provide probabilistic insights into market behavior, trend continuation, reversals, and momentum shifts. Mastering them allows traders to read price action with clarity, discipline, and confidence.

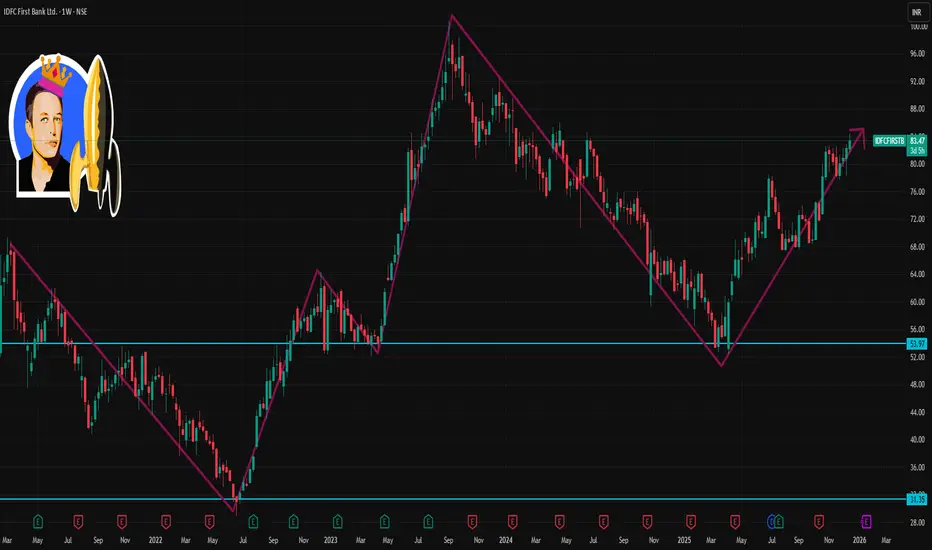
IDFCFIRSTB 1 Week Time Frame 📊 Weekly Support & Resistance Levels
Weekly Resistance Levels
R1: ~₹83.96 — immediate weekly resistance (key breakout level)
R2: ~₹85.63 — next major resistance
R3: ~₹88.44 — extended upside if trend is strong
Weekly Support Levels
S1: ~₹79.48 — first strong weekly support
S2: ~₹76.67 — secondary support zone
S3: ~₹75.00 — deeper support if weakness accelerates
Weekly Pivot (approx central point)
Around ₹81.15–₹81.72 based on weekly pivot analysis
📌 Key Reference Price Context
The stock is currently trading around ₹83‑₹84 on the NSE (Dec 16, 2025).
52‑week range is roughly ₹52.46 low to ~₹84.4 high; price is near its yearly peak.
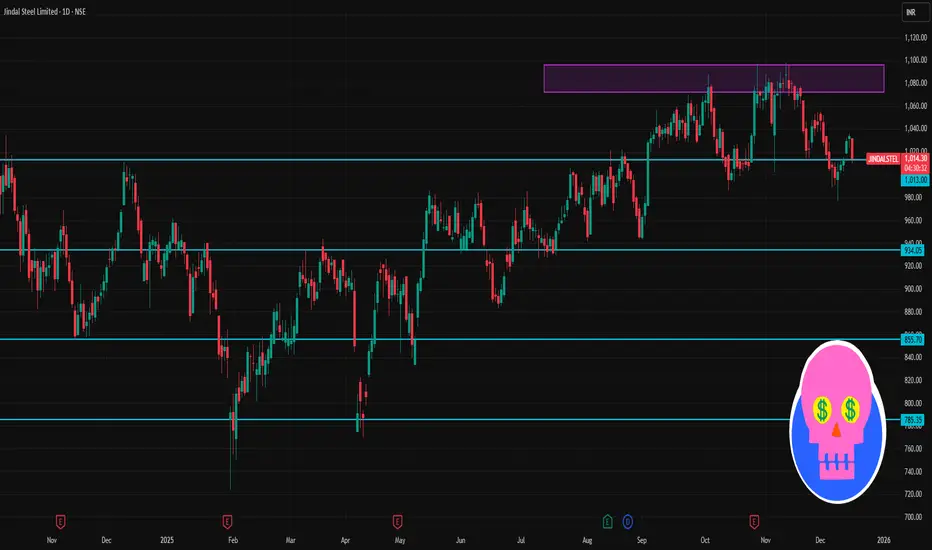
JINDALSTEL 1 Day Time Frame 📊 Daily Pivot & Key Levels
Pivot Point (Reference): ~₹1,010–₹1,010.27
(This is the central level where direction bias flips intraday.)
🔼 Resistance Levels
R1: ~₹1,017.9 – ₹1,018 📈
R2: ~₹1,022.9 – ₹1,041 📈
R3: ~₹1,030.6 – ₹1,049.9 📈
(Breaking and holding above these can signal bullish strength.)
🔽 Support Levels
S1: ~₹1,005.2 – ₹1,006.2 📉
S2: ~₹997.5 – ₹1,012 📉
S3: ~₹992.5 – ₹1,006 📉
(These act as downside cushions — watch for bounces or breakdowns.)
📈 Short‑Term Bias & Indicators
Moving Averages: Near current price, shorter and medium SMAs/EMAs are tight — indicating potential range trading unless breakout occurs.
RSI: Around neutral (~49), not strongly overbought/oversold.
📊 How Traders Use These
Bullish Scenario: Price sustaining above Pivot → target R1 ➜ R2 ➜ R3.
Bearish Scenario: Price breaking below Pivot → test S1 ➜ S2 ➜ S3.
Range Trades: Buy near supports with stop just below; sell near resistance with stop just above.
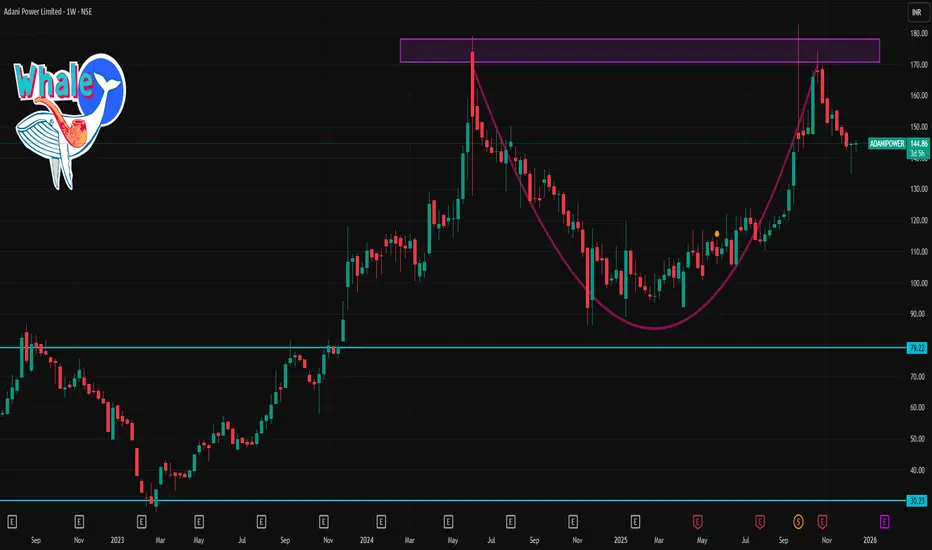
ADANIPOWER 1 Week Time Frame 📊 Current price context
• Share price is around ₹144–₹146 per share (as of latest session).
📈 Resistance Levels (Upside)
These are prices where the stock may face selling pressure or pause before further upmove:
1. ~₹147–₹149 — near short-term resistance cluster.
2. ~₹150–₹153 — pivot/fib resistance from short-term charts.
3. ~₹160–₹165/₹170 — higher target zone if bullish momentum strengthens.
➡️ If the price breaks above ₹150–₹153 with good volume, next upside could test ₹160+ over the week.
📉 Support Levels (Downside)
These are price zones that might act as demand zones if declines occur:
1. ~₹142–₹143 — immediate support from recent pivot levels.
2. ~₹140–₹139 — deeper support if weakness persists.
3. ₹135–₹134 (Lower) — secondary support seen in broader fib/pivot analysis.
➡️ A close below ₹142–₹140 could open the path toward ₹135+ on short-term weakness.
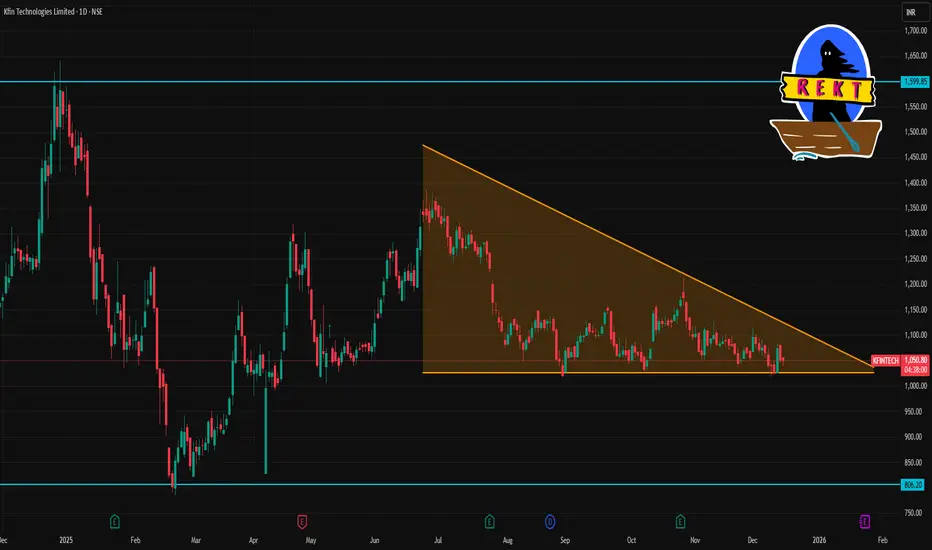
KFINTECH 1 Day Time Frame 📌 Live Price Context
Current price: ~₹1,051.7 on NSE (latest update)
Today’s range: ~₹1,045.6 (low) — ₹1,081.5 (high)
📊 Daily Pivot Support & Resistance (Accurate Today)
Level Price (₹)
R3 ₹1,109.50
R2 ₹1,095.50
R1 ₹1,073.60
Pivot ₹1,059.60
S1 ₹1,037.70
S2 ₹1,023.70
S3 ₹1,001.80
📌 Key Levels to Watch Today
🔺 Upside Resistances
Immediate resistance: ~₹1,073–₹1,095
Strong resistance area: ~₹1,095–₹1,109
🔻 Downside Supports
Near support: ~₹1,037–₹1,023
Lower support zone: ~₹1,001 and below
BAJFINANCE 1 Week Time Frame 📍 Current Price (Approx)
₹1,015 – ₹1,018 range on NSE as of latest close.
📊 Weekly Timeframe Levels (Support & Resistance)
🔹 Weekly Pivot‑Based Levels
(Using weekly pivot calculations — more relevant for weekly timeframe traders)
Resistance
R1: ~₹1,004 – ₹1,018
R2: ~₹1,018 – ₹1,034
R3: ~₹1,034 – ₹1,042
Pivot Zone / Mid
Weekly Pivot: ~₹988 – ₹992
Support
S1: ~₹973 – ₹986
S2: ~₹957 – ₹973
S3: ~₹943 – ₹957
📌 Key Weekly Range: approximately ₹973 – ₹1,042.

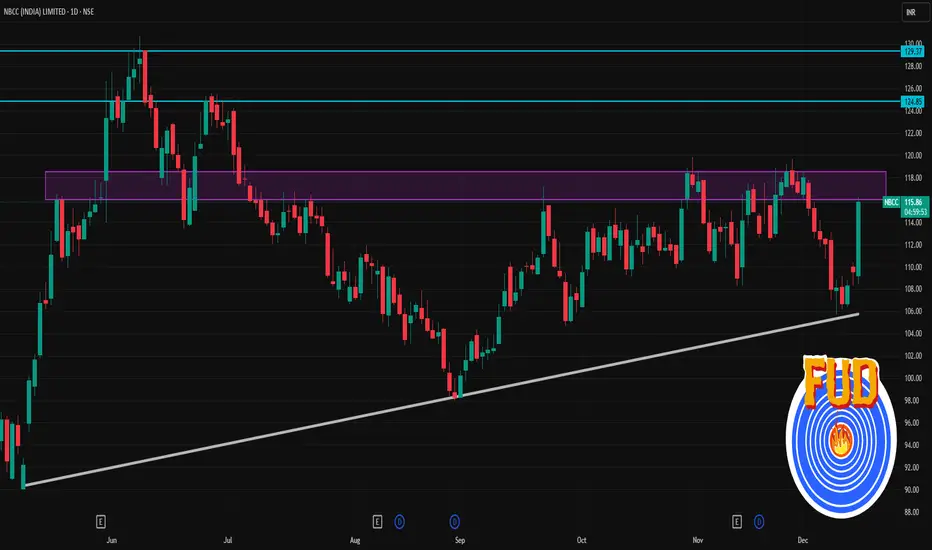
NBCC 1 Day Time Frame 📊 Daily Levels (1D Timeframe)
Current approximate price: ~₹108-110 on NSE (recent session data)
📈 Resistance Levels
R1: ~₹108.7–110.3 (intraday pivot/Bollinger & near recent highs)
R2: ~₹112.3 (upper BB)
R3: ~₹113+ & above recent short-term zone highs
Important psychological/near-term resistances to watch: ~₹112–115 area (previous consolidation zone).
📉 Support Levels
S1: ~₹106.3–106.9 (near pivot S2/Bollinger)
S2: ~₹105.3 (pivot S3 area)
S3: ~₹98–100 (broader confirmed support from recent ranges)
Below ~₹105, structure weakens toward the ~₹98 area, which has acted as support in prior daily ranges.
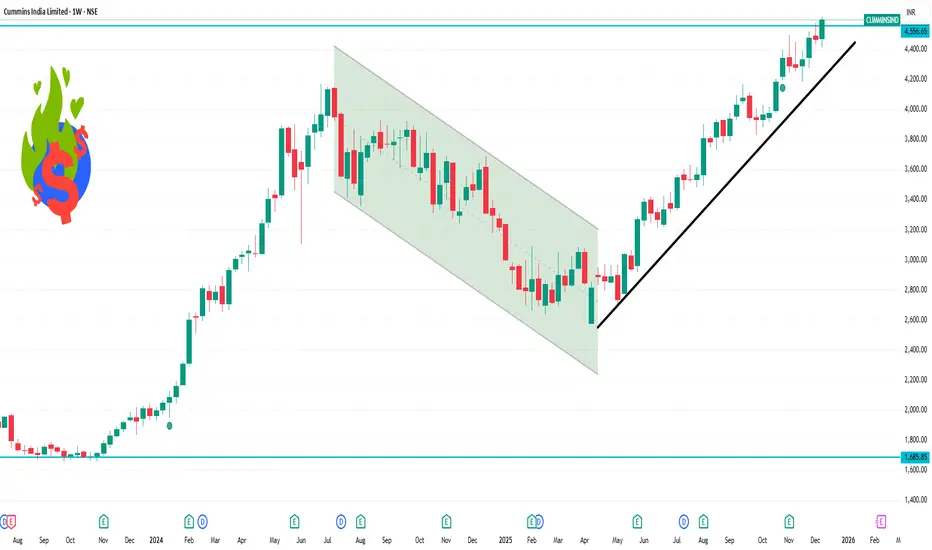
CUMMINSIND 1 Week Time Frame 📌 Current Price Snapshot
Latest price (approx): ₹4,600 on NSE close.
52-week high: ~₹4,615.
Strong upward momentum with price near highs.
📊 Weekly Support & Resistance Levels (Important)
📈 Weekly Resistance (Upside Targets)
R1: ~₹4,720 – ₹4,740 (moderate resistance near recent high zone)
R2: ~₹4,850 – ₹4,880 (extension above new 52-wk high)
📉 Weekly Support (Downside Zones)
S1: ~₹4,520 – ₹4,540 (immediate near current price support)
S2: ~₹4,430 – ₹4,450 (next key support, ~1.5–3% below current)
S3: ~₹4,300 (deeper weekly support if broader market weakens)
➡️ A break above ₹4,740 suggests continuation of current strength.
➡️ A sustained break below ₹4,520–₹4,500 increases risk of correction.
These weekly range levels are derived from pivot interpretations and recent weekly price behaviour.
Premium Chart Patterns Rules for Trading Chart Patterns
Wait for confirmation
Don’t assume a breakout. Always wait for a close beyond the breakout level.
Use volume confirmation
High volume strengthens signals.
Trade only strong patterns
Avoid weak, uneven, unclear structures.
Always check market trend
Pattern reliability increases in the direction of trend.
Use stop-loss
Set SL below support (bullish) or above resistance (bearish).
Measure target using pattern height
Many patterns provide measurable targets.
Combine with indicators
RSI, EMA, MACD improve accuracy.
