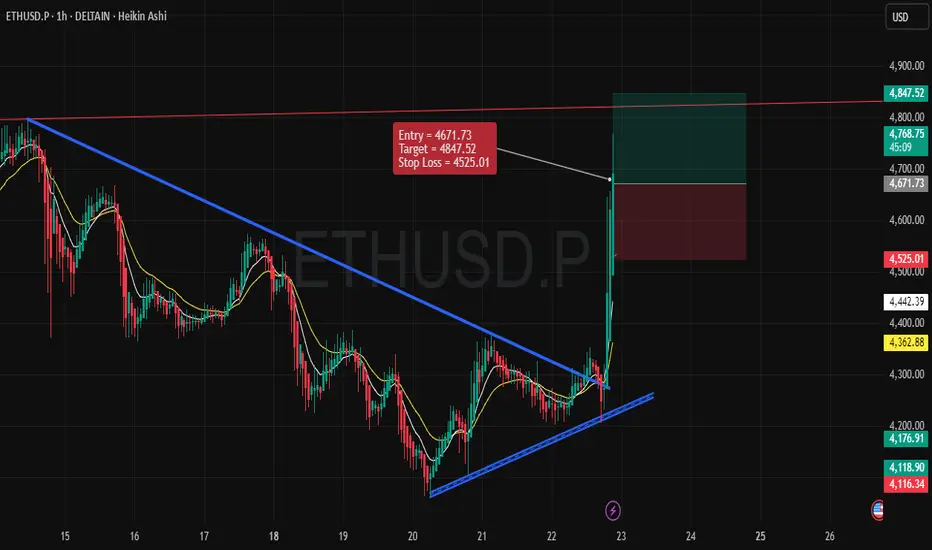
Bullish Scenario for ETH/USD (1-Hour Time Frame)Entry Point: 4671.73
Stop Loss: 4525.01
Target (Take Profit): 4847.52
1. Price Structure and Trend:
The price has been moving within a well-defined downtrend, but there has been a noticeable shift. The recent breakout above the blue trendline signals a potential reversal from a bearish to a bullish trend.
This breakout indicates increased buying interest, suggesting that ETH/USD might continue its upward momentum in the short term.
2. Key Levels:
Support Level: The price has recently bounced off a support zone near 4525, which acts as the stop loss level. A strong bounce from this point further validates the bullish outlook.
Resistance Level: The target price of 4847.52 is placed near a resistance zone, which represents the next major hurdle for ETH/USD.
3. Entry Strategy:
The entry point is placed at 4671.73, just after the breakout above the blue trendline, where the price is gaining upward momentum.
The market seems to have found new buying strength after consolidating, which strengthens the case for a potential move to the target level.
4. Risk-to-Reward Ratio (RRR):
The risk-to-reward ratio for this trade is favorable, with a potential gain of around 175 points (4847.52 - 4671.73) against a risk of approximately 146.72 points (4671.73 - 4525.01). This results in a solid 1:1.2 RRR, which is a reasonable expectation for this bullish trade.
5. Indicators and Confirmation:
The chart features moving averages (yellow and white lines) indicating a shift from a bearish trend to a bullish phase.
The price action shows strong buying pressure, especially with the recent candlestick pattern, confirming the breakout and trend continuation.
6. Conclusion:
With a confirmed breakout, an entry at 4671.73 offers a great opportunity for a bullish move towards the target of 4847.52. The stop loss is safely placed at 4525.01, considering recent support.
This trade setup appears well-aligned with the current market conditions and technical indicators, making it a logical and worthwhile trade idea.
Chartpatterntrading
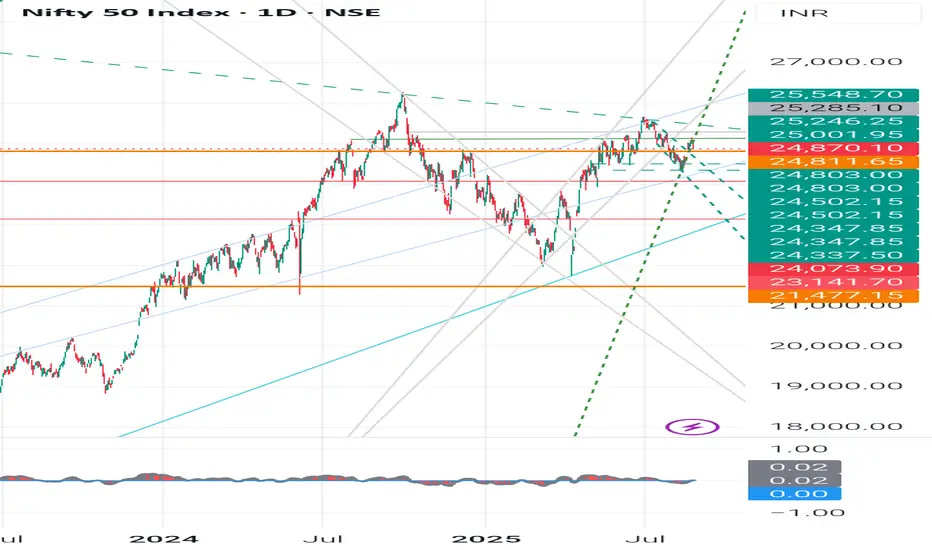
Nifty 50 - Technical Chart Pattern Analysis, With LevelsNifty 50 - Technical Chart Analysis (as per Daily chart)
Current Price (CMP): 25,070
Trend: Sideways consolidation between 24,500 - 25,500 levels.
Chart Pattern:
Multiple tests of 25,500 - strong resistance.
Multiple supports around 24,500 - 24,800 - strong demand zone.
The broad pattern looks like a Rectangle / Range-bound movement.
Swing Analysis:
Higher swing lows visible after 24,000 - bullish undertone.
Lower swing highs at 25,500 - supply pressure.
Key Levels
- Immediate Resistance: 25,250 - 25,550 - 26,000
- Immediate Support: 24,800 - 24,500 - 24,073
Major Support: 23,141 - 21,477 (long-term trend support)
👉Candlestick Learnings (Recent Pattern)
Recent candles show long wicks both sides - market indecision (buyers & sellers fighting).
A strong green bullish engulfing candle near 24,500 support - sign of buyers stepping in.
Current candles forming inside bars - breakout move expected soon (either above 25,500 or below 24,500).
✍️Student Learning Point:
When candles show long wicks near support - it signals accumulation.
When candles cluster near resistance - expect breakout/reversal.
Always confirm with volume before taking position.
Fundamental Comparison - Nifty Competitors (Index Peers)
Since Nifty 50 is an index, let’s compare with other global indices (macro investing perspective):
Index P/E Ratio Dividend Yield 5Y CAGR Returns Volatility
Nifty 50 -22-23 -1.2% -13% Moderate
Sensex -24 -1.1% -12% Moderate
Dow Jones -21 -1.7% -9% Lower
Nasdaq 100 -28 -0.9% -15% High
Shanghai Comp -17 -2.0% -5% Moderate
Learnings:
Nifty has a healthy P/E (not cheap, not too expensive).
Growth rate is higher than global averages - India is attractive long-term.
Volatility is moderate, making Nifty good for SIP investors & long-term compounding.
Investment Learnings for Students
1. Candlestick Patterns: Learn basics like Doji, Engulfing, Hammer, Shooting Star - they often show reversal/continuation.
2. Swing Analysis: Markets move in swings (higher highs/lows in uptrend, lower highs/lows in downtrend). Recognizing them helps in entry/exit.
3. Support & Resistance: Always mark key levels before trading/investing.
4. Fundamentals: Don’t just look at charts - check P/E, dividend yield, EPS growth, sector weightage.
5. Risk Management: Use stop-loss in trading. For investing, use SIP & diversify.
⚠️ Disclaimer
This analysis is for educational purposes only. Not a SEBI-registered advisory. Students & investors should do their own research or consult a financial advisor before making decisions.
#Nifty50 #StockMarketIndia #TechnicalAnalysis #InvestingForBeginners #CandlestickPatterns #SwingTrading #SupportAndResistance #StockMarketEducation #MarketLearning
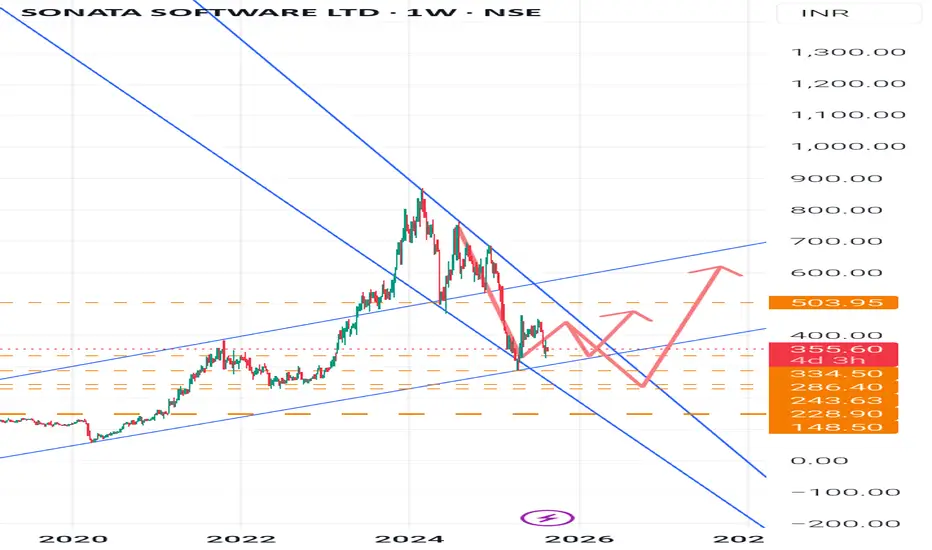
Sonata Software Ltd- Trend and chart pattern analysisSonata Software Ltd-
technical + fundamental analysis based on chart and industry outlook 👇
Technical Chart Analysis (Weekly Chart)
Current Price: 356.40
Trend: The stock had a steep rally till 1,200 and then corrected sharply into a downtrend channel. Now it is stabilizing and attempting a base formation.
- Support Levels
334 - immediate support
286 - strong support zone
243 - medium-term support
228 - long-term crucial base
148 - major bottom support
- Resistance Levels
400 - near-term hurdle
503 - key weekly resistance (breakout confirmation if crossed)
600 - medium-term target if trend sustains
700+ - only after strong momentum breakout
- Chart Pattern
Stock is currently consolidating between 330-400.
Possible formation of a W-bottom / double bottom, if 330-334 holds.
A sustained move above 503 could trigger a trend reversal rally toward 600-700.
If it breaks below 286, weakness may extend to 243/228 zone.
🏢 Business & Competition
Sonata Software operates in IT services, cloud, and digital transformation. It earns revenues from export-oriented IT services, particularly in Microsoft ecosystem solutions.
- Key Competitors
Mid-cap IT peers: Mphasis, L&T Technology, Persistent Systems, Coforge, Birlasoft, Mindtree (merged into LTIMindtree).
Sonata is relatively smaller in scale compared to peers but has a niche in Microsoft Dynamics 365 solutions.
📈 Fundamental Ratios (Latest available FY24 data)
Market Cap: 9,500 Cr
P/E Ratio: 27 (mid-cap IT avg. 30-35) - slightly undervalued compared to peers
ROE (Return on Equity): 25% - very strong
ROCE (Return on Capital Employed): 30% - efficient capital use
Debt-to-Equity: 0.05 - virtually debt-free
Dividend Yield: 1.5% - decent payout for investors
Revenue Growth (3Y CAGR): 15-18%
EPS Growth (3Y CAGR): 20%
👍 Investment View
Technicals: Base building in progress. Sustaining above the 400-503 zone is crucial for the next uptrend.
Fundamentals: Strong ROE/ROCE, debt-free, consistent dividend payer. Attractive in mid-cap IT basket.
Risks: Global IT slowdown, client concentration risk, strong USD-INR dependency.
👉Disclaimer
This analysis is for educational & informational purposes only.
It is not financial advice or a buy/sell recommendation.
Stock markets are subject to risks - please consult your financial advisor before making any investment decisions.
#sonatasoftware #trendanalysis #chartpattern
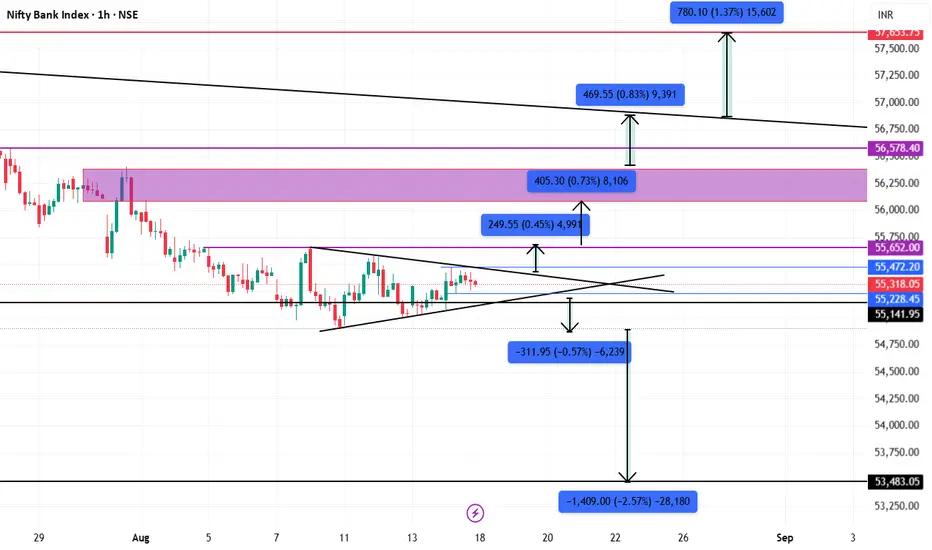
banknifty chart analysis newbanknifty pure price action chart analysis. you can see how
will banknifty move....see chart you can understand.
Indian Bank - Long Setup, Move is ON...#INDIANB trading above Resistance of 427
Next Resistance is at 665
Support is at 299
Here are previous charts:
Chart is self explanatory. Entry, Resistances and Support are mentioned on the chart.
Disclaimer: This is for demonstration and educational purpose only. This is not buying or selling recommendations. I am not SEBI registered. Please consult your financial advisor before taking any trade.

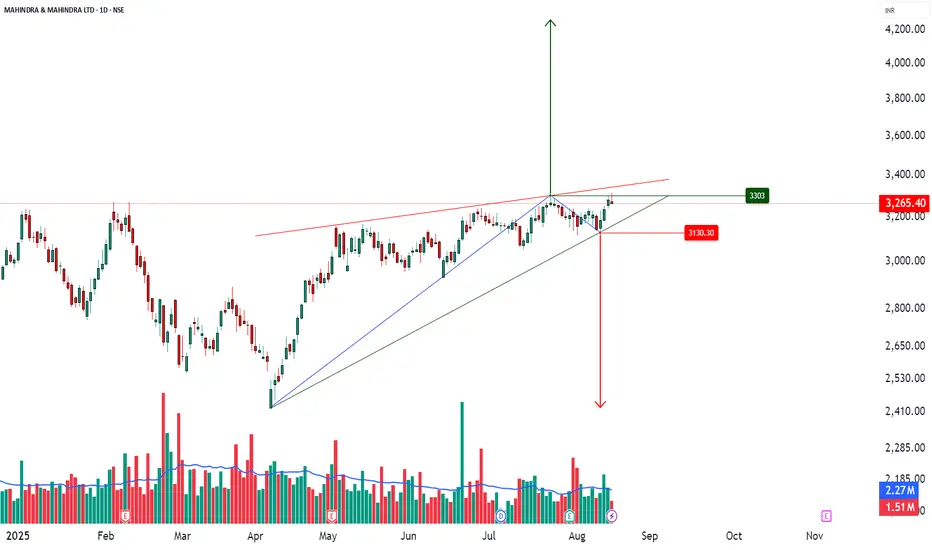
M&M _ Rising Wedge Formation📊 M&M – Technical & Educational Snapshot
Ticker: NSE: M&M | Sector: 🚙 Auto
CMP: ₹2,7XX (as of 16 Aug 2025)
Rating (for learning purpose): ⭐⭐⭐⭐
Pattern Observed: 📉 Rising Wedge Formation (Bearish Reversal Case Study)
🔑 Key Reference Levels (For Learning)
Support / Breakdown Zone: Lower wedge trendline
Resistance / Rejection Zone: Upper wedge trendline
Bearish Projection (Case Study): ~₹2,410
Bullish Continuation (Alternative View): ~₹3,300
📌 Pattern Observations
✅ Price forming higher highs & higher lows but within converging trendlines
✅ Momentum slowing → smaller swings inside wedge
✅ Typical bearish reversal structure (confirmation needed)
✅ Volume + RSI divergence can add conviction
📝 STWP Trade Analysis (Educational Illustration Only)
1️⃣ Bearish Breakdown (Primary Scenario)
Observation: Breakdown below wedge support often studied as bearish signal
Stop Loss (Learning Reference): Above upper wedge / recent swing high
Downside potential: ₹2,410 (measured move projection)
2️⃣ Bullish Breakout (Alternative Scenario)
Observation: Breakout above wedge resistance may lead to continuation
Stop Loss (Learning Reference): Below wedge / recent swing low
Upside potential: ₹3,300
📊 Risk Management & Confirmation
Traders typically wait for daily close outside wedge boundaries
Volume confirmation is key → spikes above average strengthen the move
RSI divergence often adds confidence to the setup
📌 Summary (Learning View Only)
The M&M Rising Wedge is a classic reversal study.
Key lesson: A wedge pattern teaches how slowing momentum can shift market control — but confirmation with volume + price close is essential before validating either direction.
⚠️ Disclaimer – Please Read Carefully
The information shared here is meant purely for learning and awareness. It is not a buy or sell recommendation and should not be taken as investment advice. I am not a SEBI-registered investment advisor, and all views expressed are based on personal study, chart patterns, and publicly available market data.
Trading — whether in stocks or options — carries risk. Markets can move unexpectedly, and losses can sometimes be larger than the money you have invested. Past performance or past setups do not guarantee future results.
If you are a beginner, treat this as a guide to understand how the market works — practice on paper trades before risking real money. If you are an experienced trader, remember to assess your own risk, position sizing, and strategy suitability before entering any trade.
Consult a SEBI-registered financial advisor before making any real trading decision.
By reading, watching, or engaging with this content, you acknowledge that you take full responsibility for your own trades and investments.
________________________________________
💬 Found this useful?
🔼 Give this post a Boost to help more traders discover clean, structured learning.
✍️ Drop your thoughts, questions, or setups in the comments — let’s grow together!
🔁 Share with fellow traders and beginners to spread awareness.
✅ Follow simpletradewithpatience for beginner-friendly setups, price action insights & disciplined trading content.
🚀 Stay Calm. Stay Clean. Trade With Patience.
Trade Smart | Learn Zones | Be Self-Reliant 📊
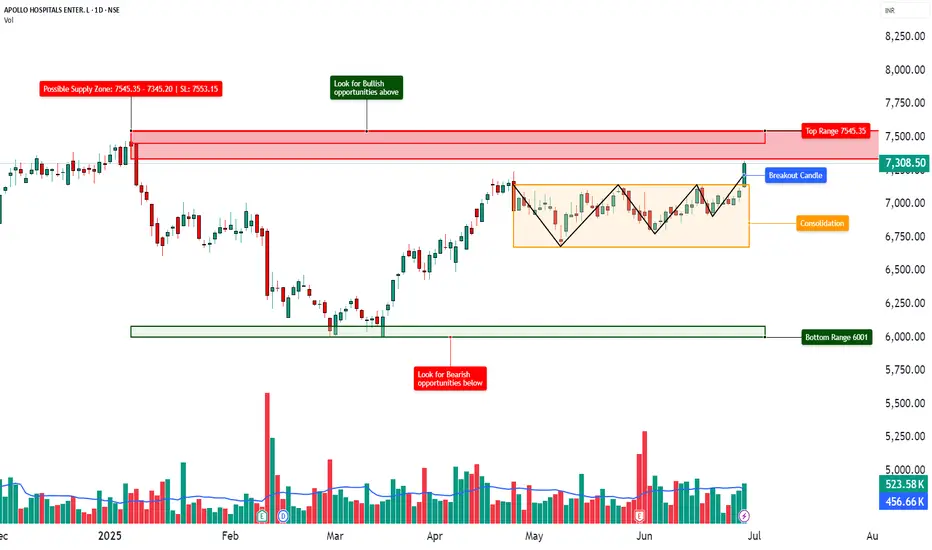
APOLLOHOSP - TECHNICAL ANALYSIS________________________________________________________________________________
📈 Apollo Hospitals Enterprises Ltd. (APOLLOHOSP) – TECHNICAL ANALYSIS
📆 Date: June 28, 2025 | Timeframe: Daily Chart
🔍 For Educational Purposes Only
________________________________________________________________________________
📊 Structure Overview
• Pattern: Rounded "W" Base Breakout
• Breakout Level: ₹7,324
• Current Price: ₹7,308.50 (pullback after breakout)
• Volume: 523.58K vs avg. 456.66K – confirming breakout strength
• Trend Bias: Bullish (as long as price sustains above ₹7,176–₹7,043)
________________________________________________________________________________
📌 Key Zones
🔺 Top Range Resistance: ₹7,545.35
📛 Possible Supply Zone: ₹7,545.35–₹7,345.20 | SL: ₹7,553.15
🟧 Consolidation Zone: ₹6,750–₹7,300
🟩 Demand Support: ₹7,176 / ₹7,043 / ₹6,969
🔻 Bottom Support Range: ₹6,001 (long-term demand base)
Resistance Levels:
• ₹7,382.5
• ₹7,456.5
• ₹7,589.0
Support Levels:
• ₹7,176.0
• ₹7,043.5
• ₹6,969.5
________________________________________________________________________________
🧠 Technical Signals
✔️ Rounded W pattern breakout
✔️ Bollinger Band expansion (BB Squeeze OFF)
✔️ RSI around 62 – showing strength
✔️ SuperTrend & VWAP supportive during breakout
✔️ Sectoral tailwind: Hospitals gaining traction in current market narrative
________________________________________________________________________________
🎯 STWP Educational Trade Plan (For Study Only)
• Entry (Breakout Retest): ₹7,324
• Stop Loss: ₹6,989
• Risk: ₹335/share
• Position Size: 50 shares
• Risk-Reward Ratio: 1:1 | 1:2+
📌 Setup Logic: Volume-backed W Breakout + Consolidation Range Break + Sector Strength
________________________________________________________________________________
⚠️ Cautionary Notes
• Breakdown below ₹7,043 = weakening structure
• If price gets rejected at ₹7,456, sideways action likely
• Always track volume + RSI for divergence signs
________________________________________________________________________________
📢 Disclaimer
This is a study-based chart analysis shared for educational purposes only. It is not a buy/sell recommendation. The author is not SEBI-registered. Please consult a SEBI-registered advisor before making any investment decisions.
________________________________________________________________________________
💬 Your Turn:
Do you think ₹7,545 will break or will price revisit ₹7,000 first?
👇 Drop your view or chart in the comments — let’s grow together!
________________________________________________________________________________
STWP | Learn. Trade. Grow.
________________________________________________________________________________
Godfrey Phillips India - Breakout Setup, Move is ON...#GODFRYPHLP trading above Resistance of 6771
Next Resistance is at 9804
Support is at 4339
Here are previous charts:
Chart is self explanatory. Levels of breakout, possible up-moves (where stock may find resistances) and support (close below which, setup will be invalidated) are clearly defined.
Disclaimer: This is for demonstration and educational purpose only. This is not buying or selling recommendations. I am not SEBI registered. Please consult your financial advisor before taking any trade.

XAUUSD Gold Trading Strategy August 1, 2025:
Yesterday's trading session, gold prices recovered to the 3315 area and then continued to decrease to the 3281 area. Currently, gold prices are fluctuating quite unpredictably due to the impact of tariff news and investor confidence.
Basic news: The Federal Reserve FED continues to maintain the federal funds benchmark interest rate in the range of 4.25% - 4.50%, in line with policy since 2025. Chairman Powell did not give any signal about the next interest rate cut on September 16 - 17.
Technical analysis: After falling sharply to the 3269 area, gold prices are showing signs of recovery. In the current downtrend channel, there has been a higher bottom than the bottom at H1. We can see that if the bullish pattern at H1 is confirmed, combined with the reversal candlestick appearing at H4, the possibility of gold bouncing back to reach the resistance area of 3330, even 3350 is completely possible. In the weekend trading session, we will wait at the support zones to trade.
Important price zones today: 3280 - 3285 and 3269 - 3274.
Today's trading trend: BUY.
Recommended orders:
Plan 1: BUY XAUUSD zone 3283 - 3285
SL 3280
TP 3288 - 3300 - 3310 - 3330.
Plan 2: BUY XAUSD zone 3269 - 3271
SL 3266
TP 3274 - 3284 - 3300 - 3320.
Wish you a safe, favorable and profitable trading day.🥰🥰🥰🥰🥰

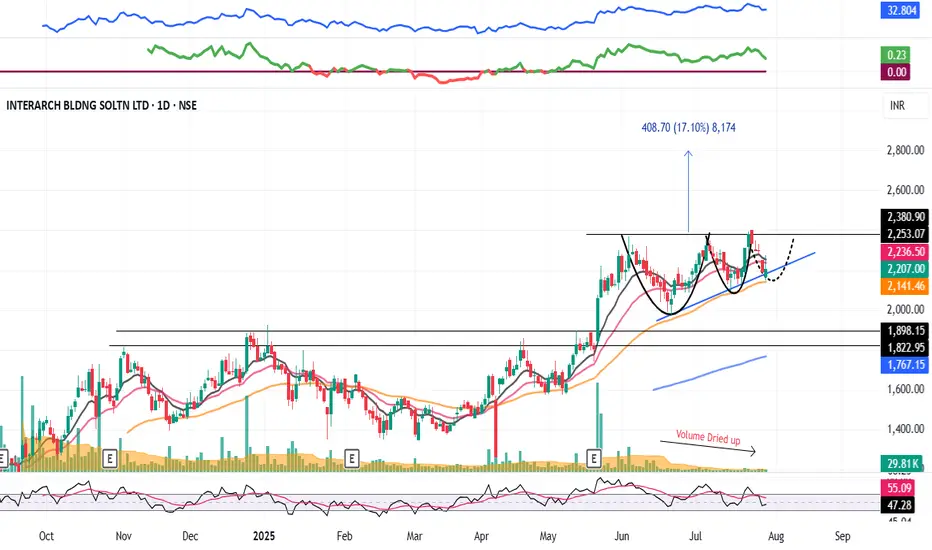
INTERARCH : Swing Pick (1-3 Months)#INTERARCH #vcppattern #chartpattern #ascendingtrianglepattern #breakoutstock #patterntrading #Swingtrading
INTERARCH : This will test Patience
>> VCP formation in process
>> Ascending Triangle forming
>> Breakout candidate
>> Good Strength & Volumes Dried up
>> Trending Stock in consolidation
Swing Traders can lock profits at 10% & Keep Trailing
Pls Comment , Boost and Follow for more such Analysis
Disc : Charts shared are for Learning Purpose and not a Trade recommendation, Consult your Financial advisor or a SEBI Registered Advisor before taking position in it.
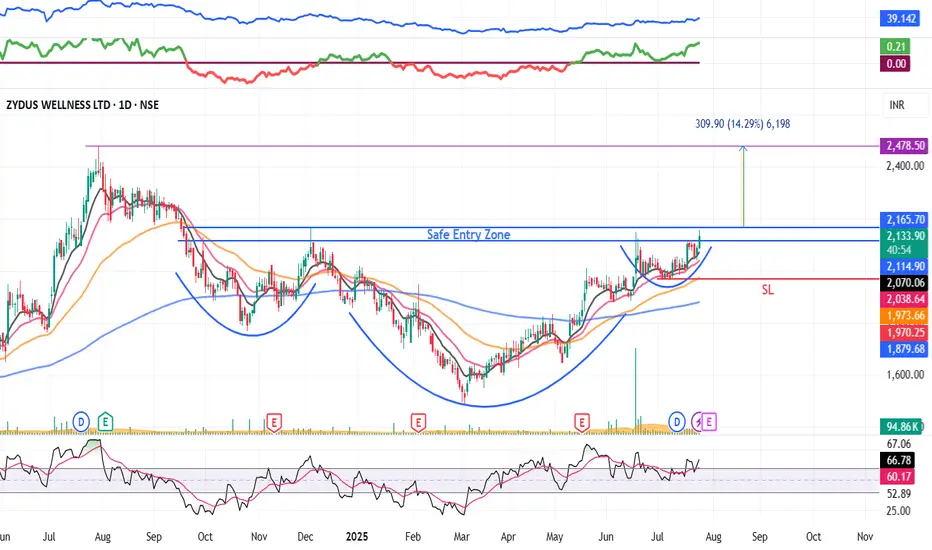
ZYDUSWELL : Inverse Head & Shoulder chart pattern#ZYDUSWELL #patterntrading #chartpattern #breakouttrading #inverseheadandshoulder #trendingstock
ZYDUSWELL : Swing Trade
>> Breakout candidate
>> Inverse Head & shoulder pattern
>> Trending stock
>> Good Strength & Volume
Swing Traders can lock profit at 10% and keep trailing
Pls comment, Boost & follow for more such Analysis
Disc : Charts shared are for Learning purpose and not a Trade recommendation. Consult a SEBI Registered advisor before taking position in it
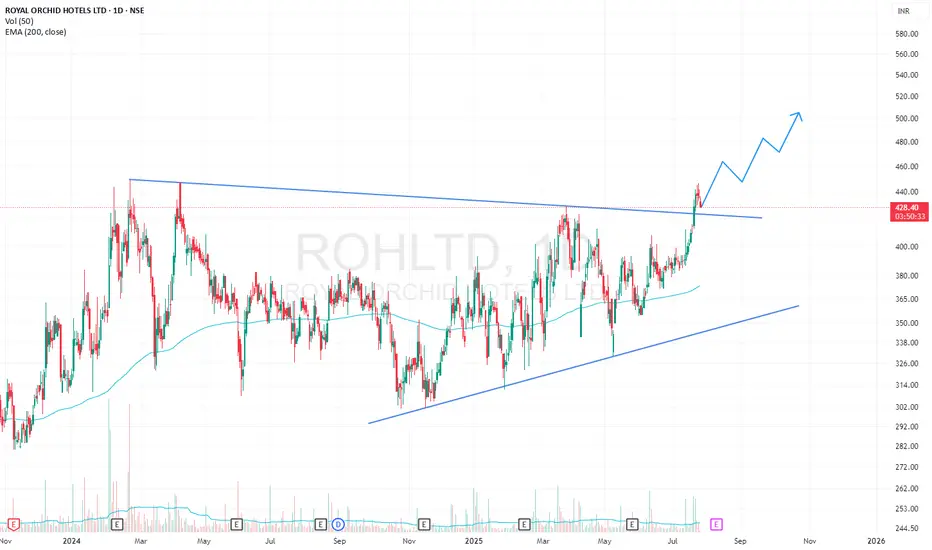
ROHLTD Triangle BreakOut 1DRoyal Orchid Hotels has given a breakout from triangle pattern on 1D timeframe. It has given a breakout with high volumes. It is currently trying to retest its breakout resistance.
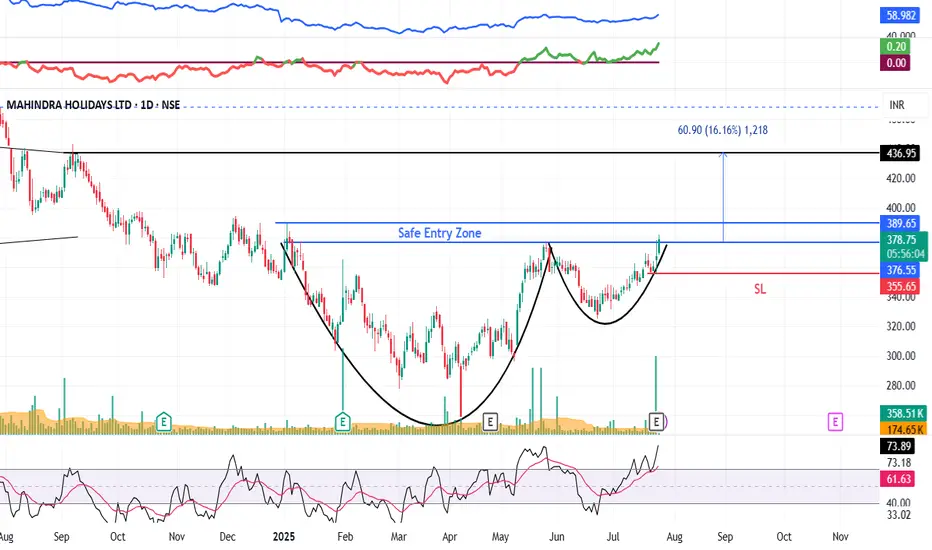
MHRIL : Swing Trade#MHRIL #patterntrading #chartpattern #cupandhandlepattern #swingtrading #trendingstock
MHRIL : Swing Trade
>> cup & Handle chart pattern
>> Breakout soon
>> Trending Setup
>> Stock in Momentum
>> Good Strength & Volumes
Swing Traders can lock profit at 10% & keep trailing
Pls boost, comment & Follow for more Learnings
Disc : Charts shared are for Learning purpose and not a Trade recommendation. Consult your financial advisor or a SEBI Registered Advisor before taking position in it.
JINDALSTEL : pattern breakout#JINDALSTEL #patterntrading #chartpatternbreakout #swingtrading
JINDALSTEL : Swing Trading
>> Breakout soon
>> Inverse Head & Shoulder pattern
>> Good Strength & Volumes Buildup
>> Trending setup
Swing Traders can lock profits at 10% and keep Trailing
Pls boost, Comment & Follow for more Analysis
Disc : Charts shared are for Learning purpose and not a Trade recommendation. Pls consult your Financial Advisor or a SEBI Registered Advisor before taking position in it

HDFC Asset Management Company Ltd - Long Setup, Move is ON...#HDFCAMC trading above Resistance of 3844
Next Resistance is at 5237
Support is at 2982
Here are previous charts:
Chart is self explanatory. Levels of breakout, possible up-moves (where stock may find resistances) and support (close below which, setup will be invalidated) are clearly defined.
Disclaimer: This is for demonstration and educational purpose only. This is not buying or selling recommendations. I am not SEBI registered. Please consult your financial advisor before taking any trade.

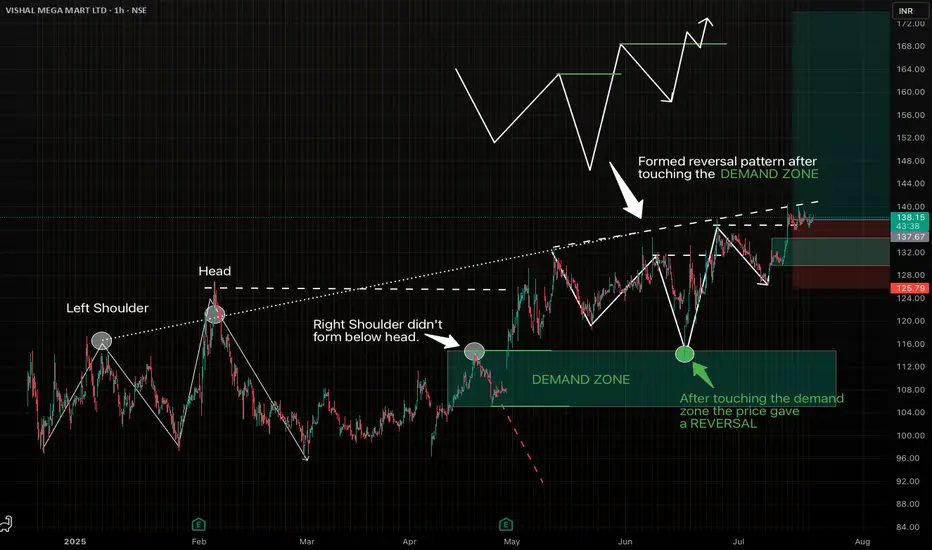
Strong reversal pattern on VMM. Looks good for swing trade.Spotted a beautiful setup on VISHAL MEGA MART LTD (1H Chart), following my favourite "Elevated Right Shoulder" pattern.
- The Left Shoulder and Head formed clearly.
- The Right Shoulder didn't go below the head, indicating ultra bullish structure and formed a demand zone.
- Price touched the Demand Zone and gave a perfect reversal.
-Clean entry with favourable risk-reward.
Let's see how it plays out.
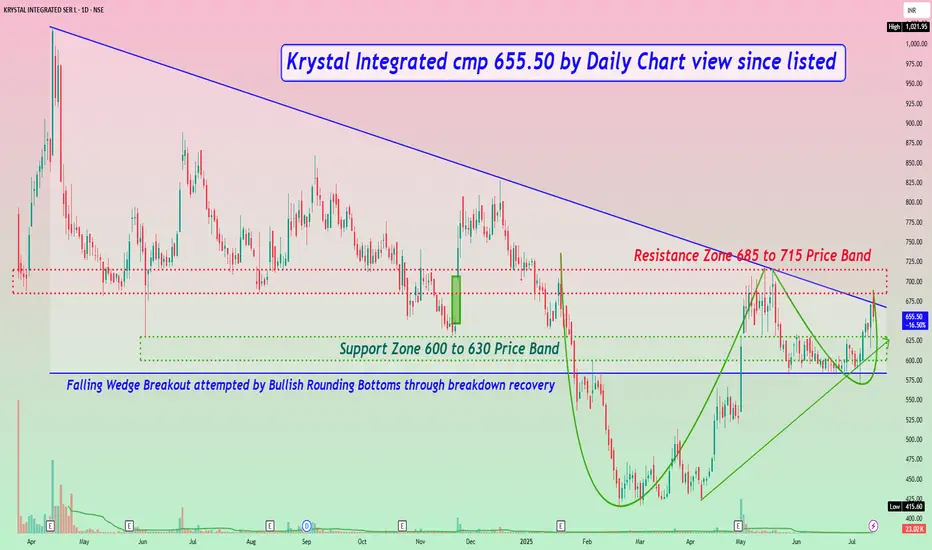
Krystal Integrated cmp 655.50 by Daily Chart view since listedKrystal Integrated cmp 655.50 by Daily Chart view since listed
- Support Zone 600 to 630 Price Band
- Resistance Zone 685 to 715 Price Band
- Support Zone tested, retested and broken out, was resistance earlier
- Volumes are flat, need to increase for the Resistance Zone neckline crossover
- Most common Technical Indicators are seen to be turning out with positive trend
- Rising Support Trendline seems been well respected by the price action momentum
- Falling Wedge Breakout attempted by Bullish Rounding Bottoms through breakdown recovery
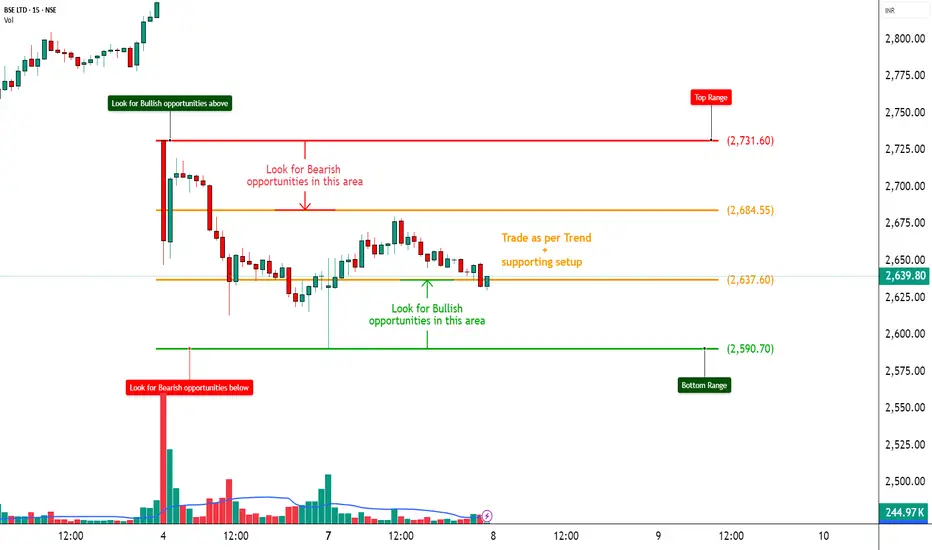
BSE – Heavy Call Writing Indicates Resistance Ahead________________________________________
📈 BSE – Heavy Call Writing Indicates Resistance Ahead | OI + Price Action Analysis
🕒 Chart Type: 15-Minute
📆 Date: July 7, 2025
________________________________________
🔍 What’s Catching Our Eye:
BSE is trading near ₹2636, and the Option Chain is showing aggressive Short Build-Up on Calls from 2650 to 3000, clearly highlighting a resistance zone above current price. Meanwhile, Put writers are unwinding, especially at ₹2600 PE, confirming weak bullish conviction. Traders are playing defensively with bearish bias dominating.
________________________________________
📌 What We’re Watching For:
If BSE breaks below ₹2600, we may see a quick slide toward ₹2550–2500. However, a sharp breakout above ₹2700 with strong volume may trigger a round of short-covering. Until then, upside looks capped due to excessive Call writing.
________________________________________
📊 Volume Footprint:
Options activity is backed by strong volume —
• Over 8.9k contracts at ₹2700 CE
• Over 8.1k contracts at ₹2800 CE
• Over 7k contracts at ₹3000 CE
→ Traders are betting on price staying below 2700–2800 levels, creating a strong supply wall.
________________________________________
📈 Option Chain Highlights:
• Calls (Short Build-Up):
o ₹2700 CE: +81,375 OI | Price ↓ 8.82%
o ₹2800 CE: +18,375 OI | Price ↓ 11.07%
o ₹3000 CE: +77,250 OI | Price ↓ 16.60%
o ₹2650 CE: +38,250 OI | Price ↓ 8.01%
• Puts:
o ₹2600 PE: -42,375 OI | Price ↓ 10.94% → Long Unwinding
o ₹2500 PE: +102,375 OI | Price ↓ 16.55% → Short Build-Up
📌 Inference:
Bulls are on the back foot. CE writers are dominating across all key strikes, and only the 2500 PE is showing fresh interest — which is far from spot, indicating potential room for further downside.
________________________________________
🔁 Trend Bias:
🔴 Bearish to Neutral – Unless 2700 breaks cleanly
________________________________________
🧠 Trade Logic / Reasoning:
Every CE strike from ATM to OTM is under short build-up — that's a clear ceiling forming. With no visible strength in Put writing near spot, the path of least resistance appears to be on the downside. Keep a close eye on ₹2600.
________________________________________
📍 Important Levels to Mark:
🔺 Top Range (Resistance): ₹2731.60
🔻 Bottom Range (Support): ₹2590.70
________________________________________
🎯 Trade Plan (Educational Purpose Only):
✅ Best Buy (Equity): Only if BSE crosses ₹2700 with volume
✅ Best Sell (Equity): Below ₹2600 for target ₹2550–2500
✅ Best CE to Long: ❌ None – All major Calls under Short Build-Up
✅ Best PE to Long: ₹2500 PE – Showing fresh bearish positioning
🟢 Demand Zone: NA
🔴 Supply Zone: NA
⚠️ Invalidation Below:
Bullish view invalidated if price sustains below ₹2600
________________________________________
⚠️ Disclaimer:
This analysis is for educational purposes only.
STWP is not a SEBI-registered advisor.
No buy/sell recommendations are made.
Please consult your financial advisor before trading.
STWP is not responsible for trading decisions based on this post.
________________________________________
💬 Spotting the weakness early helps plan smarter.
What’s your view on BSE – comment below ⬇️
🔁 Share this if you're tracking BSE this week
✅ Follow STWP for clean price + OI based setups
🚀 Be Self-Reliant | Trade with Patience | Learn with Logic
________________________________________
Gabriel India Limited - Breakout Setup, Move is ON..#GABRIEL trading above Resistance of 518
Next Resistance is at 673
Support is at 415
Here are previous charts:
Chart is self explanatory. Levels of breakout, possible up-moves (where stock may find resistances) and support (close below which, setup will be invalidated) are clearly defined.
Disclaimer: This is for demonstration and educational purpose only. This is not buying or selling recommendations. I am not SEBI registered. Please consult your financial advisor before taking any trade.

TRANSRAILL : Breakout Stock (Swing Trading) #TRANSRAILL #breakoutstock #swingtrading #chartpattern #cupandhandlepattern #patternbreakout #patterntrading
TRANSRAILL : Swing Trading
>> Breakout Stock
>> Cup and Handle pattern
>> Breakout with Volume
>> Good Strength in Stock
>> Risk Reward Favorable
Swing Traders can lock profit at 10% and keep Trailing
Please Boost, comment and follow us for more Learnings
Disc : Charts shared are for learning purpose only, not a Trade recommendation. Do your own research and consult your financial advisor before taking any position.

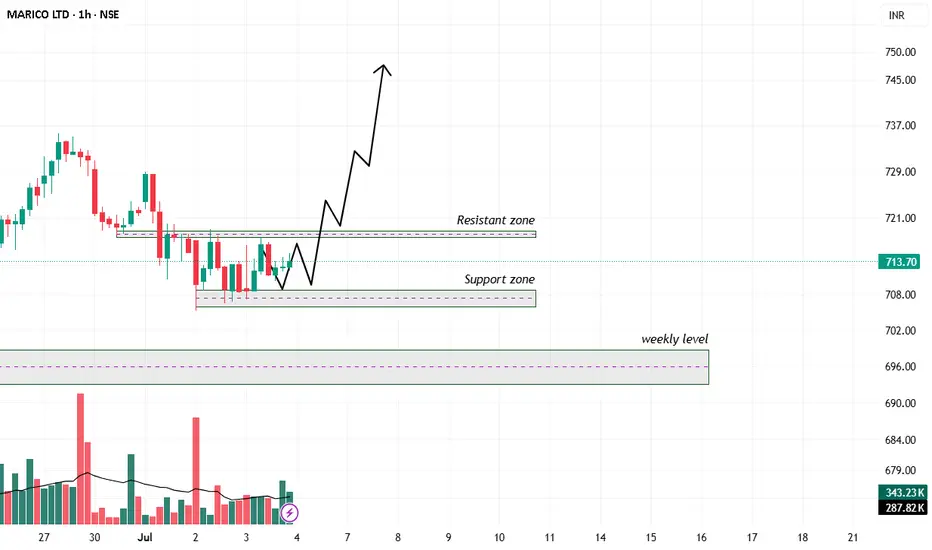
Technical Analysis: MERICO LTDTrend and Structure:
The chart shows a strong uptrend leading up to a recent pullback.
After the pullback, price is consolidating between a support zone (~708 INR) and a resistance zone (~720 INR).
There is a clear weekly support level marked around 690-695 INR below the support zone.
Volume is moderate but showing no large spikes, indicating potential consolidation.
Support and Resistance:
Immediate resistance zone is around 718-721 INR, acting as short-term overhead supply.
The support zone is roughly between 707-710 INR, serving as a base for potential bounce.
The weekly level below (roughly 690-695 INR) may act as a strong support if price breaks current support.
Price Projections:
The drawn projection suggests a short-term dip toward the support zone, followed by a strong bounce above the resistance.
This implies a possible bullish continuation after a minor correction or consolidation.
Volume:
Volume during consolidation is relatively steady.
Watch for volume pickup on a breakout above resistance for confirmation.
Trading plan:
Entry:
Consider entering a long position near or just above the support zone (~708-710 INR) when there is confirmation of buying interest (e.g., bullish reversal candlestick or volume spike).
Alternatively, a breakout entry can be taken above the resistance zone (~720-722 INR) with volume confirmation.
Stop Loss:
Place a stop loss below the support zone or slightly below the weekly level, around 700-705 INR to protect against downside risk.
Targets:
Initial target near the resistance breakout level (~720-725 INR).
Secondary target around 745-750 INR based on the upward arrow projection, representing the next resistance area.
Risk-Reward:
Risk: Approximately 8-10 INR per share.
Reward: Potential gain of 35-40 INR per share.
Favorable risk-reward ratio around 3:1 or better.
Additional Notes:
If the price falls below the support zone and weekly level with strong volume, consider exiting or avoiding long positions.
Look for confirmation signals before entry to reduce false breakouts or breakdowns.
Summary:
Table
Parameter Details
Entry Price ~708-710 INR (on support)
Stop Loss ~700-705 INR
Target 1 ~720-725 INR
Target 2 ~745-750 INR
Trend Pullback in uptrend
Risk-Reward Ratio ~3:1 or better
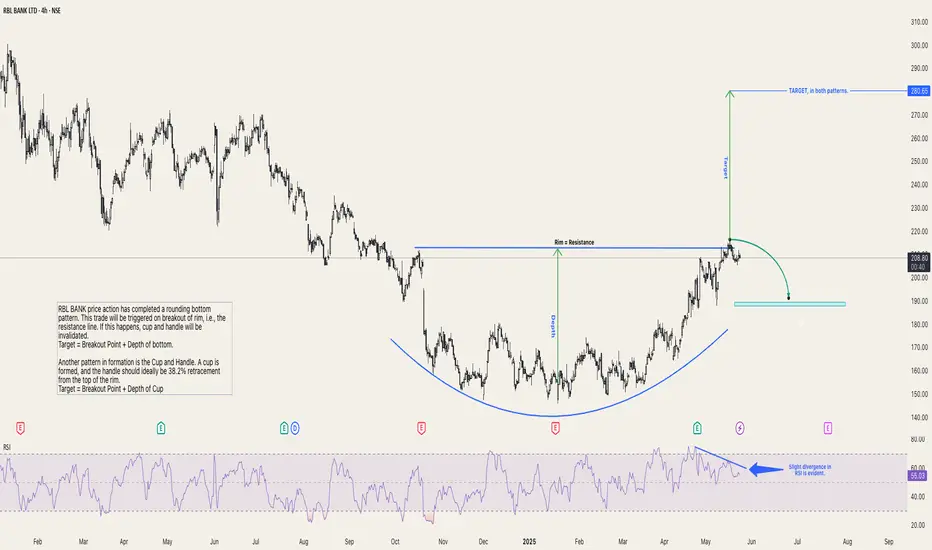
RBLBANK: Bullish pattern in focusRBL BANK's price action has completed a rounding bottom pattern. This trade will be triggered by the breakout of the rim, i.e., the resistance line. If this happens, the cup and handle will be invalidated.
Target = Breakout Point + Depth of bottom.
Another pattern in formation is the Cup and Handle. A cup is formed, and the handle should ideally be 38.2% retracement from the top of the rim.
Target = Breakout Point + Depth of Cup
Trade will be triggered on the breakout of the resistance line trading at around ₹213-₹216
Laurus Labs Limited - Breakout Setup, Move is ON...#LAURUSLABS trading above Resistance of 553
Next Resistance is at 699
Support is at 420
Here are previous charts:
Chart is self explanatory. Levels of breakout, possible up-moves (where stock may find resistances) and support (close below which, setup will be invalidated) are clearly defined.
Disclaimer: This is for demonstration and educational purpose only. This is not buying or selling recommendations. I am not SEBI registered. Please consult your financial advisor before taking any trade.
