ASIANPAINT 1 Day Time Frame 📊 Current Price (approx): ₹2,402 – ₹2,410 (NSE intraday/daily) as of latest market data.
🔁 Daily Pivot Levels
Pivot (central reference): ~₹2,379–₹2,380
Resistance Levels:
• R1: ~₹2,416–₹2,417
• R2: ~₹2,475–₹2,476
• R3: ~₹2,512–₹2,513
Support Levels:
• S1: ~₹2,320–₹2,321
• S2: ~₹2,283–₹2,284
• S3: ~₹2,224–₹2,225
(from classic daily pivot structure)
📈 How to Use These Levels (Daily Basis)
Bullish scenario (if buyers strong):
Sustained break above R1 (~₹2,416) targets R2 (~₹2,475) & then R3 (~₹2,512).
Neutral / sideways zone:
Price hovering between Pivot (~₹2,380) and R1 (~₹2,416) suggests range‑bound moves.
Bearish scenario (if selling pressure):
Break below S1 (~₹2,320) can open path towards S2 (~₹2,283) and then S3 (~₹2,224).
📌 Short‑Term Technical Snapshot
Asian Paints price action has been under pressure recently as technical indicators show muted momentum and the stock trading below several moving averages (20‑day/50‑day) reflecting short‑term neutral to weak bias.
Always combine pivot levels with volume and price action signals (e.g., breakouts with confirmation) for better trade decisions.
Charts_insiders

VEDL 1 Moth Time Frame 📌 Latest Market Context
• The stock is trading near multi‑month and all‑time highs (around ₹670+ on NSE) on strong momentum and positive sentiment after broker upgrades and structural catalysts.
• RSI readings suggest strong upside momentum but near overbought in some sources.
📈 1‑Month Timeframe Key Levels
(These combine pivot, swing support/resistance & recent price action ranges)
Resistance (Upside Targets)
₹656–₹660 — Upper daily pivot resistance zone.
₹650–₹656 — R2–R3 levels from technical pivot indicators.
Above ₹670–₹680 — Near current multi‑week highs / psychological zone (strong breakout if sustained).
Support (Downside Floors)
₹630–₹635 — Immediate pivot support (~S1) & short‑term cushion.
₹622–₹625 — Secondary demand zone near moving average clusters.
₹616–₹620 — Deeper swing support if short correction unfolds.
📊 What These Levels Mean
✅ Holding Above ₹630–₹635
Maintains bullish momentum in the 1‑month view.
Prospects for retesting ₹650+ and potentially ₹670–₹680 if buying continues.
⚠️ Break Below ₹620
Could open a pullback toward ₹616 and lower pivot zones before buyers re‑emerge.
A close below ~₹616 on monthly/daily charts may signal short‑term loss of structure.
📍 How to Use These Levels
Bullish Trade Setup (1M swing)
Buy or add near support ₹630–₹620 with stops slightly below ₹616
Targets: ₹650 → ₹670+
Neutral/Profit‑Taking Zone
₹650–₹670+ is the next potential resistance breakeven/exit zone
Bearish/Defensive
If price decisively closes below ₹620–₹616, reduce risk exposure and watch for support at lower levels.

LODHA 1 Week Time Frame 📌 Current Price Snapshot
LODHA is trading around ₹1,055 – ₹1,085 on NSE recently.
📊 Weekly Time Frame Levels (Support & Resistance)
🔹 Key Support Levels (Weekly)
Levels where price may find buying interest this week:
Support 1: ~₹1,063 – ₹1,064 (primary weekly support)
Support 2: ~₹1,060 – ₹1,061 (secondary zone)
Support 3: ~₹1,051 – ₹1,055 (deeper weekly support range)
📌 A decisive weekly close below ~₹1,050 – ₹1,055 could signal further downside momentum.
🔹 Key Resistance Levels (Weekly)
Levels where price may run into supply/selling:
Immediate Resistance / Pivot: ~₹1,077 – ₹1,082
Resistance 1: ~₹1,091 – ₹1,092
Resistance 2: ~₹1,097 – ₹1,100
Higher Resistance: ~₹1,110 + if bullish momentum accelerates
📌 Weekly close above ₹1,090 – ₹1,100 strengthens short‑term bullish bias.
📌 Weekly Trading Context
Bullish Scenario
Break & close above ~₹1,090‑₹1,100 on weekly chart → watch for continuation toward higher resistances.
Bearish Scenario
Breakdown and weekly close below ~₹1,063‑₹1,055 → could open path to deeper support near ~₹1,030‑₹1,020 in extended bearish move.

MARUTI 1 Month time Frame 📌 Current Price Context
The stock is trading near ₹16,600–₹16,750 levels (approximate latest market price).
52‑week high: ~₹16,818.
52‑week low: ~₹10,800.
📊 1‑Month Time Frame Key Levels (Support & Resistance)
🔺 Resistance Levels (Upside Targets)
Daily / Short‑Term
• R1: ~₹16,649–₹16,650 – First resistance zone based on pivot.
• R2: ~₹16,757–₹16,760 – Next upside likely supply area.
• R3: ~₹16,832–₹16,833 – Higher resistance near recent swing highs/upper pivot.
📈 Key level to watch: Above ₹16,830 could signal breakout continuation.
🔻 Support Levels (Downside Floors)
Daily / Short‑Term
• S1: ~₹16,466–₹16,470 – Immediate support zone.
• S2: ~₹16,390–₹16,420 – Secondary support cluster if first breaks.
• S3: ~₹16,320–₹16,330 – Lower pivot support for deeper pullbacks.
📉 Key breakdown area: Below ~₹16,320 may open deeper retracement into lower 1‑month range.
📊 Pivot Point (Central Reference)
Pivot (Daily/Short‑Term): ~₹16,574–₹16,576 – This mid‑point acts as neutral zone around current price action.
📌 1‑Month Outlook (What to Watch)
📊 Bullish Scenario
✔ Above ₹16,750–₹16,830 → Next focus towards ₹16,900+ range.
✔ Strong rejection off back‑to‑back support levels indicates buyers stepping in.
📉 Bearish Scenario
✔ Break & close below ₹16,400–₹16,320 → sellers gain edge, could test lower support near ₹16,200–₹16,000.

360ONE 1 Day Time Frame 📊 Daily Price Range
Typical intraday range: ~₹1,124–₹1,150 (varies per session) — recent daily highs/lows seen in this band.
📈 Important Daily Support Levels
Support 1: ~₹1,134–₹1,135 — near recent intraday lows.
Support 2: ~₹1,102 — secondary downside support.
Support 3: ~₹1,084 — deeper support level if broader sell‑off unfolds.
👉 These are key levels where the stock has found buying interest on the daily chart. Breach below them may indicate more downside pressure.
📉 Important Daily Resistance Levels
Resistance 1: ~₹1,184 — immediate upside barrier.
Resistance 2: ~₹1,202 — next layer of sellers.
Resistance 3: ~₹1,234 — stronger upside pivot.
👉 These are areas where the stock may struggle to move higher on the daily timeframe.
🔧 Technical Bias on Daily Timeframe
Daily indicators (RSI, MACD, moving averages) are currently showing buy/strong‑buy signals, meaning short‑term trend is tilted bullish.
📌 Daily Pivot Reference (Approximate)
Pivot ~₹1,152–₹1,155 — central daily pivot based on recent session price action.

ASIANTILES 1 Day Time Frame 📊 Current Price Context
Asian Granito India is trading around ₹72–73 on the NSE in today’s session.
📈 1‑Day Key Levels (based on recent pivot/technical data)
🔹 Pivot Point (daily reference): ~ ₹73 (central level)
📌 Resistance Levels:
R1: ~ ₹75 – Immediate upside hurdle (recent 52‑week high area)
R2: ~ ₹77 – Secondary resistance if price breaks above R1
R3: ~ ₹79 – Extended resistance zone
📉 Support Levels:
S1: ~ ₹72 – Nearest support below the pivot
S2: ~ ₹70 – Short‑term support zone
S3: ~ ₹68 – Deeper support if market weakens
🛠️ How to Use These Levels
Bullish entry: Above the daily pivot (~₹73) with volume confirmation.
Stop loss: Below ₹70–₹68 if long.
Profit targets: ₹75 → ₹77 → ₹79 on sustained upside.

JAINREC 1 Day Time Frame 📌 Latest price context:
• The stock has been trading around ₹400–₹410 in recent sessions (range today ~396.5–409) with latest close near ₹401.30.
📊 Daily Technical Levels (Approximations)
🔵 Resistance Levels
R1: ~₹418–₹420 — 1st key upside hurdle — pay attention for breakout.
R2: ~₹425–₹430 — Secondary resistance at previous reaction highs.
R3: ~₹435–₹440+ — Strong supply zone from past tops/52‑wk range.
🔴 Support Levels
S1: ~₹400–₹401 — Immediate floor pivot area around current price.
S2: ~₹390–₹392 — Near short‑term support from recent pullbacks.
S3: ~₹383–₹385 — Deeper support zone below recent correction lows.
S4: ~₹370–₹375 — Major support if price loses the current range.
📍 Daily Pivot (approx)
• Pivot ~ ₹400–₹402 — Price around this level gives neutral bias until breakout.

BAJFINANCE 1 Week Time Frame 📍 Current Price (Approx)
₹1,015 – ₹1,018 range on NSE as of latest close.
📊 Weekly Timeframe Levels (Support & Resistance)
🔹 Weekly Pivot‑Based Levels
(Using weekly pivot calculations — more relevant for weekly timeframe traders)
Resistance
R1: ~₹1,004 – ₹1,018
R2: ~₹1,018 – ₹1,034
R3: ~₹1,034 – ₹1,042
Pivot Zone / Mid
Weekly Pivot: ~₹988 – ₹992
Support
S1: ~₹973 – ₹986
S2: ~₹957 – ₹973
S3: ~₹943 – ₹957
📌 Key Weekly Range: approximately ₹973 – ₹1,042.

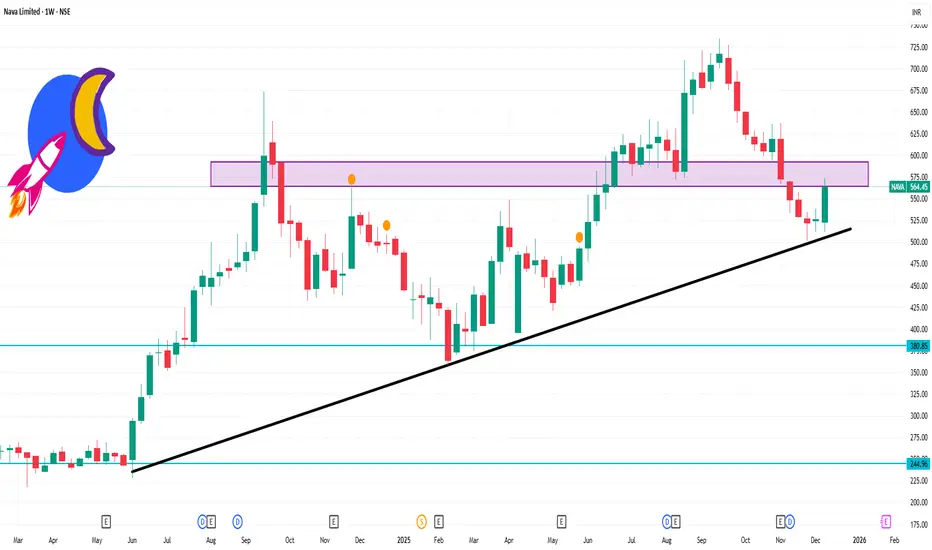
NAVA 1 Week Time Frame 📌 Current Price Snapshot
Last traded / recent price: ~₹560–₹567 on NSE/BSE (varies by source; live changes intraday)
52‑week range: ₹356 (low) to ₹735 (high)
📊 Weekly Timeframe Levels (Support & Resistance)
For a 1‑week (weekly candle) view you want levels that matter over the entire trading week — not just intraday:
🔹 Weekly Pivot & Key Levels (from pivot and technical sources)
Immediate Pivot (weekly): ~₹552–₹563
Weekly Resistance Zones:
R1: ~₹566–₹570 (near recent swing highs)
R2: ~₹587–₹590 zone
R3: ~₹600+ if momentum persists
Weekly Support Zones:
S1: ~₹531–₹535 (first strong support)
S2: ~₹517–₹520 (secondary weekly support)
S3: ~₹496–₹500 (deeper support if selling extends)
Summary of weekly levels:
📈 Bullish break‑above: ₹570–₹590
🧊 Neutral pivot zone: ₹552–₹565
🛑 Bearish below: ₹531 → ₹500
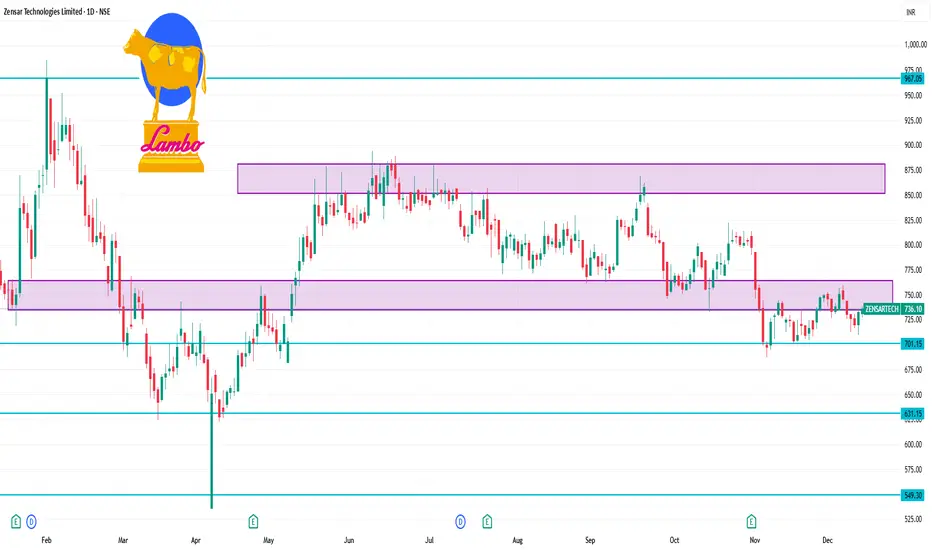
ZENSARTECH 1 Day Time Frame 📌 Current Price (Latest Available)
Approx live price: ~₹724‑₹737 range (varies across platforms, indicative of current session) with regular session fluctuation.
📊 Daily Key Levels (Support & Resistance)
🔹 Resistance Levels
These are areas where price may encounter selling pressure on the upside:
R1: ~₹775‑₹778 zone — near immediate pivot resistance (short‑term)
R2: ~₹795‑₹800 — next resistance zone beyond R1
R3: ~₹810‑₹820+ — higher resistance / breakout zone
🔻 Support Levels
These are levels where buyers may step in on dips:
S1: ~₹745‑₹750 — first support area (Camarilla / pivot based)
S2: ~₹734‑₹736 — near recent price trading area support
S3: ~₹720‑₹725 — strong lower support from recent ranges
📉 Daily Pivot Reference
Daily Pivot (classic / pivot midpoint): ~₹783‑₹784 area (this is the anchor level for daily direction)
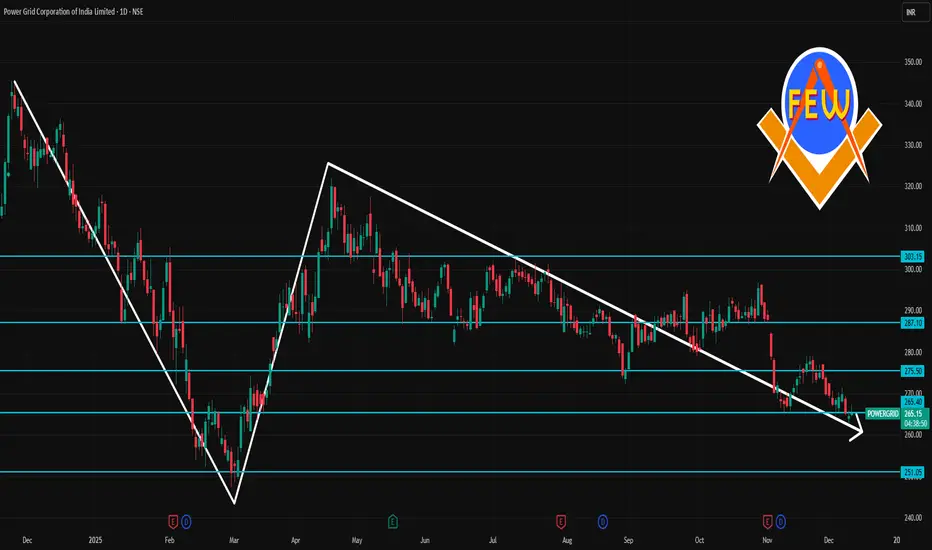
POWERGRID 1 Day Time Frame 📊 CURRENT PRICE (Approx, Live Intraday)
₹263 – ₹266 approx range today as of latest data.
These are derived from today’s price movements and expected intraday behaviour:
✅ Pivot Point (Central Reference)
Pivot: ~ ₹264.4 – ₹265.9
📈 Resistance Levels
R1: ~ ₹265.9 – ₹266.0
R2: ~ ₹267.25
R3: ~ ₹268.75
📉 Support Levels
S1: ~ ₹263.05
S2: ~ ₹261.55
S3: ~ ₹260.20
These reflect short-term intraday pivot support & resistance derived from price movement and are useful for 1-day trading decisions (breakouts or pullbacks).
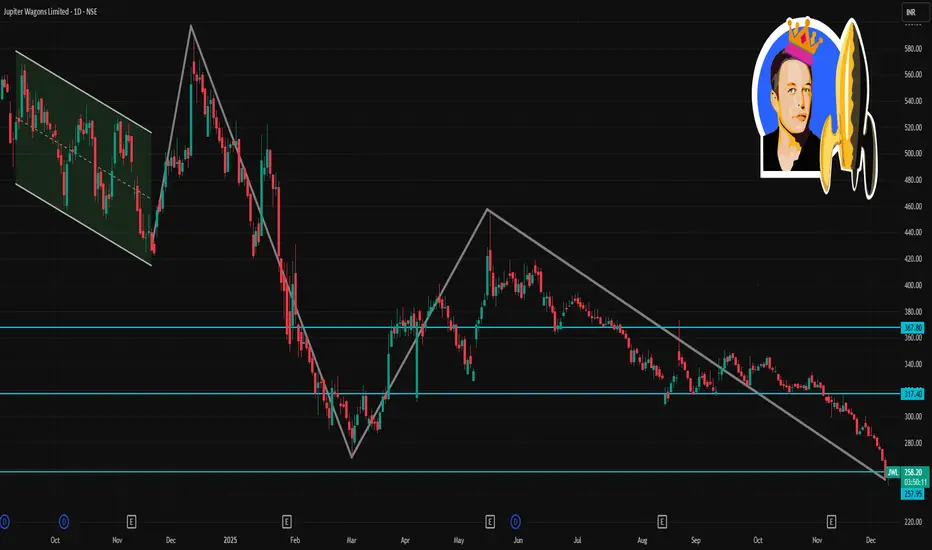
JWL 1 Day Time Frame 📌 Key recent price and context
Recent quoted share price of JWL is ~ ₹254–267 (on NSE/BSE, depending on source/time).
The 52‑week high / low range for JWL has been roughly ₹588 (high) and ₹266 (low).
🔧 Key 1‑Day Support / Resistance / Pivot Levels
Based on most recent public pivot‑point / support‑resistance breakdowns:
Level Approximate Price / Range
Immediate Support (S1) ~ ₹263.6
Lower Support (S2 / S3) ~ ₹260.2 and ~ ₹254.3
Pivot / Intra‑day Reference ~ ₹269.5
First Resistance (R1) ~ ₹272.9
Second Resistance (R2) ~ ₹278.9
Third / Upper Resistance (R3) ~ ₹282.3
Interpretation (for 1‑day horizon):
On a decline, watch ₹263.5–₹260 as first support zone — a drop below ₹254–₹255 could open up downside risk.
On a bounce/recovery, ₹272–273 may act as first resistance zone; ₹278–282 as the key target or supply zone.
If price trades near the pivot (~₹269), price action and volume around that will decide intraday bias (whether sellers or buyers dominate).
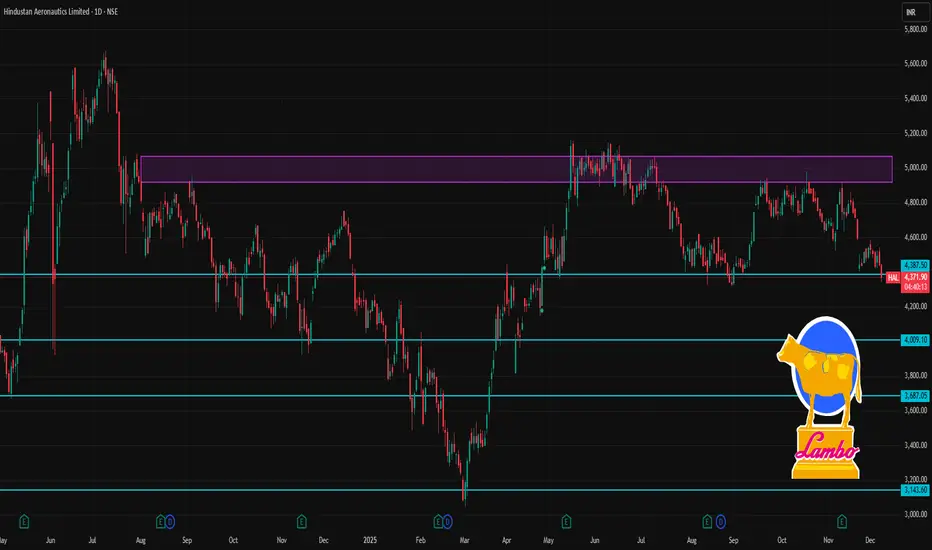
HAL 1 Day Time Frame 📈 Current Live Price (Approx)
HAL stock trading around ~₹4,360-₹4,440 on NSE today (08-Dec-2025) depending on real-time movement during session.
📊 Daily Pivot & Intraday Levels (Key Support / Resistance)
(Derived from live pivot screener showing today’s pivot scenario)
Daily Pivot Pivot Levels
Level Price (Approx)
R3 ₹4,583
R2 ₹4,558
R1 ₹4,533
Pivot Point ₹4,508
S1 ₹4,483
S2 ₹4,458
S3 ₹4,433
✅ Today’s view: Current price is trading near or slightly below the pivot zone (~₹4,507) — indicating neutral/slightly bearish bias if below pivot. Break above R1/R2 (~₹4,533-₹4,557) strengthens bullish intraday bias; breakdown below S2/S3 (~₹4,458-₹4,433) increases downside risk intraday.
🧠 How to Interpret These Intraday Levels
📌 Bullish (Buy) Scenario
Above Pivot (~₹4,508) → intraday bias turns bullish.
Break above ₹4,533-₹4,558 zones → could lead to further upside towards R3 ~₹4,583+.
📉 Bearish (Sell) Scenario
Below S1 (~₹4,483) → short-term weakness.
If price slips below ₹4,458-₹4,433 (S2/S3) → stronger bearish momentum intraday.
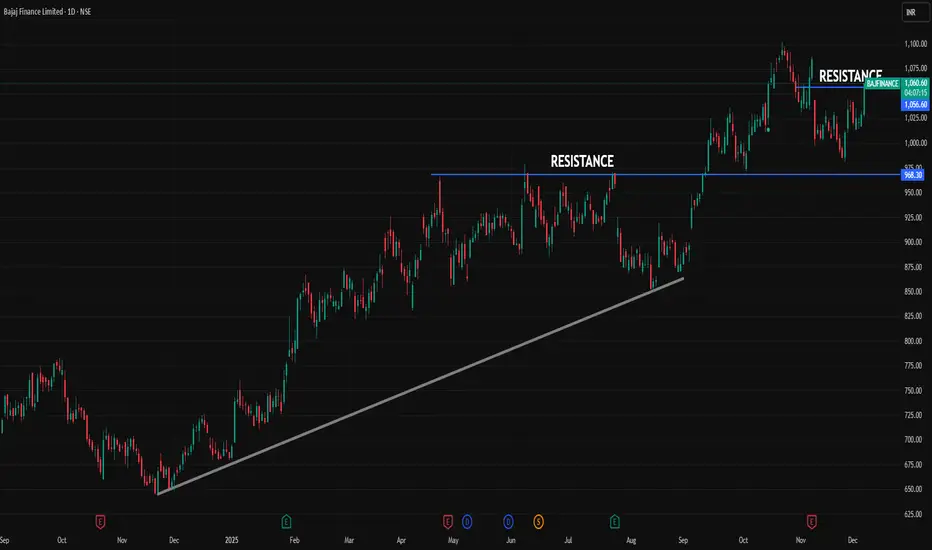
BAJFINANCE 1 Day Time Frame 📌 Latest Price Snapshot
Last quoted price: ~ ₹ 1,029.05
Today’s trading range: ~ ₹ 1,016.00 (low) to ₹ 1,032.30 (high)
52‑week high / low: ~ ₹ 1,102.50 / ₹ 668.55
⚠️ What to Watch / Trade‑Caveats (Intraday)
Pivot and support/resistance levels are dynamic — price could react differently depending on volume, broader market sentiment, and macro factors.
Since current price is already near resistance zone (~₹ 1,044 – 1,056), upside room may be limited — breakouts should be watched carefully, and risk of pullback exists.
On the downside, if price dips below ~₹ 1,019‑1,025, then the next support zone (~₹ 997‑₹ 978) becomes relevant.
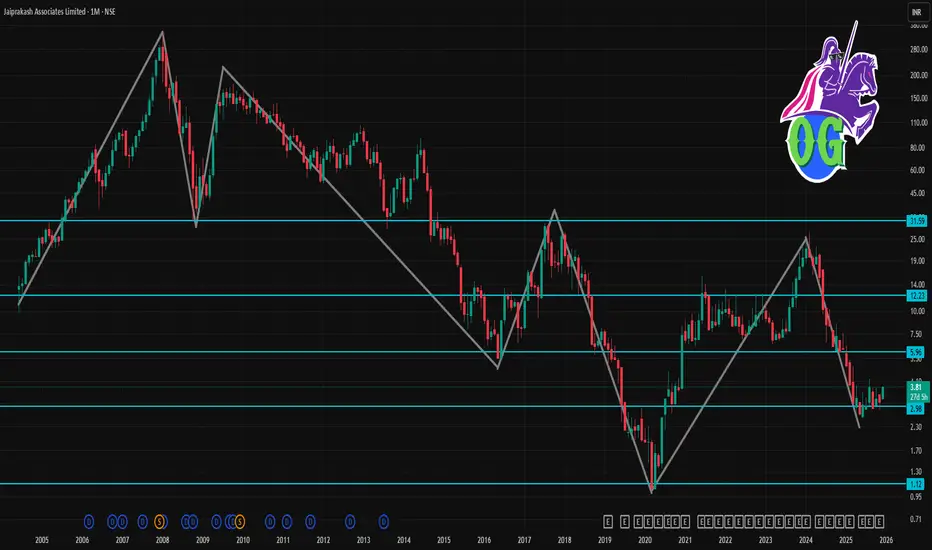
JPASSOCIAT 1 Month Time Frame 🔎 Current snapshot
Recent price (early Dec 2025): ~ ₹ 3.60–₹ 3.81.
52-week high / low: ~ ₹ 7.57 / ₹ 2.56.
Company remains under resolution/insolvency proceedings. Its balance sheet, according to data, shows negative book value and poor earnings metrics over recent years.
Because of this, the stock is highly volatile and speculative. Analysts have repeatedly flagged that such small-cap, distressed companies are “easy to enter but difficult to exit.”
🎯 My view (1-month horizon)
Given high uncertainty, best to treat this as a speculative trade rather than a “safe bet.”
Short-term upside is possible if there is news on resolution/acquisition or better-than-expected restructuring.
But downside risk remains high — if negative developments emerge, the stock may slip back.
HEROMOTOCO 1 Day View📈 Current Technical Snapshot
As of the most recent close, Hero MotoCorp is trading around ₹ 6,174–₹ 6,175.
Medium‑ to long‑term moving averages (20‑day, 50‑day, 100‑day, 200‑day) are all below current price — indicating a bullish trend on daily timeframe.
Momentum indicators (e.g. MACD, RSI, CCI) remain positive in recent technical overlays — reflecting continued bullish bias.
🧭 What this means (short‑term bias)
As long as the stock remains above ~ ₹ 6,098–6,100, positive bias likely remains intact — supports may hold if there’s a pullback.
A break above ₹ 6,200–6,205 could open near‑term upside toward ₹ 6,250–6,300+ (near recent highs / psychological resistance).
On downside — if price breaks convincingly below ~ ₹ 6,000, next real support comes only near ₹ 5,995–6,000.
⚠️ What to Watch / Limitations
Technical levels are zones, not precise lines — price may overshoot briefly before reaction.
Market‑wide factors or news (macroeconomic, demand for two‑wheelers, policy, daily volume) can override technicals.
These levels are short‑term / 1‑day to few‑day oriented. For swing or long‑term holdings, combine with weekly / monthly chart analysis.

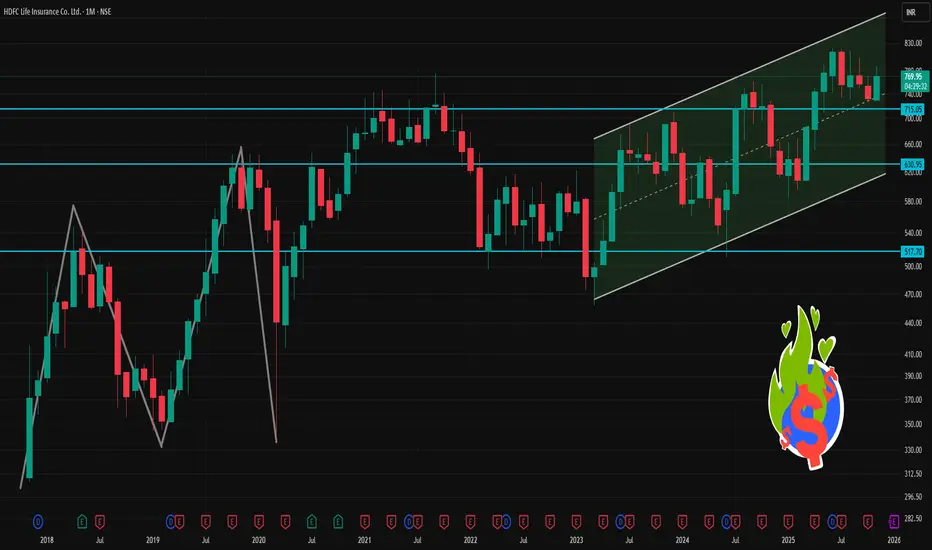
HDFCLIFE 1 Month Time Frame 📊 Current price & recent moves (1‑month)
As of 26 Nov 2025, the stock was trading at around ₹787.55.
As per another source on 28 Nov 2025, the price is ~ ₹772.40.
The 52‑week trading range is roughly ₹584.30 (low) to ₹820.75 (high).
Technical data suggests the share price is above its 50‑day and 200‑day simple moving averages — a sign of medium‑term strength.
🧮 What this “level view” indicates
The stock is currently closer to its 52‑week high than to its recent lows — indicating investor confidence or positive sentiment.
The 1‑month return is decent (6‑8%), attractive for short‑term holders/traders.
Support levels (around ₹730‑₹750) seem to be respected, which gives a cushion against sharp downside (unless broader markets disrupt).
The fact that price is above both 50-day and 200-day SMAs suggests the medium‑term trend remains bullish or at least stable.
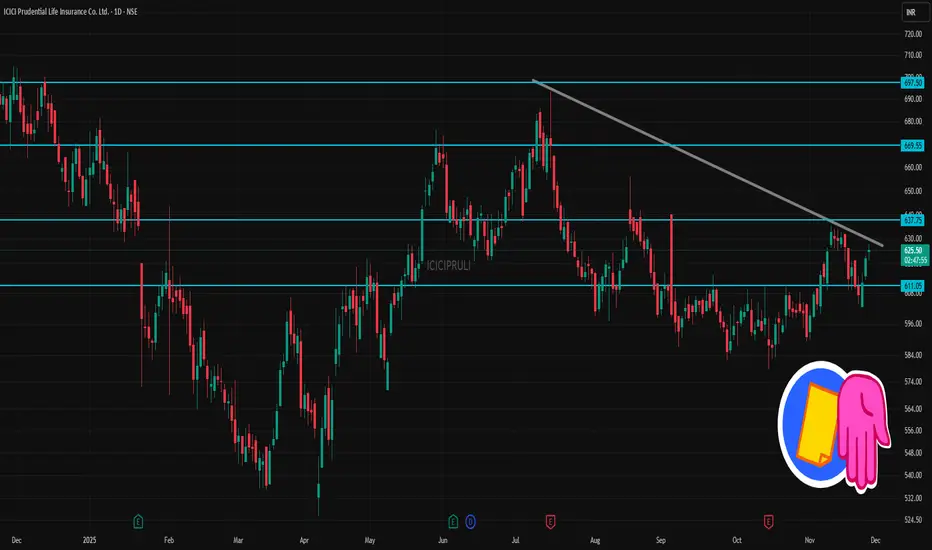
ICICIPRULI 1 Day Time Frame 📌 Latest Price & Context
Recent traded price: ~ ₹ 625–626.
52‑week range: Low ~ ₹525.80 — High ~ ₹704.70.
📈 What It Suggests (For 1‑Day / Short‑Term View)
As long as price remains above ~₹ 623–625, there is a short‑term bullish bias — next target could be ~₹ 630–635.
Dip toward ~₹ 615–620 could offer a buy‑on‑dip type entry (for traders), if volume and overall market sentiment stay supportive.
If price breaks below ~₹ 605–600, it may head toward the lower support zone — then caution/adapt strategy.
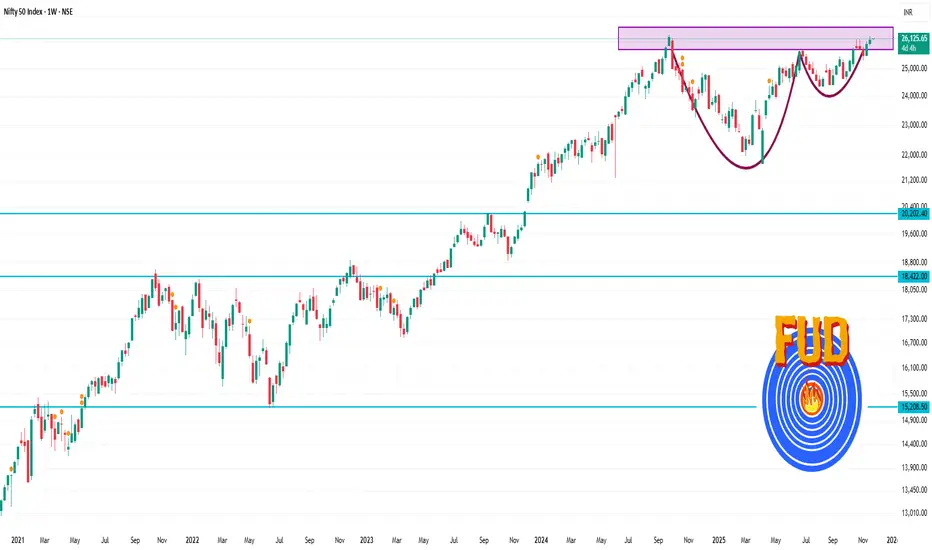
Nifty 50 1 Week Time Frame - Approximate value: ≈ 26,129.4 as of today.
- Weekly technical pivot support/resistance:
Weekly Bollinger Band top: ~ 26,166.78
Weekly Bollinger Band bottom: ~ 24,099.21
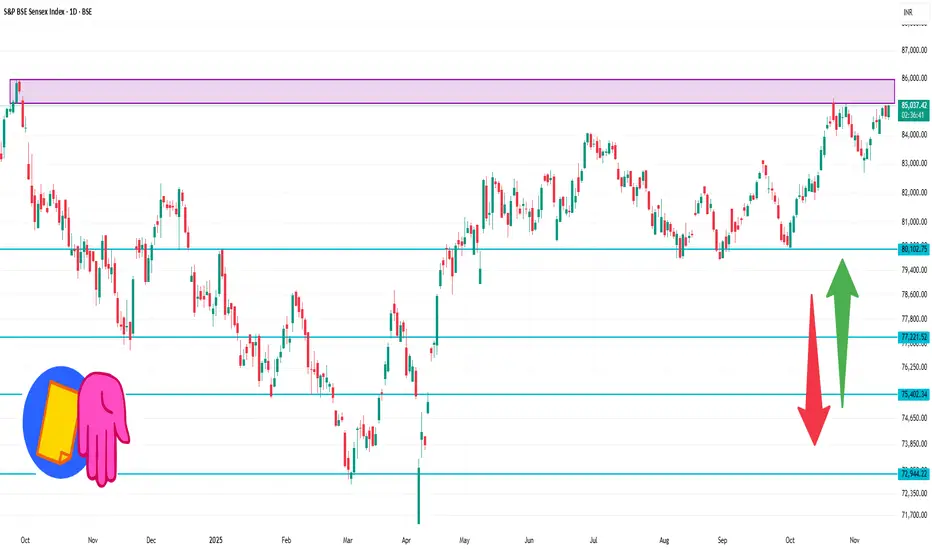
Sensex 1 Day Time Frame ✅ Current value
The index is trading around ~ 85,040 points.
Today’s high has been ~ 85,080 and low ~ 84,525.
📍 Key pivot & support/resistance levels (Daily)
From recent technical data:
Pivot Point: ~ 84,757.93
Resistance 1 (R1): ~ 84,957.50
Resistance 2 (R2): ~ 85,241.98
Support 1 (S1): ~ 84,473.45
Support 2 (S2): ~ 84,273.88
Support 3 (S3): ~ 83,989.40
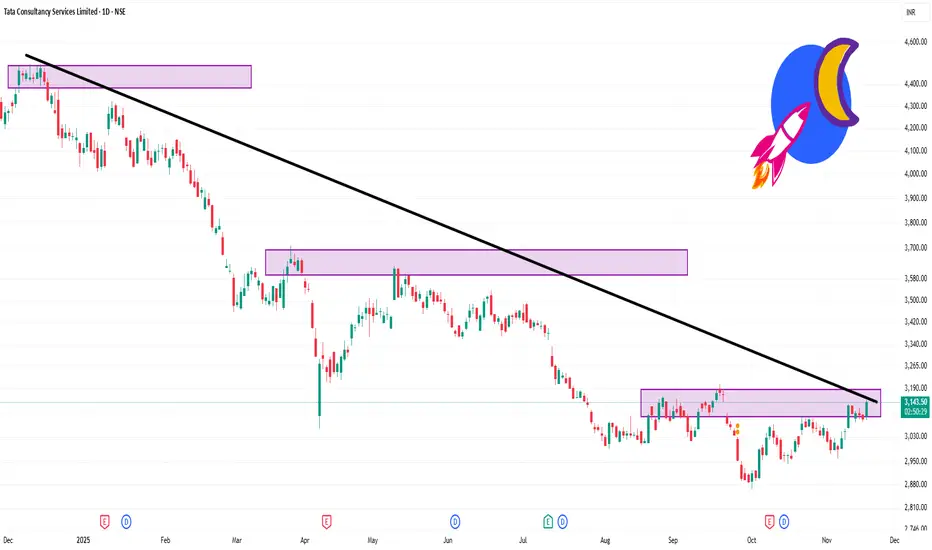
TCS 1 Day Time Frame ✅ Key numbers
Current price: ~ ₹3,147 (NSE)
Today’s range: Low ~ ₹3,083.50, High ~ ₹3,149.90
Previous close: ~ ₹3,087.10
📊 Key levels to watch on daily timeframe
Support zone: If price drops, watch around ~ ₹3,080-₹3,100 (today’s low region)
Immediate resistance: Today’s high ~ ₹3,149.90. If that breaks, next resistance may show up near ~ ₹3,200-₹3,250 (psychological + recent historic minor highs)
Trend pivot: The open of ~ ₹3,097 suggests a pivot point; staying above this gives short-term bullish lean, dropping back below may bring weakness
Risk zone: If price falls back and breaks below ~ ₹3,050, it may test lower support around ~ ₹2,990-₹3,000 (recent structural support area)
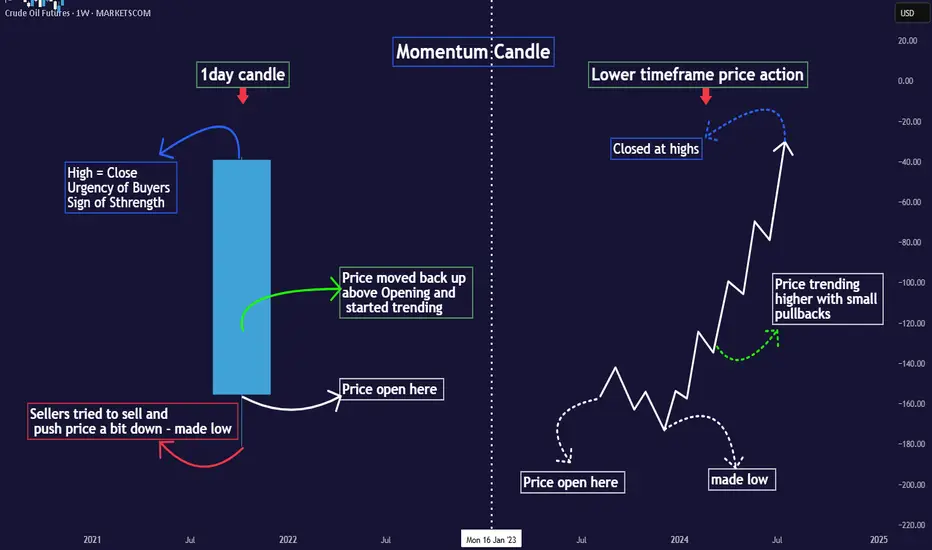
Simplified Approach to read Candlesticks -Easy Candles ~ Part 1MARKETSCOM:OIL
Introduction
⦿ Candles form the basis of chart creation and analysis.
⦿ A weak foundation can destabilise your entire structure. This thread will clarify and simplify your understanding of price candles.
I use two types of candles on charts:
1. Momentum/trending candles
2. Ranging/trading candles
Understanding these eliminates the need to memorize complex candle names (e.g., Marubozu, Harami bullish) cause every candlestick pattern is formed with combination of these 2 candels only.
Definitions:
⦿ Momentum candle: Body >50% of total size
⦿ Range candle: Body <50% of total size
Decode Momentum Candle
⦿ Only Buyers here - Clear Trend
Decode Range Candle
⦿ Both Buyers & Sellers here - No Trend
⦿ Indecision mode among participants.
⦿ Understand what major players did in the last candle to predict their next move.
⦿ Don't just memorise candle names; grasp the psychology behind them.
⦿ I'll share the levels of candle strength to elevate your candle reading.
♦️Stay tuned and follow for more educational
content.
SYNGENWatchlist
#SYNGEN (W)
Ready to ATH high Breakout ?
Breakout will confirm above 710
1- Positive chart structure
2- Horizontal Resistance of 650++ days
3- Weekly Resistance of 90++ weeks
Keep on Radar.
#Disclaimer:-View shared it for educational purposes only.
