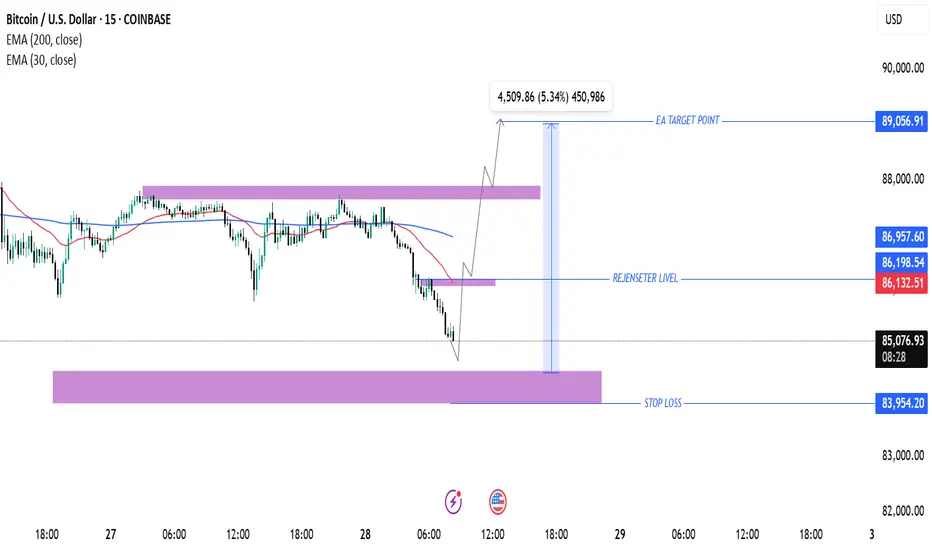
Bitcoin (BTC/USD) Trade Setup: Potential Reversal & Target Proje200 EMA (Blue): 86,960.21
30 EMA (Red): 86,149.39
The price is currently below both EMAs, indicating a short-term bearish trend.
Key Levels:
Stop Loss: 83,954.20 (marked in blue at the bottom)
Re-entry Level: 86,198.54 (near the 30 EMA)
Target Price: 89,056.91
Support & Resistance Zones:
Strong Support Zone: Around 83,954.20
Intermediate Resistance: Near 86,198.54
Major Resistance Zone: Close to 89,056.91
Trade Setup & Projection:
The chart suggests a potential reversal from the support zone.
The expected price movement shows a bounce from support, a breakthrough of the intermediate resistance, and a push toward the target price (89,056.91).
The expected gain is 4,509.86 points (5.34%).
Conclusion:
If BTC holds the support zone, an upside move is likely.
Breaking above 86,198.54 would confirm a bullish reversal.
Failing to hold support at 83,954.20 could lead to further downside.
Chatpatterns
GBP/USD Trade Analysis: Bullish Reversal from Support ZoneExponential Moving Averages (EMAs):
200 EMA (Blue) at 1.29309: Represents the long-term trend.
30 EMA (Red) at 1.29122: Represents the short-term trend.
Price is currently below both EMAs, suggesting a bearish trend.
Support and Resistance Zones:
Resistance Zone (Purple at the top): Price previously reacted strongly at this level.
Support Zone (Purple at the bottom): A potential demand area where price is currently bouncing.
Trade Setup:
Entry Point: Near 1.28875 (highlighted on the chart).
Stop Loss: Set around 1.28714-1.28856, below the support zone.
Target Point: 1.29730, above the resistance and near the 200 EMA.
Risk-to-Reward Ratio: The setup aims for a higher reward than risk.
Trade Idea:
Bullish Reversal Trade: The price is reacting at a support zone, and the target aligns with a previous resistance level.
A confirmation (strong bullish candle or break of 30 EMA) could indicate a move toward 1.29730.
EMA Crossover Watch: If the 30 EMA crosses above the 200 EMA, it may confirm a stronger uptrend.
Potential Risks:
If price breaks below 1.28714, the bullish idea is invalid.
Resistance at 1.29309 (200 EMA) could slow the move upward.

USD/CAD Bullish Breakout: Trade Hits Target Successfully200 EMA (Blue) at 1.43070: Represents long-term trend resistance.
30 EMA (Red) at 1.42660: Represents short-term trend direction.
Price has strongly surged above the 30 EMA, indicating bullish momentum.
Support and Resistance Levels:
Support Zone (Red area at the bottom): Marked near 1.42150, where the price reversed.
Target Resistance (Blue at the top) at 1.43672: Marking the expected profit zone.
Trade Setup:
Entry Point: Near the support zone at 1.42451-1.42660.
Stop Loss: Placed below 1.42150, to minimize risk.
Target Point: 1.43672, aligning with a previous resistance level.
Price Movement: A strong bullish breakout occurred, moving rapidly toward the target.
Trade Analysis:
✅ Successful Long Trade: Price moved sharply upward after consolidating at support.
📈 Momentum Confirmation: The strong bullish candles indicate aggressive buying.
🎯 Target Achieved: The trade reached the projected 1.43672 level, generating a solid risk-to-reward outcome.
Potential Future Outlook:
If the price sustains above 1.43672, further upside could be seen toward 1.44000.
If it faces resistance, a pullback toward 1.43070 (200 EMA) may occur before another move.

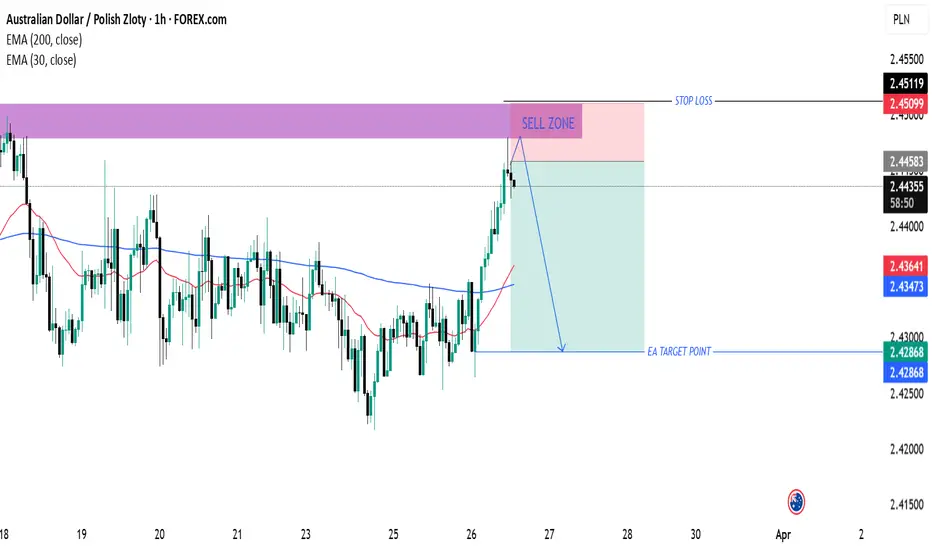
"AUD/PLN Technical Analysis – Potential Sell Setup (March 26, 20Sell Zone (Purple Area)
This area marks a strong resistance level, where price is expected to reverse downward.
Price has entered this zone, which might indicate a potential short-selling opportunity.
Stop Loss (Above Sell Zone)
The stop-loss level is set at 2.45119, just above the resistance zone.
This protects against a breakout if the price continues upward instead of reversing.
Entry Confirmation
Price action shows a sharp upward movement into the resistance area.
If price starts rejecting this zone (e.g., bearish candlestick patterns like pin bars or engulfing candles), it could confirm a sell entry.
Target Point (Blue Line at 2.42868)
The take-profit level is set at 2.42868, suggesting a downward move if price reverses.
This area might act as the next support zone.
Exponential Moving Averages (EMAs)
30 EMA (Red Line): 2.43595 (Short-term trend indicator).
200 EMA (Blue Line): 2.43464 (Long-term trend indicator).
Price is currently above both EMAs, which suggests a bullish trend, but the resistance zone might trigger a reversal.
Trading Strategy Suggestion
✅ Bearish Setup: Look for rejection signals in the sell zone before entering a short trade.
✅ Risk-Reward Ratio: The stop-loss is tight compared to the potential profit target, making it a favorable setup.
✅ Confirmation Needed: A clear bearish signal (e.g., a strong rejection candle) can increase trade confidence.
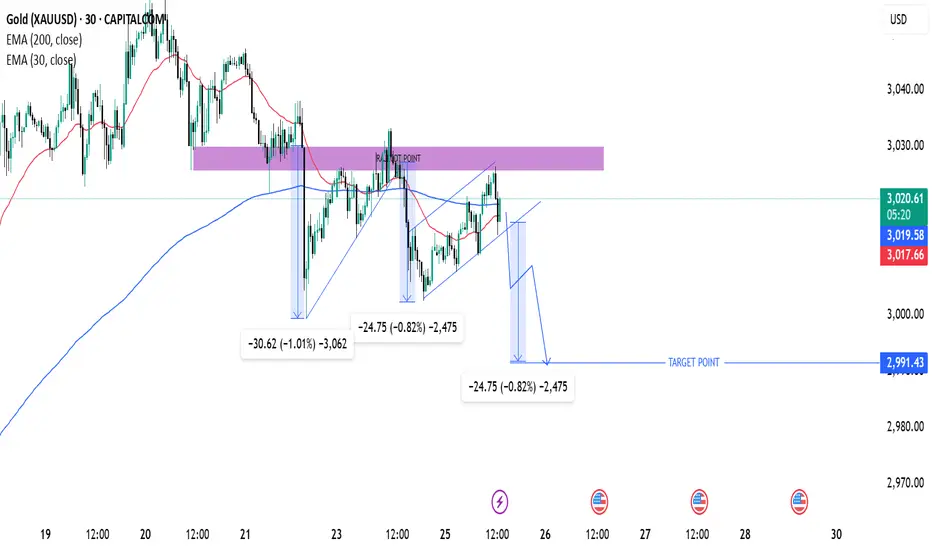
Gold (XAU/USD) Bearish Setup – Potential Drop to $2,991This is a trading setup for Gold (XAU/USD) on the 30-minute timeframe, showing a potential bearish move.
Analysis:
Key Indicators:
200 EMA (blue line) at 3,019.55: Acting as a resistance level.
30 EMA (red line) at 3,017.45: Providing short-term trend guidance.
Price Action & Structure:
The price previously rejected from a resistance zone (purple area) and started forming lower highs.
Repeated bearish patterns suggest another potential drop.
The chart highlights measured moves of previous declines (-30.62, -24.75), indicating a possible repeat of the pattern.
Trade Setup:
Bearish Outlook: Price is expected to drop towards the target point at 2,991.43.
Entry: Near the break of the lower trendline in the ascending wedge.
Target: 2,991.43 (marked as "TARGET POINT").
Risk Management: Ensure proper stop-loss placement above recent highs.
Conclusion:
If price respects the pattern, a downward move is likely.
A confirmed break below support could accelerate the drop.
EUR/USD Short Trade Setup – Key Resistance Rejection & Bearish TEntry Zone:
The entry for the short trade is around 1.08405 - 1.08412.
The price is expected to rise into this area before reversing downward.
Stop Loss:
Positioned at 1.08760 - 1.08770, above the resistance zone marked in purple.
This ensures the trade is invalidated if price moves too high.
Take Profit Levels (TP):
TP1: 1.07987
TP2: 1.07620
TP3: 1.07107
Final Target: 1.06604
Indicators Used:
200 EMA (Blue Line): At 1.08405, acting as resistance.
30 EMA (Red Line): At 1.08086, showing short-term trend direction.
Overall Trade Idea:
Price is expected to reject the 1.08412 resistance zone and move downward.
If the price respects the resistance, a strong bearish move toward the 1.06604 target is anticipated.
Potential Trade Plan:
Sell at: ~1.08405
Stop Loss: ~1.08760
Take Profit: Staggered at TP1, TP2, TP3, or full exit at 1.06604.

Bitcoin (BTC/USD) 2H Analysis: Potential Bullish Continuation or30 EMA (Red, 86,440): Indicates short-term momentum.
200 EMA (Blue, 85,153): Represents long-term trend support.
Support and Resistance Zones
Support Zone (Purple Box - ~86,271 to 85,153): Price is likely to bounce from here.
Resistance Zone (~87,149 and above): Breakout above this could push price higher.
Trade Setup
Entry Consideration: The price is currently testing a demand zone (purple) after a pullback.
Target (Take Profit - 90,118): Expecting a bullish move.
Stop Loss (~86,658 or lower): To manage risk.
Potential Price Action
If Bitcoin holds above the purple demand zone and 30 EMA, it could rally to 90,118.
A breakdown below 86,271 could push it toward 84,366 or lower.
Conclusion
Bullish Bias: If price holds above the support level.
Bearish Risk: If it breaks below the purple zone.
Recommendation: Monitor support at 86,271 and 85,153, as a bounce from these areas could confirm an uptrend.

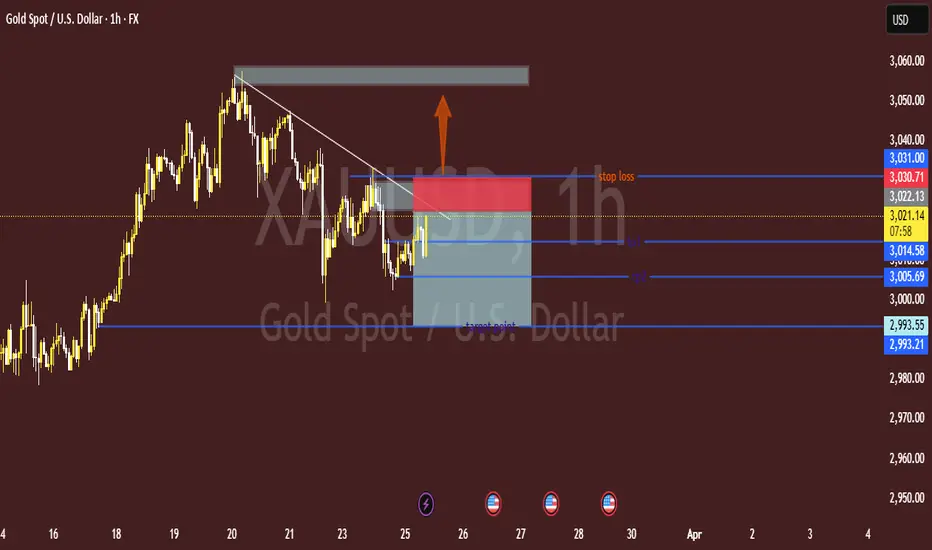
"XAU/USD (Gold) Potential Reversal Setup — Bullish Recovery or FAlright! Let's break down the chart analysis for XAU/USD (Gold vs. USD) 📊💛:
Structure & Trend:
The market is in a corrective phase after a clear downtrend. The trendline break shows potential bullish momentum.
Zone Analysis:
The gray box represents a supply zone (strong resistance). Price may struggle to break above this area.
The target points (TP1 and TP2) are likely support levels where price might react if it drops.
Trade Setup:
The blue box indicates the potential buy zone with a stop loss slightly below it.
The stop loss is set around 3,030.71 - 3,031.00, aiming to minimize risk.
TP1: 3,014.58 — Short-term target.
TP2: 3,005.69 — A more conservative, safer target.
Bias:
The bullish arrow suggests a possible move upward if the price can maintain above the current support.
📌 Conclusion:
If you plan to buy, wait for a strong bullish confirmation (like a bullish engulfing candle) before entering.
If price breaks the stop loss level, a deeper drop may occur toward 2,993.55 - 2,993.21.
Gold (XAU/USD) 15-Minute Analysis – Bearish Reversal from ResistThis chart is a 15-minute timeframe analysis of Gold (XAU/USD) using TradingView. Here's the breakdown of the analysis:
Key Levels & Setup:
Entry Zone (ENTRE): Around 3,004.172 - 3,003.999
Stop Loss (SL): 3,010.919 - 3,010.746 (Above the resistance zone)
Take Profit Targets:
TP1: 2,995.869
TP2: 2,987.219
TP3: 2,980.646
Technical Indicators:
Exponential Moving Averages (EMAs):
EMA 30 (Red Line): 2,992.313 (Short-term trend)
EMA 200 (Blue Line): 2,978.242 (Long-term trend)
Market Structure & Trade Idea:
The price is near a resistance zone (purple area), indicating a potential short-selling opportunity.
If the price fails to break above the resistance and reverses, it could drop toward the take profit levels.
The risk-to-reward ratio looks favorable, with the stop loss set just above resistance.
A break below the 30 EMA could further confirm bearish momentum toward 200 EMA.
Trade Execution Plan:
Short Entry: If the price respects the resistance area and starts to reject downward.
Stop Loss: Above the resistance at 3,010.919.
Take Profits: TP1, TP2, and TP3 as per the marked levels.
Conclusion:
Bearish Setup: If price rejects resistance.
Bullish Risk: If price breaks above resistance and holds, the trade setup is invalid.

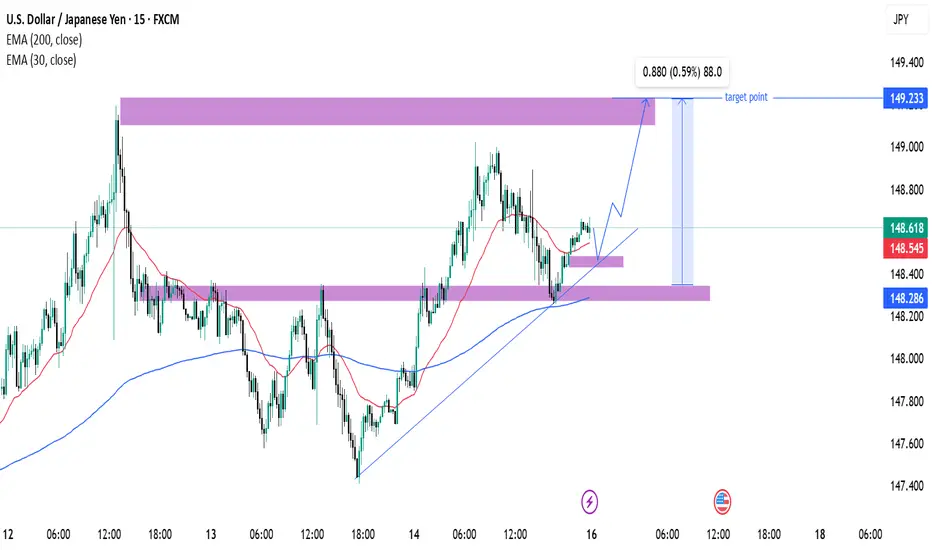
USD/JPY Technical Analysis & Trade Outlook – March 16, 2025Current Price: 148.618
EMA (30): 148.545 (short-term trend)
EMA (200): 148.286 (long-term trend)
Resistance Zone: 149.233
Support Zone: 148.286
Analysis & Price Action:
The price is trending upwards, forming higher lows, indicating bullish momentum.
The price is above both the 30 EMA and 200 EMA, which suggests an ongoing uptrend.
A support level around 148.286 is holding, reinforcing a bullish bias.
Forecast & Trade Plan:
A potential breakout above the minor resistance could push USD/JPY towards the 149.233 target.
If price retraces, a bounce off 148.286 would present a buy opportunity.
If price breaks below 148.286, the bullish outlook weakens, and further downside may follow.
📌 Bias: Bullish towards 149.233
📌 Confirmation: Watch price action at support and resistance levels
📌 Risk Management: Consider stop-loss below 148.200 to protect downside.
Would you like further details on trade entry points
TECHNICAL CLASS of trading Technical trading is a broader style that is not necessarily limited to trading. Generally, a technician uses historical patterns of trading data to predict what might happen to stocks in the future. This is the same method practiced by economists and meteorologists: looking to the past for insight into the future.
Algo Trading Made Easy.
Technical Trading Made Easy: Online Certification Course.
Stock Valuation Made Easy.
Candlesticks Made Easy: Candlestick Pattern Course.
Options Trading Made Easy: Options Trading Course.
Commodity Markets Made Easy: Commodity Trading Course.

🚀 Swing Trading Idea: Buy Position in GalaxySurf 🚀Analysis: GalaxySurf shows strong uptrend potential with solid fundamentals and technical indicators.
Entry: Consider current price
Disclaimer: For informational purposes only. Do your research or consult a financial advisor.

PNBHOUSING may break up move after Consolidation a rangeThis stock consolidating from couple of days and respect a level of758.40 .If it cross 780 level with good volume then we can see a good up trend .

A PERFECT EXAMPLE OF CUP AND HANDLE PATTERN ON FSL STOCKWhat is the cup pattern?
Cup and Handle Pattern is a bullish continuation pattern that signals a strengthening of a security's price followed by a breakout, after which the scrip's price soars up. The U-shaped cup represents the era of consolidation, while the handle represents the moment of breakout.
How to trade ?
The buy point occurs when the stock breaks out or moves upward through the old point of resistance
the volumes are also increasing mean its ready to break the cup

It seems to be good bullish bank niftyAs you can see in the chart bank nifty follows a double bottom to make an uptrend and it continues following the previous downtrend line at this point may be it can show us some consolidation or correction soo take your step carefully.

► ADVANCE PATTERN #29: SYNGENE ◄► ADVANCE PATTERN #29: SYNGENE ◄
📌 Levels are mentioned on chart for ❝Swing trading❞.
☆ Please check the description section ⌨ for early entry level in given stock ₪ to get better Risk to Reward (☈☈) ratio.
☆ Kindly like & share ➥ this pattern. Comment ⎚ with what do you think. Follow me @ tradingview for more updates and like the chart ❤!!!
Entry: ▲ 630
SL: ☢ 605
Target: ➚ 705
RR: ☈ 1:3.0
☆ Thank you. Happy Trading!!!
Best Regards,
𝘿𝙧. 𝙎𝙝𝙖𝙢𝙧𝙖𝙟𝙖 𝙉𝙖𝙙𝙖𝙧
𝙋𝙝𝘿 𝙞𝙣 𝙏𝙚𝙘𝙝𝙣𝙤𝙡𝙤𝙜𝙮.
✮ Disclaimer ✮
--------------------------------------------------------
All investments involve risk, and the past performance of a security, industry, sector, market, financial product, trading strategy, or individual’s trading does not guarantee future results or returns. Investors are fully responsible for any investment decisions they make. Such decisions should be based solely on an evaluation of their financial circumstances, investment objectives, risk tolerance, and liquidity needs.
---------------------------------------------------------


Indigo short #Elliot_HarishRaoNormal Flat correction
indigo complete wave A or wave B mark red colour circle and stock move downside Wave C in interal 1,2,3,4,5

Bancor/TetherUSDT #Elliot_HarishRaoBancor / Tether USD wave analysis
wave A internal wave 1,2,3,4,5
Wave B internal wave a,b,c
Wave c internal wave 1,2,3,4,5

BGRENERGYPrice has broken the channel pattern as well as the higher time frame trend line with a huge bullish candle now the price can continue the momentum or consolidate from the IMP level and retest the channel pattern and then continue its uptrend.."EDUCATIONAL PURPOSE"..


PRICE ACTION SETUP FOR GOLDOANDA:XAUUSD
Market is ranging between 1779.028 and 1774.139
There is a buying opportunity above 1780.364
And a selling opportunity below 1772.955
Wait unlit it breaks these levels or 30min candle closes above this levels.
Trick :
For impulse entry trade at London or NY Timing,
When 30min candle cross these levels switch to 1min or 5min time frame for best entry!
Trade at your own risk

NIFTY 50As price is in a falling parallel channel with multiple rejection from bottom and top trendline the price can give a possible breakout in coming days or there can be a fall if the covid 19 scenario does not improve. " EDUCTIONAL PURPOSE "
