Gold Retracement After 200-Point Fall — Watch for a Rejection!Price Action in Focus | Short Setup on Key Resistance Zone
Gold (XAUUSD) posted a sharp 200-point drop from the all-time high at 4380 on Friday. The current move looks like a technical retracement, not a reversal — a classic dead-cat bounce scenario? 🐈📉
📍 Key Resistance Zone: 4280 – 4300
Price is now testing this zone, which previously acted as a breakdown level. If sellers step in here, we could see another leg lower.
🔍 Short Bias Setup (Not Financial Advice):
🧭 Sell Zone: 4280 – 4300
❌ Invalidation (SL): Above 4321
🎯 Targets: 4241 and 4221
💬 Watching for bearish confirmation before executing — candle wicks, volume spike, or RSI divergence could seal the deal.
⚠️ This is a technical idea, not financial advice. Always manage risk and confirm with your own strategy.
🔔 Follow for live chart updates, breakdowns & strategy threads!
Your feedback drives our content and keeps everyone trading smarter. Let’s make those pips together! 🚀
Happy Trading,
– The InvestPro Team
Commodities

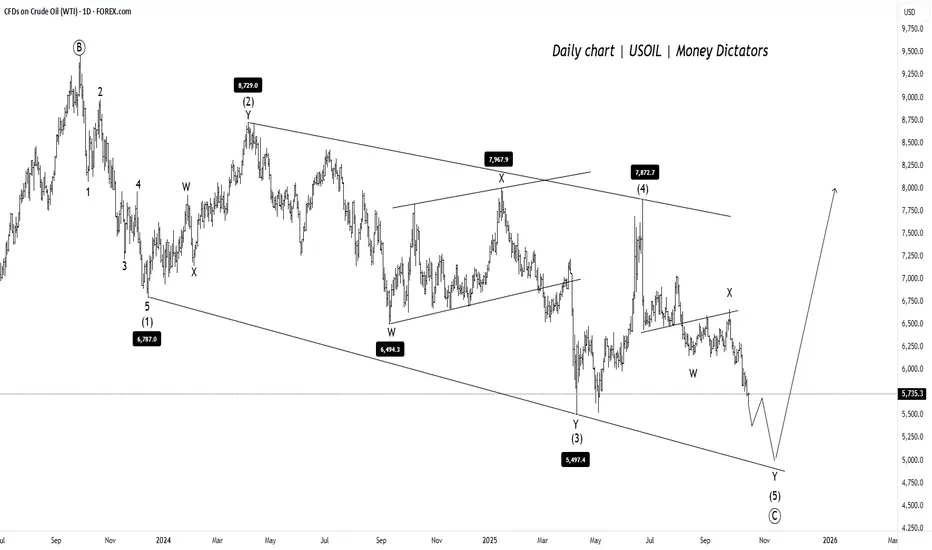
USOIL Near Final Leg USOIL is forming a clear corrective pattern inside a falling channel. Price is currently in the final leg of wave (5) of (C), suggesting one more dip is likely before reversal.
The downside target lies near 5,000–5,200 , where support from the channel base aligns. Once this level holds, a strong bullish reversal is expected, marking the end of the correction and the start of a new upward trend.
Stay Tuned!
@Money_Dictators :)
Crude Oil (WTI) Technical Analysis - October 17, 2025Current Price and OverviewAs
WTI Crude Oil is trading at 56.88 USD, down 0.58 (-1.01%) on the day. The market remains firmly in a bearish trend, with prices continuing to decline amid broader impulse wave C within a multi-month downtrend that began in July. Recent trading saw a brief rebound after testing support near 56.35, providing some positive momentum and easing oversold conditions, but the overall short-term outlook stays bearish. A bearish gap has formed below the key psychological level of 60.00, accelerating the downside.The technical summary across major indicators points to a Strong Sell, with no buy signals from moving averages and MACD confirming downward pressure.
Support and Resistance LevelsKey
Support Levels: 56.35 (immediate, recently tested), 49.5. (next major, deeper target zone 27 - 15 ).
Key Resistance Levels: 57.60–60.50 (Gold Zone, recent breakdown),
65.00 (major overhead resistance,
Price Action and Scenarios
Bearish Scenario (Primary): Prices have broken key support at 57.35 and the down-channel trendline, confirming continuation of wave C. Expect further downside to 55.20, with potential extension to 49.83 if momentum builds. Short positions are favoured on rebounds to resistance
Bullish Scenario ( Still Not Confirmed)
This analysis is based on hourly and daily charts; always consider fundamental factors like OPEC decisions or US inventory reports for confirmation.
Disclaimer
High Risk Investment
Trading or investing in assets like crypto, equity, or commodities carries high risk and may not suit all investors.
Analysis on this channel uses recent technical data and market sentiment from web sources for informational and educational purposes only, not financial advice. Trading involves high risks, and past performance does not guarantee future results. Always conduct your own research or consult a SEBI-registered advisor before investing or trading.
This channel, Render With Me, is not responsible for any financial loss arising directly or indirectly from using or relying on this information.

USDCHF (U.S. Dollar / Swiss Franc) 1-hour chart... USDCHF (U.S. Dollar / Swiss Franc) 1-hour chart.
Here’s what I can read from my setup:
The price has been in a downtrend, shown by the descending trendline.
There’s a bullish breakout attempt from that trendline.
Two target points are marked above the current price — both inside and above the Ichimoku Cloud (suggesting possible bullish recovery targets).
🔍 Technical Breakdown:
Current price: ≈ 0.7921
First target point: ≈ 0.7965 – 0.7970
Second (main) target point: ≈ 0.8010 – 0.8020
🎯 Targets:
1. TP1: 0.7965 → retest of lower cloud resistance
2. TP2: 0.8010 → full cloud breakout / upper structure resistance
⚔ Suggested Stop-Loss (for buy setup):
Below recent swing low → around 0.7900 – 0.7910
✅ Summary:
Direction Entry (approx) Target 1 Target 2 Stop Loss
BUY 0.7920 0.7965 0.8010 0.7900

XAUUSD (Gold/USD) chart (1-hour timeframe)... XAUUSD (Gold/USD) chart (1-hour timeframe), here’s a breakdown of what’s visible:
Price has broken below an ascending trendline and dropped into the Ichimoku Cloud.
My marked target point below, around the 4,100–4,120 zone.
Current price: ≈ 4,217 USD.
Cloud support seems to extend down to roughly 4,100–4,080, and the horizontal support line drawn near the bottom confirms that area as the next target/support level.
✅ Technical Summary (from chart):
Trend: Short-term bearish correction.
Immediate support/target: ≈ 4,100–4,080.
Resistance: Around 4,260–4,285 (top of cloud / broken trendline retest).
📉 Target:
> 🎯 4,100 – 4,080 zone
That’s my likely downside target if price continues following the bearish momentum and cloud support break setup.

GOLD / XAUUSD – DAILY PLAN (Oct 17, 2025)🧭 MARKET CONTEXT
Main timeframe: M30 / H1
Current structure remains bullish, forming clear HH – HL sequences.
After a strong rally, price is now in a retracement phase toward a nearby demand zone aligned with the ascending trendline.
No sign of structure break yet (no BOS below the previous HL).
📈 PRIMARY SCENARIO (BUY SETUP)
➤ Entry Zone 1:
BUY GOLD 4280 – 4278
Stop Loss: 4275
Target 1: 4335
Target 2: 4350 (new HH)
Reason: This is a Bullish Order Block (OB) and BOS retest zone, aligned with the rising trendline.
Expecting a strong bullish reaction (rejection candle or engulfing bar) before triggering the buy limit.
➤ Entry Zone 2 (CP Setup – Confirmation Point)
BUY 4247 – 4245
Stop Loss: 4239
Target: 4300 / 4330 / 4350
Reason: This is the final demand zone near the main trendline, confluence of prior BOS + SSS (Structure Shift Support).
If price breaks below 4280 without reaction, patiently wait for confirmation around CP zone.
⚠️ ALTERNATIVE SCENARIO (STRUCTURE FAILURE)
If price closes below 4235 on M30, the bullish structure is invalidated.
→ The buy plan is canceled — wait for a pullback sell setup from 4280–4300 resistance.
If the buy stop loss is hit at 4239, monitor 4200 zone as the next H4 demand area.

Introduction to MCX Commodity Trading1. What is Commodity Trading?
Commodity trading refers to the buying and selling of raw materials or primary products, typically classified into two broad categories:
Hard Commodities: Natural resources that are mined or extracted, such as gold, silver, crude oil, and copper.
Soft Commodities: Agricultural products or livestock, including sugar, cotton, wheat, and coffee.
Unlike equities, commodities are traded for their intrinsic value and are influenced by supply-demand dynamics, geopolitical factors, and global economic trends. Trading commodities allows investors not only to profit from price movements but also to hedge against inflation and currency fluctuations.
2. Overview of MCX (Multi Commodity Exchange)
The Multi Commodity Exchange of India Limited (MCX) is the largest commodity derivatives exchange in India. Established in 2003, MCX provides a platform for trading commodity futures, ensuring transparency, liquidity, and regulatory oversight. Key features of MCX include:
Diverse Commodity Offerings: MCX trades in bullion, metals, energy, and agricultural commodities.
Futures Contracts: Investors primarily trade in futures contracts, which are standardized agreements to buy or sell a specific quantity of a commodity at a predetermined price on a future date.
Regulated Environment: MCX is regulated by the Securities and Exchange Board of India (SEBI), ensuring market integrity and investor protection.
Efficient Settlement System: MCX employs secure clearing and settlement mechanisms, reducing counterparty risk.
By providing a robust marketplace, MCX has played a critical role in bringing Indian commodity trading in line with global standards.
3. Understanding Commodity Futures
Unlike spot trading, where commodities are bought or sold for immediate delivery, futures contracts allow traders to speculate on price movements without necessarily owning the physical commodity. Key components of a futures contract include:
Contract Size: Defines the quantity of the commodity covered.
Expiry Date: The date on which the contract is settled.
Lot Size: Standardized unit of trading to maintain market uniformity.
Margin Requirement: Traders must deposit a percentage of the contract value as margin, which ensures commitment and reduces default risk.
Example:
If a trader buys a gold futures contract at ₹50,000 per 10 grams for delivery in June, the trader is obligated to purchase 10 grams of gold at that price in June. However, most traders close their positions before expiry to avoid physical delivery.
4. Categories of Commodities on MCX
MCX offers trading in several categories:
4.1 Bullion
Gold and Silver are the most traded commodities.
Prices are influenced by global demand, currency fluctuations, inflation, and geopolitical tensions.
4.2 Base Metals
Commodities such as copper, aluminum, zinc, and nickel.
Prices are affected by industrial demand, mining output, and global economic conditions.
4.3 Energy
Includes crude oil, natural gas, and other petroleum products.
Heavily influenced by global supply-demand, OPEC policies, and geopolitical factors.
4.4 Agricultural Commodities
Examples: Cotton, cardamom, chana, and sugar.
Influenced by monsoon patterns, crop yields, government policies, and international trade.
5. Participants in MCX Commodity Trading
Understanding the key players helps in interpreting market movements:
Hedgers: Typically producers or consumers of commodities who aim to reduce the risk of price fluctuations.
Example: A gold jeweler hedging against rising gold prices.
Speculators: Traders who seek to profit from price changes without intending to take physical delivery.
Arbitrageurs: Exploit price differences between commodities on different exchanges or in spot versus futures markets.
Institutional Investors: Banks, mutual funds, and hedge funds often participate to diversify portfolios.
6. Advantages of Trading on MCX
Trading on MCX provides multiple benefits:
Transparency: Prices and volumes are publicly available, reducing market manipulation.
Liquidity: High trading volumes make entering and exiting positions easier.
Hedging Opportunities: Producers and consumers can lock in prices, mitigating risk.
Leverage: Traders can control large contract values with relatively small margin deposits.
Diversification: Exposure to commodities reduces portfolio dependency on equities and bonds.
Price Discovery: MCX plays a key role in determining fair market prices through supply-demand mechanisms.
7. Risks in Commodity Trading
Despite its opportunities, commodity trading involves significant risks:
Market Risk: Prices can fluctuate sharply due to global events, weather, or policy changes.
Leverage Risk: While margin trading amplifies profits, it also magnifies losses.
Liquidity Risk: Some commodities may have lower trading volumes, making it difficult to exit positions.
Regulatory Risk: Changes in government policies, taxes, or import/export duties can impact prices.
Operational Risk: Technical glitches, delays, or errors in trading platforms may affect execution.
A prudent trader combines technical, fundamental, and geopolitical analysis to navigate these risks.
8. How to Start Trading on MCX
Step 1: Open a Trading Account
Investors need to open a commodity trading account with a registered broker. Required documents include PAN card, Aadhaar, bank proof, and KYC verification.
Step 2: Choose Commodities
Select commodities based on market research, risk appetite, and trading strategies.
Step 3: Deposit Margin
A minimum margin, defined as a percentage of the contract value, must be deposited to initiate trades.
Step 4: Place Orders
Orders can be placed using online trading platforms, specifying the quantity, contract month, and price.
Step 5: Monitor Positions
Regularly track market movements, news, and global events that influence commodity prices.
Step 6: Close Positions
Traders can either settle at contract expiry or close positions early to book profits or limit losses.
9. Trading Strategies for MCX Commodities
Successful trading involves strategy and discipline. Common approaches include:
9.1 Technical Analysis
Uses historical price patterns, charts, and indicators like moving averages, RSI, and MACD.
Helps identify entry and exit points.
9.2 Fundamental Analysis
Examines supply-demand factors, geopolitical events, government policies, and global trends.
Particularly important for agricultural commodities and energy markets.
9.3 Hedging
Aims to minimize potential losses for businesses exposed to commodity price fluctuations.
Example: A farmer selling wheat futures to secure prices before harvest.
9.4 Arbitrage
Exploits price differences between spot and futures markets or across exchanges.
Requires quick execution and access to multiple trading venues.
10. Factors Influencing Commodity Prices
Commodity prices are driven by multiple interrelated factors:
Global Economic Conditions: Growth or slowdown impacts industrial metals, energy, and demand for commodities.
Currency Movements: Commodities priced in USD are sensitive to exchange rate fluctuations.
Geopolitical Events: Wars, sanctions, and political instability can create volatility.
Weather and Climate: Agricultural commodities are heavily dependent on rainfall, monsoons, and climate change.
Government Policies: Subsidies, import/export restrictions, and price controls affect domestic prices.
Market Speculation: Traders’ sentiment and speculative positions can influence short-term price movements.
11. Regulatory Framework
MCX operates under SEBI regulations and follows strict compliance norms:
Position Limits: Prevent market manipulation by limiting maximum allowable contracts.
Margin Requirements: Ensure traders have sufficient funds to cover potential losses.
Contract Specifications: Standardize trading to maintain uniformity.
Dispute Resolution: Provides mechanisms for grievances and market disputes.
This robust framework enhances investor confidence and promotes fair trading.
12. Technology in MCX Trading
Modern commodity trading relies heavily on technology:
Online Trading Platforms: Allow seamless access to live market data and order execution.
Algorithmic Trading: High-frequency and automated trading based on pre-set rules.
Risk Management Systems: Track margin requirements, position limits, and real-time exposure.
Mobile Applications: Provide flexibility to trade and monitor positions on the go.
Technology has made MCX accessible to both retail and institutional traders.
13. Conclusion
MCX commodity trading offers an exciting avenue for diversification, profit-making, and hedging against market uncertainties. By understanding the nuances of futures contracts, market dynamics, and trading strategies, investors can navigate the complex world of commodities effectively. While risks exist, informed decision-making, disciplined strategies, and continuous learning can make commodity trading a rewarding endeavor.
For beginners, it is recommended to start with smaller positions, focus on learning market patterns, and gradually expand exposure. For professionals, leveraging advanced analytical tools and global insights can enhance profitability. Ultimately, MCX trading embodies a blend of knowledge, strategy, and market acumen, opening doors to opportunities that extend beyond traditional investment avenues.
XAUUSD Builds Upward PressureGold continues to trade within a strong upward trajectory,showing consistent momentum and firm buyer engagement.The market structure indicates ongoing accumulation,with price maintaining stability after minor corrective movements.Buy-side activity remains dominant,reflecting confidence among institutional participants as the metal sustains its trend within an orderly channel.While short-term pullbacks may occur for liquidity rebalancing,the broader outlook remains decisively bullish as long as momentum persists and demand continues to support higher valuations.

Now the Buyer's trap on XAUUSD/Gold 16/10/25Last video, it was quite evident about the seller trap, and it gave a good 60USD run.
Now comes the example of a buyer's trap.
Technically, DXY is also set for a bullish run, hence prices are expected to pull back in GOLD/XAUUSD now.
The strategy for both sides of the trading plan is shared in the video.

Gold Bulls Unstoppable Another All-Time High! Gold continues its unstoppable march north, printing fresh all time highs almost daily. Despite a brief shakeout over the past couple of sessions, buyers stepped in aggressively, confirming strong demand on every dip.
From a technical perspective, the uptrend remains firmly intact. Price is comfortably holding above the 4,200 zone, which now acts as immediate support. The volume profile shows a significant cluster around 4,190–4,205, indicating strong buying interest in this area this is the level to watch for short term structure.
On the fundamental side, the macro backdrop continues to support gold: geopolitical tensions, central bank accumulation, and lingering inflation expectations all add fuel to the rally.
Bulls are clearly in control, and as long as gold sustains above 4,200, the path of remains up also watch two rising trendline carefully in case of breakdown we can expect pullback ., the move is getting a bit extended, so we have be cautious with fresh entries at these stretched levels.

XAUUSD | Gold Holds Firm as Buyers Dominate the MarketGold continues to demonstrate a strong and orderly bullish structure, with momentum sustained by a combination of market confidence and macroeconomic positioning. The metal’s consistent upward drive reflects ongoing demand for safety amid lingering inflationary concerns and uncertainty surrounding global economic recovery. Institutional accumulation remains visible, suggesting that investors are positioning ahead of potential policy adjustments and currency fluctuations.
The recent moderation phase appears to be a controlled pause rather than weakness, indicating that buyers are maintaining control while the market digests prior gains. Should current stability in yields persist and geopolitical tensions remain elevated, gold could extend its advance in the medium term, reaffirming its role as a key hedge within diversified portfolios.

Gold or Equities? A Crucial Turning Point Ahead#NIFTY/GOLD Ratio (Monthly Timeframe)
📊 What Is the NIFTY/GOLD Ratio?
NIFTY/GOLD ratio measures how the Indian equity market (#NIFTY) performs relative to #Gold over time.
Ratio ↑ = NIFTY outperforming Gold
Ratio ↓ = Gold outperforming NIFTY
📍 Current Market Structure
The ratio is now:
Approaching the long-term rising yellow trendline (dynamic support)
Converging with horizontal price structure zones (white dotted lines)
This confluence forms a major support zone — a potential bounce region .
📈 Trend Insight:
✅ Primary Trend: Long-term uptrend (favoring NIFTY)
⚠️ Short-Term: At a critical decision point
🧭 Scenarios:
✅ Bounce from support → NIFTY may begin outperforming Gold again
❌ Breakdown below support → Gold likely continues its outperformance
⏳ Neutral for now → Wait for confirmation (bullish reversal candle or momentum shift)
🏁 Conclusion:
This is a key macro-info tip for asset allocation and long-term investing.
Use this ratio to guide shifts between equity and gold exposure.
#NiftyVsGold | #GoldVsEquity | #AssetAllocation | #InvestSmart | #Nifty50 | #GoldInvestment | #TechnicalAnalysis | #MarketTrends | #WealthBuilding | #LongTermInvesting

Markets Brace for U.S. Retail Sales & Fed Volatility XAUUSD – Intraday Trading Plan | by Ryan_TitanTrader
📈 Market Context
Gold prices hover near ₹4,190 after an early-week rally as traders brace for U.S. Retail Sales data and a new round of Federal Reserve speeches later today.
Recent gains were fueled by softer inflation readings, yet the dollar remains resilient amid hawkish undertones from Fed officials. Markets are now balancing between expectations of slower growth and persistent rate-cut caution.
A stronger-than-expected Retail Sales print could pressure gold temporarily, but any dovish signal from Fed speakers may quickly restore bullish momentum. Expect liquidity hunts on both sides before a confirmed direction forms.
🔎 Technical Analysis (1H / SMC Style)
• Structure remains bullish after multiple Breaks of Structure (BOS) and a recent Change of Character (ChoCH) confirmation.
• Price is approaching the Premium Zone (4211–4209) — a potential liquidity sweep area where short-term sellers may react.
• Below, the H1 FVG Buy Zone (4145–4149) offers a discount entry aligned with recent BOS support and previous mitigation points.
• Maintaining a bullish bias while awaiting clean reaction within the FVG zone is key for continuation toward new highs.
🔴 Sell Setup: 4211 – 4209
SL: 4218
TP targets: 4190 → 4175 → 4155
🟢 Buy Setup: 4145 – 4147
SL: 4138
TP targets: 4170 → 4190 → 4220+
⚠️ Risk Management Tips
• Wait for M15 ChoCH/BOS confirmation before entry to avoid false breaks.
• Expect high volatility around Retail Sales and Fed remarks — spread widening is likely.
• Partial take-profits near intra-day liquidity points are recommended.
✅ Summary
XAUUSD remains bullish on structure but faces a potential liquidity grab around 4211–4209 before retracing into the H1 FVG buy zone (4145–4149).
Smart money may seek to accumulate long positions after a controlled pullback, especially if Fed commentary echoes a slower policy tightening path.
Intraday bias leans Buy the Dip, with caution around macro-driven volatility spikes.

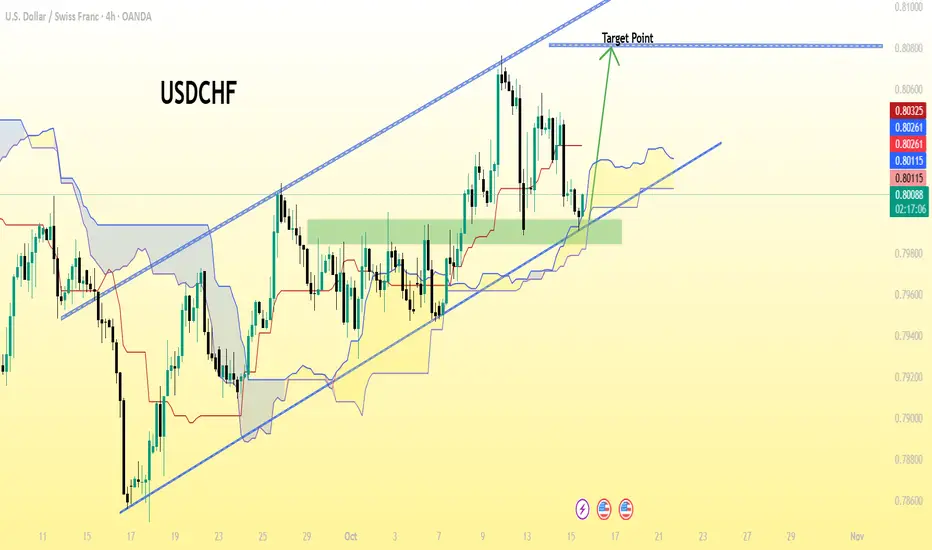
USD/CHF (U.S. Dollar vs. Swiss Franc) on the 4-hour timeframe...USD/CHF (U.S. Dollar vs. Swiss Franc) on the 4-hour timeframe.
From my chart :
The price is moving in an ascending channel.
A green support zone has been marked near 0.8000 – 0.8020.
The upper trendline of the channel is marked as the “Target Point.”
That line aligns approximately with 0.8080 – 0.8090 on the chart.
📈 Potential target area: 0.8080 – 0.8090
⚠ Note:
This is a technical projection based on the channel breakout/continuation pattern visible on my chart.
Price can fluctuate due to news or macroeconomic factors.
Always manage risk with stop loss — in this chart, a stop might logically sit below the support zone (~0.8000).
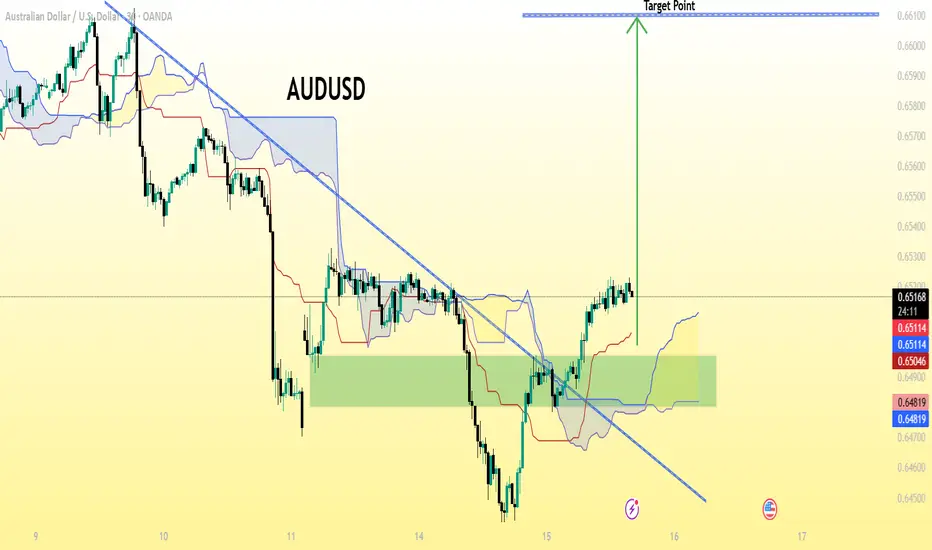
AUD/USD on a 30-minute timeframe (based on the visible labels)..AUD/USD on a 30-minute timeframe (based on the visible labels). Let’s break it down carefully:
The pair AUD/USD is currently trading around 0.6518.
The chart shows a bullish breakout above a descending trendline.
The green zone marked looks like a demand/support zone.
A target line is already drawn near the top of the chart, labeled “Target Point”.
🔍 Based on the chart:
The “Target Point” appears to be at approximately 0.6600 – 0.6605 level.
🧭 Summary:
Type Level
Entry Zone Around 0.6500–0.6520
Target (TP) 0.6600 – 0.6605
Stop Loss (SL) Likely below the green zone, around 0.6480
💡 Interpretation:
This setup seems to be a breakout + retest trade idea where the expectation is that AUD/USD will move upward about 80–100 pips toward the 0.6600 target area.
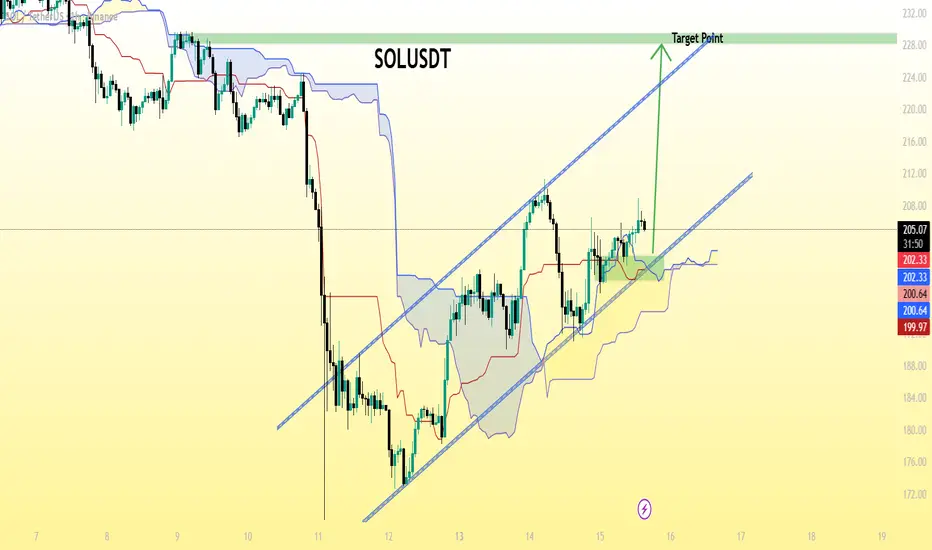
SOL/USDT chart pattern..SOL/USDT
The current price is around 205.5 USDT.
There’s a clear ascending trendline (blue line).
A breakout setup is indicated, with a marked “Target Point” near the top of the chart.
That target level appears to be around 230 USDT — the horizontal green line my labeled “Target Point.”
✅ Summary:
Current price: ≈ 205.5
Target price: ≈ 230 USDT
Upside potential: about +12% from the current level.
⚠ Note: Watch for support around 200–202 USDT (the Ichimoku cloud zone). If SOL holds that level, continuation toward 230 looks likely. A breakdown below the trendline could invalidate the move.
GOLD hits a new all-time high at $4,200 for the first time ever.🚨JUST IN: GOLD hits a new all-time high at $4,200 for the first time ever.
Now here’s the real question:
Will Gold retrace back to the $3,000–$2,500 zone soon?
That region aligns perfectly with the 0.382 Fibonacci retracement, a level where Gold has historically cooled off before launching its next major bull rally.
Eyes on the golden pullback before the next explosion.

Policy Developments in Derivatives and Commodities MarketsIntroduction
The derivatives and commodities markets are critical components of the global financial system. They provide essential tools for risk management, price discovery, and investment diversification. Derivatives—contracts whose value derives from underlying assets like commodities, equities, or currencies—enable participants to hedge against price volatility. Commodities markets, on the other hand, facilitate trading in raw materials such as oil, metals, and agricultural products.
Over the past few decades, these markets have witnessed significant evolution in both their structure and regulatory frameworks. Policymakers and regulatory authorities across the globe have introduced reforms to enhance transparency, reduce systemic risk, and promote market efficiency. These policy developments have become increasingly important in light of financial crises, technological advancements, globalization of markets, and growing participation from retail investors.
1. Historical Context of Derivatives and Commodities Regulation
The regulation of derivatives and commodities markets has evolved in response to market crises and structural changes. Historically, commodities trading, especially in agricultural products, was lightly regulated, primarily aimed at preventing fraud and market manipulation. In contrast, modern derivative markets grew exponentially in the 1980s and 1990s with the rise of financial engineering and complex instruments like options, swaps, and futures.
Major events that shaped policy include:
The 1987 Stock Market Crash: Highlighted the need for robust oversight of derivative instruments and their impact on financial markets.
The 2008 Global Financial Crisis: Exposed systemic risks inherent in over-the-counter (OTC) derivatives markets, prompting regulators to focus on transparency, collateralization, and centralized clearing mechanisms.
Commodity Price Volatility: Sharp swings in oil, metals, and agricultural products prices led to government interventions to stabilize markets, protect consumers, and ensure fair trading practices.
These events underscored the importance of developing robust regulatory frameworks to safeguard market integrity while fostering innovation.
2. Objectives of Policy Developments
Regulatory policies in derivatives and commodities markets aim to achieve several key objectives:
Market Integrity: Preventing manipulation, insider trading, and fraudulent practices.
Transparency: Ensuring that market participants have access to accurate and timely information about prices, trading volumes, and open positions.
Financial Stability: Reducing systemic risk that arises from excessive leverage, interconnected financial institutions, and OTC derivatives exposures.
Consumer Protection: Safeguarding investors, particularly retail participants, from misleading practices or excessive risk exposure.
Promotion of Market Efficiency: Ensuring smooth price discovery and liquidity in the markets.
Alignment with International Standards: Harmonizing domestic regulations with global best practices set by organizations such as the International Organization of Securities Commissions (IOSCO) and the Financial Stability Board (FSB).
3. Key Policy Developments in Derivatives Markets
3.1 Introduction of Central Clearing
One of the most significant reforms after the 2008 financial crisis was the push for central clearing of standardized OTC derivatives. Central counterparties (CCPs) act as intermediaries between buyers and sellers, reducing counterparty risk. Regulatory frameworks such as Dodd-Frank Act (USA, 2010) and the European Market Infrastructure Regulation (EMIR, EU, 2012) mandated clearing of certain interest rate and credit derivatives through CCPs.
Impact:
Reduced systemic risk from bilateral exposures.
Standardized collateral requirements.
Improved market transparency.
3.2 Trade Reporting and Transparency
Regulators worldwide have introduced mandatory trade reporting requirements to enhance transparency in derivatives markets. Trade repositories collect and publish data on derivative transactions, including notional amounts, counterparties, and trade dates.
Examples of regulatory measures:
Dodd-Frank Act: Requires real-time reporting of swaps transactions to swap data repositories.
EMIR: Obligates EU market participants to report derivative trades to trade repositories.
Impact:
Increased market visibility.
Facilitated monitoring of systemic risk and market abuse.
3.3 Margin and Collateral Requirements
To mitigate counterparty risk, regulators have introduced margin requirements for both cleared and non-cleared derivatives. Initial margin protects against potential default losses, while variation margin ensures that daily gains and losses are settled.
Impact:
Reduced excessive leverage in derivatives trading.
Promoted financial stability and investor confidence.
3.4 Standardization of Contracts
Policy frameworks encourage the standardization of derivative contracts to facilitate central clearing and improve liquidity. Standardization covers contract size, settlement dates, underlying asset definitions, and documentation standards.
Impact:
Easier to trade on exchanges or through CCPs.
Lower operational and legal risks for participants.
3.5 Risk-Based Supervision
Regulators are increasingly adopting risk-based approaches to monitor derivative markets. This involves focusing on systemically important institutions, products, and trading strategies that could pose the greatest risk to financial stability.
Impact:
Efficient use of regulatory resources.
Early identification and mitigation of systemic threats.
4. Key Policy Developments in Commodities Markets
4.1 Position Limits and Speculation Controls
Excessive speculative trading can destabilize commodity prices. Regulators have introduced position limits to restrict the number of contracts a participant can hold in futures markets. These limits aim to prevent market manipulation and excessive concentration of risk.
Examples:
Commodity Futures Trading Commission (CFTC) in the US sets speculative position limits for energy, metals, and agricultural contracts.
Securities and Exchange Board of India (SEBI) imposes position limits in commodity futures markets to curb volatility.
4.2 Market Surveillance and Anti-Manipulation Measures
Commodity exchanges and regulators have strengthened market surveillance to detect and prevent price manipulation, spoofing, and front-running. Sophisticated monitoring systems track trading patterns in real-time to identify anomalies.
Impact:
Enhanced investor confidence.
Reduced market distortions caused by artificial price movements.
4.3 Integration with Global Markets
Globalization of commodities trading has prompted harmonization of regulations across borders. Policymakers focus on aligning rules regarding contract specifications, reporting, and settlement to facilitate international participation.
Examples:
Cross-border recognition of clearinghouses.
Adoption of international standards on warehouse receipts and quality certification for agricultural commodities.
4.4 Commodity Derivatives for Hedging and Risk Management
Governments encourage the use of commodity derivatives for legitimate hedging purposes by producers, consumers, and traders. Policy initiatives include reducing regulatory burdens for hedgers while monitoring speculative activities.
Impact:
Enhanced price discovery and risk management.
Support for farmers, manufacturers, and energy companies in managing input costs.
4.5 Technological Innovations and Policy Adaptation
Digital trading platforms, algorithmic trading, and blockchain-based commodity exchanges have transformed the market landscape. Regulators are adapting policies to address new risks, including cyber threats, algorithmic market manipulation, and transparency challenges in decentralized trading.
Impact:
Improved market efficiency and accessibility.
Necessitated development of technology-driven monitoring tools.
5. Emerging Trends in Policy Development
Sustainability and ESG Integration: Policies increasingly emphasize environmental, social, and governance (ESG) compliance. Commodity trading in carbon credits, renewable energy certificates, and ESG-linked derivatives is growing.
Retail Participation Regulation: With growing retail interest in commodities and derivatives, regulators are introducing education initiatives, leverage limits, and product suitability requirements.
Cross-Market Risk Management: Integrated policies are addressing interconnected risks between derivatives, commodities, and other financial markets.
Global Coordination: Bodies like the IOSCO and FSB coordinate policy frameworks to prevent regulatory arbitrage and systemic instability.
6. Challenges in Policy Implementation
Despite significant reforms, regulators face several challenges:
Complexity of Derivative Products: Highly customized contracts are difficult to monitor and standardize.
Global Market Fragmentation: Different jurisdictions have varied regulatory standards, creating arbitrage opportunities.
Technological Disruptions: High-frequency trading, AI-based strategies, and decentralized exchanges introduce new risks.
Balancing Innovation and Risk: Policymakers must ensure that innovation is not stifled while protecting market participants.
7. Conclusion
Policy developments in derivatives and commodities markets have transformed these markets into safer, more transparent, and efficient mechanisms for risk management and investment. Central clearing, trade reporting, margin requirements, and position limits have enhanced market integrity and financial stability. Regulatory emphasis on transparency, standardization, and risk-based supervision has reduced systemic threats while fostering investor confidence.
As these markets continue to evolve with globalization, technological innovation, and ESG integration, policymakers must remain agile. Future regulatory frameworks are likely to focus on harmonizing global standards, enhancing surveillance capabilities, promoting sustainability, and safeguarding retail participants. Effective policy development in derivatives and commodities markets not only mitigates risks but also ensures that these markets continue to serve as vital tools for price discovery, hedging, and economic growth.
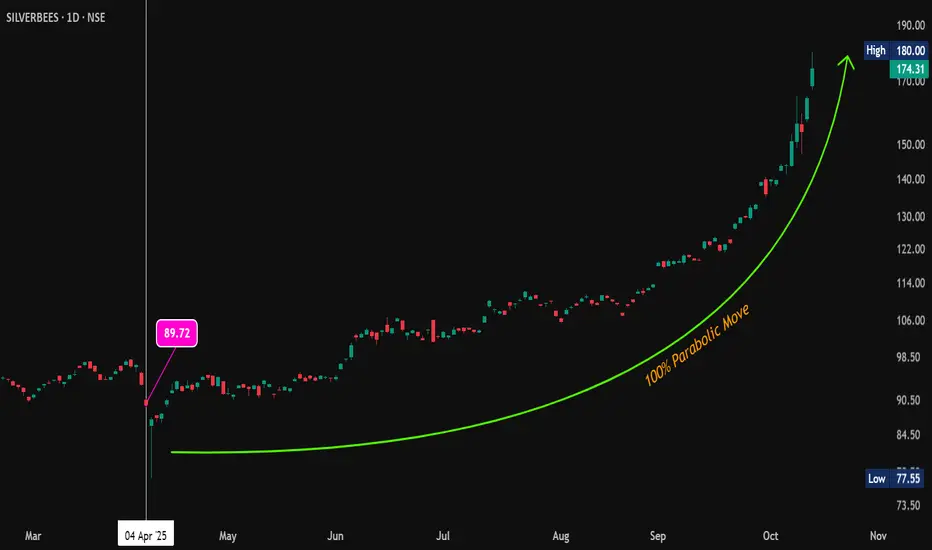
#SilverBees Doubled – Parabolic Move! #SilverBees
🚀 #SIP Strategy Delivers 💯%+ Returns 🥈🔥
On April 4, 2025 , suggested starting SIP in SilverBees at 89.72.
📉 The very next trading day , it dipped to 77.55 , a quick test of conviction.
📈 Since then, it’s been a parabolic rally to 180, with no looking back!
✅ Patience paid off
✅ SIP in commodities works, just like in stocks ( if started at the right time )
✅ Real assets like silver can be powerful wealth creators
⚠️ Going forward, be prepared for volatility.
After such a sharp move , price swings and corrections are normal. Stay disciplined and focus on your strategy.
🥈 Silver continues to shine. Are you riding the trend?
#SilverBees | #SilverETF | #Silver | #SIP | #ETF | #CommodityInvesting | #SmartInvesting
Gold → Ready for the Next Bullish WaveGold (XAUUSD) continues to gain momentum as shifting global conditions drive investors toward safer assets. The ongoing uncertainty in financial markets, coupled with renewed concerns over U.S. fiscal policy and interest rate adjustments, has strengthened gold’s long-term appeal.
Recent market behavior reflects consistent institutional demand, with traders positioning ahead of potential monetary easing cycles. As confidence in traditional currencies weakens, gold remains a preferred store of value for both investors and central banks.
Structurally, the market is maintaining a healthy uptrend, showing controlled corrections within a broader bullish framework. The latest price movements suggest that momentum is building for another upward phase, possibly targeting new historical zones if global instability persists.
In summary, gold’s outlook stays constructive — supported by both macroeconomic sentiment and steady technical momentum.
How do you see the XAUUSD trajectory evolving — continuation of growth or a major pause ahead?

Crude Oil FallImpact of fresh tarriff imposition on China by US has led to further fall in crude oil. Quoting below 200 EMA. If breaks the suppport then further fall can be seen this week.

Gold 1H – Price Reaction Ahead of U.S. Retail Sales & Fed RemarkXAUUSD – Intraday Trading Plan | by Ryan_TitanTrader
📈 Market Context
Gold is trading around the ₹4,110 mark, consolidating after a strong impulsive rally earlier this week.
Traders are now shifting focus to U.S. Retail Sales data and a series of Federal Reserve remarks due later today — both key drivers that could influence near-term expectations for the next rate decision.
After last week’s soft inflation signals, gold initially extended higher, but rising Treasury yields and cautious sentiment ahead of today’s macro releases have slowed momentum.
Any hawkish Fed tone or stronger consumer spending data could weigh on XAUUSD, triggering a liquidity sweep from the premium zones before the next accumulation phase begins.
🔎 Technical Analysis (1H / SMC Style)
• Structure shows a confirmed BOS on lower timeframes, signaling the end of the previous impulsive leg.
• Price currently sits within a Mitigation Zone (4117–4110), reacting to prior imbalance after a clean sweep of internal liquidity.
• The Premium Liquidity Zone (4217–4215) aligns with a Rejection Block and is likely to act as a short-term Sell Zone.
• Below, the 4056–4058 area marks a Buy-Side Support, overlapping with a previous ChoCH and internal discount OB.
• Expect a short-term sell reaction from premium zones before a possible bullish mitigation bounce off support.
🔴 Sell Setup: 4217–4215
SL: 4224
TP targets: 4200 → 4175 → 4160
🟢 Buy Setup: 4056–4058
SL: 4050
TP targets: 4070 → 4090 → 4100+
⚠️ Risk Management Tips
• Wait for M15 ChoCH / BOS confirmation before executing either setup.
• Be cautious during Fed remarks — volatility spikes are common around liquidity levels.
• If price reacts impulsively from 4217 with displacement, partial shorts are favored.
• Conversely, if 4056 holds and forms clean bullish structure, it could serve as the base for the next expansion leg.
✅ Summary
Gold is likely to engineer a liquidity grab in the premium zone (4217–4215) before retracing into the mitigation area near 4056–4058, where smart money may accumulate long positions.
The day’s direction will hinge on how markets interpret upcoming U.S. Retail Sales data and Fed tone — expect volatility and false breaks before the true directional move forms.

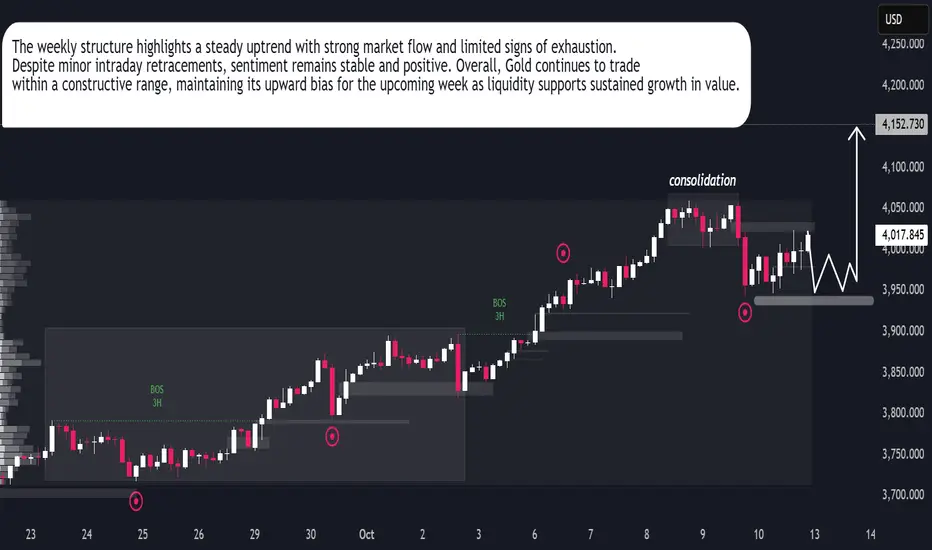
XAUUSD | Bulls Maintain Weekly ControlGold continues to display firm momentum as investor confidence remains stable despite short-term fluctuations. The latest weekly candle structure shows price holding within a steady consolidation range, signaling accumulation rather than weakness. Market behavior suggests large participants are preparing for another expansion phase after absorbing liquidity in the lower zones.
Institutional interest remains evident, with consistent buying pressure observed on dips, indicating sustained optimism for further growth. The current behavior aligns with broader market sentiment favoring safe-haven assets amid global uncertainty. Overall, Gold retains its dominance as capital flows stay supportive of the uptrend, positioning the metal for renewed strength in the upcoming sessions.