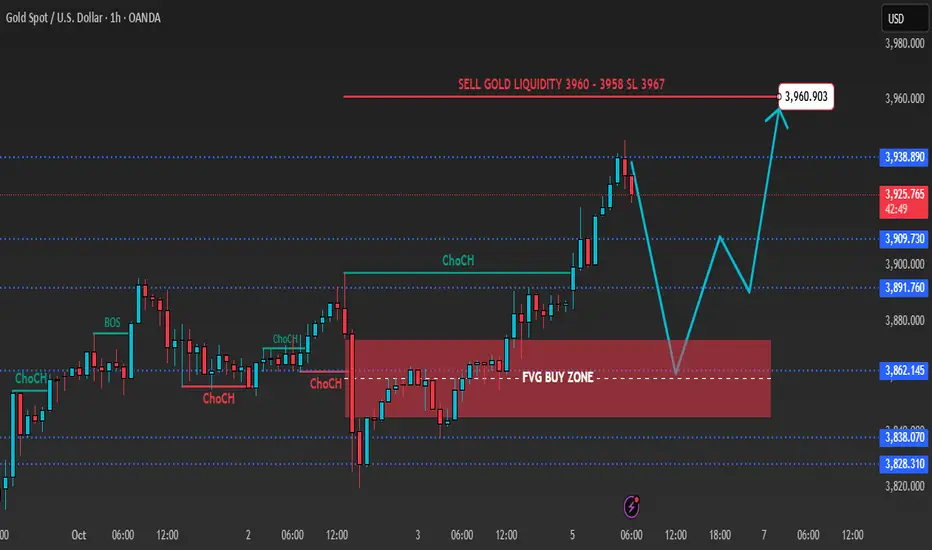
Gold 1H – Will CPI Repricing Push Gold Into FVG Reversal?Gold on the 1H timeframe is reacting near 3,928 after a clean structure break and buildup toward the premium zone 3960–3958, where liquidity remains above recent highs. Market structure shows a bullish impulse leg forming, but engineered sweeps at premium supply are likely before continuation. The defined FVG buy zone around 3840–3842 marks discount territory for potential re-entry if price retraces deeper.
From the macro side, gold is consolidating as traders brace for this week’s U.S. CPI data and renewed Treasury yield volatility. The dollar’s firm tone and cautious risk sentiment following stronger U.S. job figures are keeping gold capped near short-term supply. Still, geopolitical tensions and central-bank demand continue to provide underlying support, reinforcing the buy-on-dip narrative toward year-end.
________________________________________
📌 Key Structure & Liquidity Zones (1H):
• 🔴 SELL GOLD 3960–3958 (SL 3967): Premium liquidity sweep zone targeting retracement toward 3940 → 3900.
• 🟢 BUY ZONE 3840–3842 (SL 3833): Discount demand and FVG mitigation aligned with higher-timeframe support. Upside targets 3860 → 3880 → 3900+.
________________________________________
📊 Trading Ideas (Scenario-Based):
🔻 Sell Setup – Liquidity Sweep at 3960–3958
• Entry: 3960–3958
• Stop Loss: 3967
• Take Profits:
• TP1: 3940
• TP2: 3920
• TP3: 3900
🔺 Buy Setup – FVG Mitigation at 3840–3842
• Entry: 3840–3842
• Stop Loss: 3833
• Take Profits:
• TP1: 3860
• TP2: 3880
• TP3: 3900+
________________________________________
🔑 Strategy Note
Gold remains liquidity-driven within a mid-range structure. Expect engineered sweeps into 3960–3958 before deeper pullbacks into discount demand near 3840–3842. Tactical bias favors fading rallies at premium while preparing to join the continuation move from discount FVG support if CPI-related volatility clears the liquidity pools.
Commodities
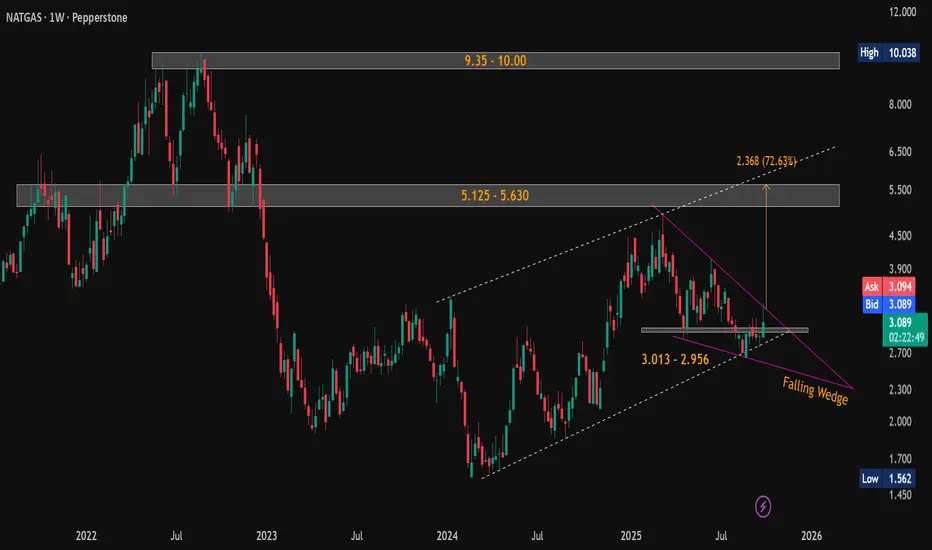
Natural Gas (NG) Weekly Breakout Brewing — 80% Upside Potential!Current Price: $3.090
Technical View (Weekly Timeframe):
Natural Gas has formed a classic falling wedge pattern on the weekly chart - a strong bullish reversal setup. Price action is currently on the verge of breakout , with increasing volume and narrowing range suggesting imminent movement.
🟢 Strong Support Zones:
$3.013 – $2.956
$2.692 – $2.643
🔺 Key Resistance / Upside Targets:
Short-term: $5.125 – $5.630 (Pattern target: $5.625 )
Long-term: $9.35 – $10.00
📈 The pattern breakout target of $5.625 aligns closely with the major resistance zone of $5.125 – $5.630, representing a potential ~80% upside from current levels.
Look for confirmed breakout above the wedge resistance with strong volume for trend continuation.
#NaturalGas | #NG | #FallingWedge | #ChartPatterns | #TechnicalAnalysis | #PriceAction
📌 Disclaimer: This analysis is shared for educational purposes only. It is not a buy/sell recommendation. Please do your own research before making any trading decisions.
Gold Holds Above 3850 But Faces Resistance at 3890–95 ZoneAfter printing a rejection candle on Wednesday, gold followed up with further weakness yesterday, but once again bulls managed to defend and push the price back above 3850, securing a daily close above this level. This makes 3850 the immediate support to watch, and only a confirmed H4 close below it could open the door for a deeper test of the 3810–3800 zone, which remains the next key support area. The current price action suggests that the much-expected pullback is underway, though it looks more like a healthy cooldown rather than a reversal, as the broader structure remains bullish. On the upside, the 3890–3895 zone is acting as immediate resistance and will be the key hurdle for bulls in the short term.

Silver at a major resistanceSilver has reached a major resistance level. A breakout above this will see more rally. It will be very interesting to see what happens from here. Big Macro development if a breakout happens. The metal will continue to shine if it breaks out, otherwise it is a top and correction will follow.

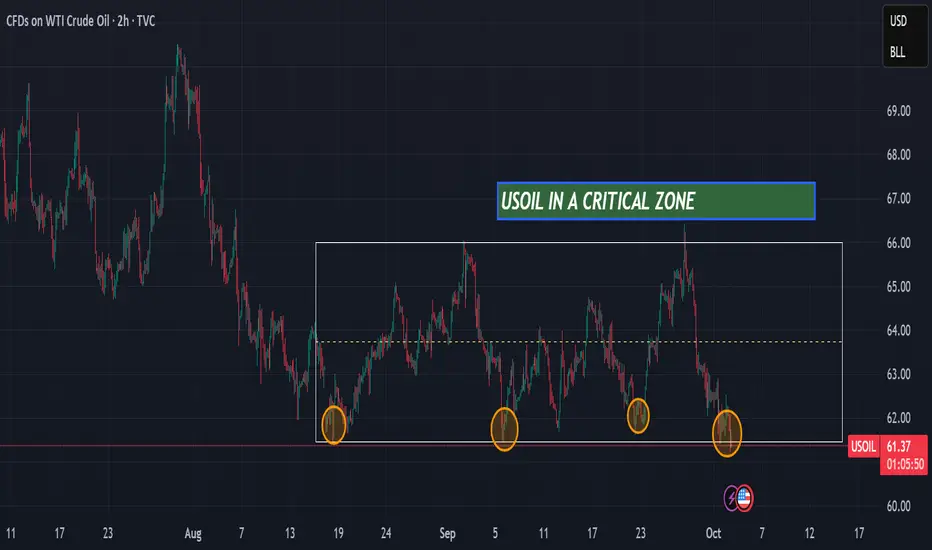
USOIL is in a critical zoneHello,
USOIL is currently at a major support level that has held for the past 2 months. There are two possible scenarios: either the support holds and USOIL bounces back toward the resistance at $66, or the support breaks and the price moves down to the next level at $60,
Ibrouri Abdessamad
Gold 1H – Will Liquidity Above 3903 Fuel Reversal?Gold on the 1H timeframe is consolidating near 3,872 after multiple ChoCHs, with the next liquidity cluster resting above 3903–3901. Market structure shows engineered liquidity sweeps possible at premium supply, aligning with short-term sell opportunities. On the downside, a defined FVG buy zone and discount demand around 3832–3834 provide scope for continuation if tapped.
From the macro side, traders remain cautious ahead of upcoming U.S. economic data, while a resilient dollar and persistent geopolitical risks in energy markets continue to shape volatility. This backdrop supports tactical plays: fading rallies into premium supply while preparing to join the move from discount demand zones.
________________________________________
📌 Key Structure & Liquidity Zones (1H):
• 🔴 SELL GOLD 3903–3901 (SL 3910): Premium liquidity sweep zone. Downside targets at 3880 → 3860 → 3845.
• 🟢 BUY ZONE SUPPORT 3832–3834 (SL 3825): Discount demand aligned with FVG mitigation. Upside targets at 3855 → 3875 → 3890+.
________________________________________
📊 Trading Ideas (Scenario-Based):
🔻 Sell Setup – Liquidity Sweep at 3903–3901
• Entry: 3903–3901
• Stop Loss: 3910
• Take Profits:
• TP1: 3880
• TP2: 3860
• TP3: 3845
🔺 Buy Setup – FVG Mitigation at 3832–3834
• Entry: 3832–3834
• Stop Loss: 3825
• Take Profits:
• TP1: 3855
• TP2: 3875
• TP3: 3890+
________________________________________
🔑 Strategy Note
Gold remains range-bound but liquidity-driven. Expect engineered sweeps above 3903 before deeper corrections, while discounted dips into 3832–3834 offer potential continuation setups. Flexibility is key: fade rallies at premium, but scale into buys if liquidity clears into discount demand.

XAUUSD – Maintaining the Core Uptrend (BUY Bias)
Hello traders,
On the H4 timeframe, gold continues to show a steady upward trend. After testing the upper trendline, price bounced back and is now consolidating around the 386x region. This suggests the market may be in an accumulation phase, awaiting major news.
Fundamental Context
Tomorrow, the market will look towards the release of the Nonfarm Payrolls (NFP) data, an event that often brings strong volatility to gold prices.
In addition, concerns around the potential US Government shutdown are adding to the macro uncertainty, further supporting gold’s safe-haven appeal.
At present, there is little evidence to suggest gold will decline, particularly when other markets are also breaking higher.
Technical Analysis
Price continues to trade within the ascending channel on H4, with buyers holding the advantage.
MACD remains above the zero line, showing no clear signs of weakness.
Price is likely to consolidate further in the 3860 – 3870 range before a sharp move triggered by news.
Trading Plan
Buy Setup (preferred – trend following)
Entry: 3829 – 3832
SL: 3825
TP: 3845 – 3862 – 3877 – 3890
Sell Scalping (counter-trend, higher risk)
Entry: 3927 – 3930
SL: 3934
TP: 3915 – 3900 – 3882 – 3865
Note: Sell setups should be treated only as short-term scalps, as the primary bias remains on the buy side.
Conclusion
Gold is holding firmly within the uptrend structure, with no significant weakness yet. Given the backdrop of political uncertainty and the upcoming NFP release, the priority remains buying at suitable support zones. Any sell trades should be viewed as quick reactions rather than core positions.
👉 Follow me to get the latest updates as soon as price structure changes.

Gold Market Analysis – Sell Opportunity Emerging in XAU/USDGold has been climbing with strong momentum, but the current leg is showing signs of transition. After a period of consolidation, the market expanded upward, taking liquidity from previous highs and creating an extended run. This behavior often reflects the final stage of a bullish cycle before rebalancing begins.
What stands out now is the engineered path of price: a push into untested liquidity zones above, followed by a potential shift as large players unwind positions. Once liquidity is collected at the extremes, price tends to rotate back into inefficiencies left behind during the rapid climb.
This suggests gold is not simply trending higher, but moving through a liquidity cycle. The near-term structure favors a sweep of higher levels, then a corrective phase where price retraces to refill imbalances and reset order flow for the next directional move.

Will crude drop to $61.70?hello,
according to my analysis on 2h time frame there is high probability that crude oil futures could drop to 61.7 IN FEW HOURS,

Gold |Power of Neowave AnalysisIf you have any doubts related to your stocks and portfolio, ask in the comments we will provide you Neowave Chart for that.
To understand my view Kindly watch the videos-
Video Analysis 01/10/2025
Video Analysis 30/09/2025
Video Analysis 29/09/2025
Gold 1H – Correction or Continuation After Supply Test?Gold on the 1H timeframe is trading near 3,861 after consolidating below a premium supply zone at 3876–3874. Structure shows a recent BOS to the upside, but current rejection signals potential engineered liquidity sweeps into the nearby FVG and discount demand zones. The first support rests at 3796–3798, aligning with discount territory and previous accumulation, offering scope for continuation if price reacts positively.
From the macro side, today’s headlines point to persistent U.S. dollar strength as traders await fresh Federal Reserve guidance on inflation and rate path. Meanwhile, heightened geopolitical concerns in energy markets are maintaining safe-haven flows, adding volatility to gold’s intraday swings.
This dual backdrop sets up a tactical approach: fading rejections at supply while being prepared to enter on discounted dips at demand.
________________________________________
📌 Key Structure & Liquidity Zones (1H):
• 🔴 SELL GOLD 3876–3874 (SL 3883): Premium supply zone, downside targets at 3850 → 3835 → 3815.
• 🟢 BUY ZONE SUPPORT 3796–3798 (SL 3790): Discount demand zone aligned with BOS, upside targets at 3820 → 3845 → 3860+.
________________________________________
📊 Trading Ideas (Scenario-Based):
🔻 Sell Setup – Supply Rejection (3876–3874)
• Entry: 3876–3874
• Stop Loss: 3883
• Take Profits:
TP1: 3850
TP2: 3835
TP3: 3815
🔺 Buy Setup – Demand Mitigation (3796–3798)
• Entry: 3796–3798
• Stop Loss: 3790
• Take Profits:
TP1: 3820
TP2: 3845
TP3: 3860+
________________________________________
🔑 Strategy Note
Gold remains in a corrective phase after testing supply. Expect liquidity sweeps into discount levels before continuation. With the dollar strengthening and Fed commentary in focus, intraday traders should:
• Fade supply rejections at 3876–3874.
• Scale into buys around 3796–3798 if liquidity is cleared.

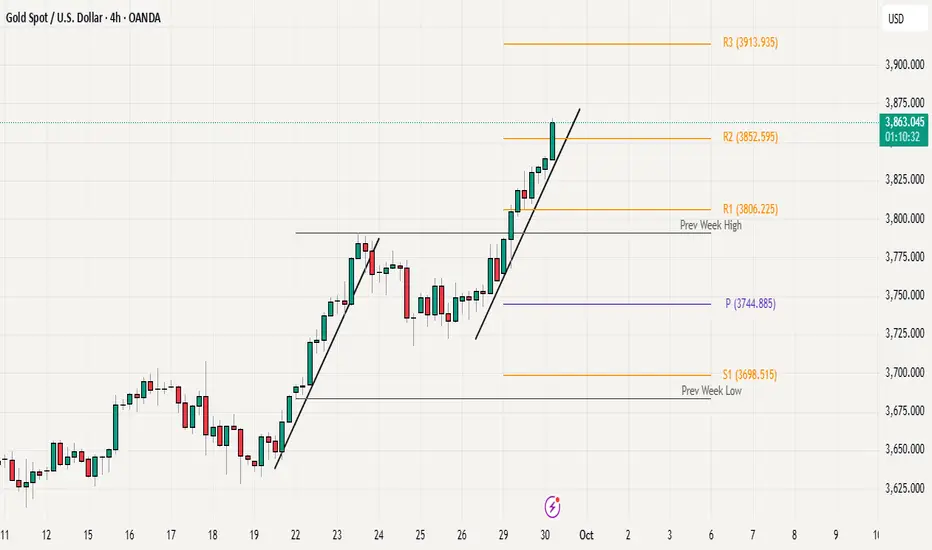
Gold Sets Record Close, Will Bulls Push Toward 3900 Next?Gold printed another all time high yesterday and closed with the strongest daily, monthly, and quarterly close on record. As expected with month-end and EOQ flows, we saw a phase of profit booking, but price quickly found support around the psychological 3800 level and Weekly R1 (3806), which is holding as a key demand zone for now. The overall structure remains bullish, and today gold is attempting to break above the previous day high / previous month high. A confirmed H4 close above this level would likely fuel continuation toward the next psychological milestone at 3900. On the downside, a breakdown below 3800 could open room for a corrective move into lower supports. For the near term, the market is trading within a range of 3810–3865/70, and a decisive breakout from this band will likely define the next directional leg.

LiamTrading – Gold continues to be “crazy”LiamTrading – Gold continues to be “crazy”: Strong trend, but awaiting reaction at 3900
Gold has just recorded its 39th all-time high in 2025, now approaching the 3,900 USD/oz mark. This is not only a significant psychological threshold but also coincides with extended Fibonacci levels, making this area a sensitive point in the market.
Trend & Trendline
On the H4 chart, gold remains firmly within the upward channel formed since early September. The price continuously bounces off the lower trendline and expands its range towards the upper boundary.
The lower trendline around 3760–3780 acts as a dynamic support. If the price breaks below this area, a deeper correction scenario towards 3720–3730 will be triggered.
The upper trendline is currently “pressing” the price right at the 3897–3900 area, confluencing with the 2.618 Fibonacci. This is a strong resistance, potentially causing profit-taking reactions and creating a technical pullback.
Volume Profile & Liquidity
The 3800 and 3720 areas are dense volume clusters, indicating significant capital is positioned here. These are also potential Buy zones when the price corrects.
The 3640–3650 area is a larger liquidity cluster, but will only be activated if a strong breakdown occurs from the current trendline.
Reference Trading Scenarios
Sell zone: 3897 – 3900, SL 3905, TP 3885 – 3862 – 3850 – 3833
Short-term Buy zone: 3797 – 3800, SL 3793, TP 3822 – 3840 – 3855 – 3872 – 3890
Medium-term Buy: 3720 – 3730, SL 3710, TP 3760 – 3800 – 3850
Conclusion
The upward trend remains very strong, but the 3897–3900 area will be a crucial challenge. If the price is rejected here, we might witness a correction back to the lower trendline before gold continues towards the larger target of 4000 USD.
This is my personal view on XAUUSD. Please manage risks carefully and stay updated with the latest scenarios.

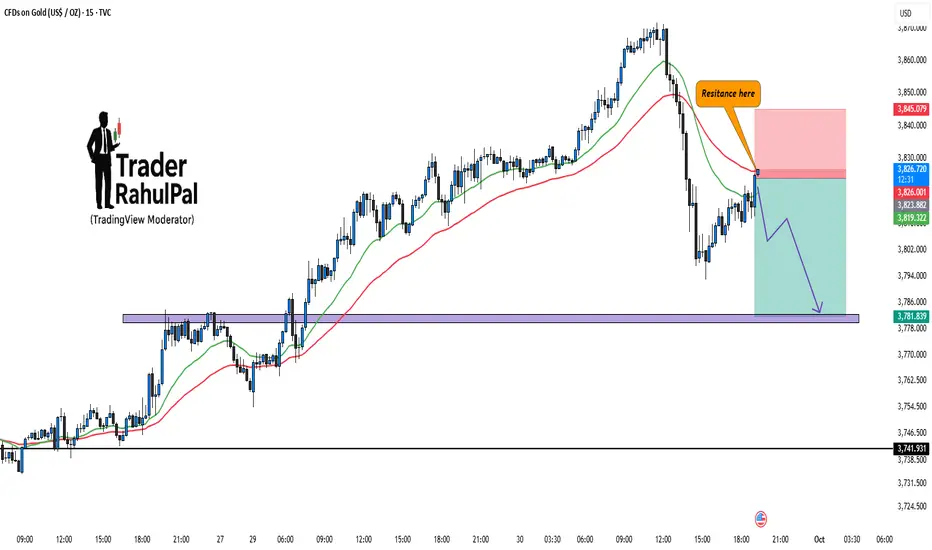
Gold – Resistance at 3840, Contra Move in Play?Gold has approached the 3825 and at high around 3840 resistance zone where sellers are likely to step in. Price rejection from this area can trigger a downside move toward the 3775–3780 support zone.
Currently, the setup favors a contra play, with risk defined above the resistance zone and reward potential aligning with the lower support.
Disclaimer: This analysis is for educational purposes only and should not be considered financial advice. Please do your own research or consult your financial advisor before trading.
Gold Strength Persists: Trendline Support Key Into EOQ ClosingGold continues to show impressive strength, holding its bullish momentum without any major signs of rejection from higher levels. Price action is moving with a steady pace, consistently finding support on the rising trendline, which remains a key technical guide for intraday moves. The immediate horizontal support is now seen around 3850, and as long as price holds above both the trendline and this level, bulls are expected to remain firmly in control.
For bears to gain traction, they would need to drag price under the trendline and 3850 on a closing basis(H4 or Higher), which could open the door for a pullback. Until then, momentum clearly favors the upside. note that today marks month-end and quarter-end closing (EOQ), which may bring additional volatility and sharp intraday swings.
Overall, the bias remains bullish above 3850, with the trendline acting as dynamic support and a key zone to watch heading into the new month.
Neowave Forecast| Gold|Bitcoin|Nifty|Bank Nifty|30/09/2025If you have any doubts related to your stocks and portfolio, ask in the comments we will provide you Neowave Chart for that.
Discussed Instruments
#Gold
#Bitcoin
#Nifty
#Bank Nifty
Yesterday Video-

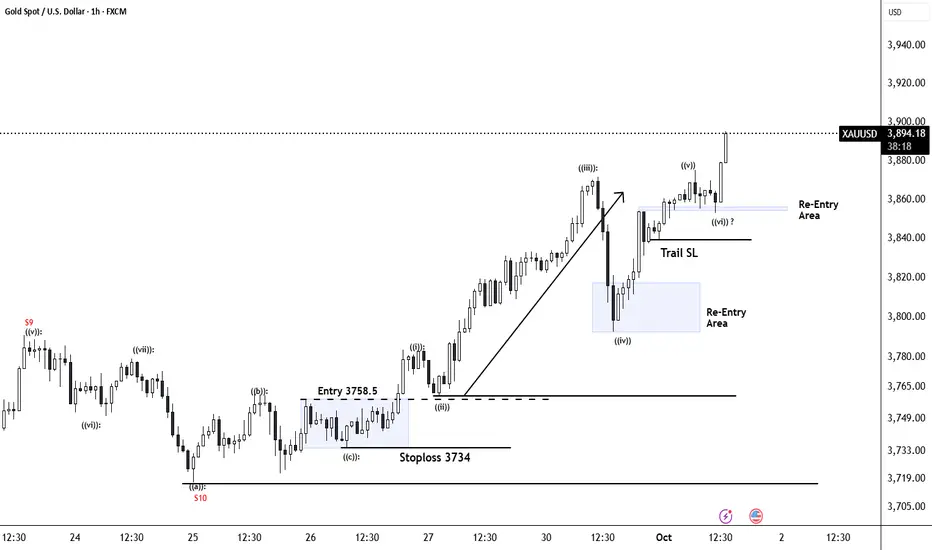
Gold 1H – Will the Breakout from Range Sustain?Gold on the 1H timeframe has broken out of its previous consolidation range and is now testing a premium supply zone near 3828–3826. The structure shows a clear BOS after the range, supported by strong bullish momentum. However, engineered liquidity sweeps remain likely before the market establishes sustained direction.
From the macro side, today’s headlines highlight persistent inflation worries and a stronger U.S. dollar as traders anticipate upcoming remarks from Federal Reserve officials. Geopolitical tensions in energy markets have also underpinned safe-haven flows, adding volatility to gold price action.
This alignment of macro drivers and technical liquidity pools suggests two tactical scenarios: fading rejections at supply while preparing to buy dips into the defined demand zone.
________________________________________
📌 Key Structure & Liquidity Zones (1H):
• 🔴 SELL GOLD 3828–3826 (SL 3835): Premium supply zone with upside liquidity sweep potential, offering downside targets at 3810 → 3790 → 3775.
• 🟢 BUY GOLD 3757–3759 (SL 3750, Demand Zone): Discount demand area aligned with BOS, with upside targets at 3765 → 3780 → 3795+.
________________________________________
📊 Trading Ideas (Scenario-Based):
🔻 Sell Setup – Supply Rejection (3828–3826)
• Entry: 3828–3826
• Stop Loss: 3835
• Take Profits:
TP1: 3810
TP2: 3790
TP3: 3775
🔺 Buy Setup – Demand Mitigation (3757–3759)
• Entry: 3757–3759
• Stop Loss: 3750
• Take Profits:
TP1: 3765
TP2: 3780
TP3: 3795+
________________________________________
🔑 Strategy Note
Gold remains volatile after breaking out of consolidation. Expect engineered sweeps into both supply and demand zones before directional clarity develops. With macro headlines keeping the dollar firm and inflation risks alive, traders should watch for sharp intraday reversals:
• Fade supply rejections if momentum stalls at 3828–3826.
• Buy dips into demand if liquidity is swept cleanly around 3757–3759.
The broader narrative supports a two-sided strategy until the Fed provides clearer guidance.

silver soon topssilver could top soon , it had made the top and fallen , so could the history repeat ? we could see gold and silver prices falling soon because nothing could go so up forever

Gold Price Analysis: Liquidity Redistribution in PlayThe current correction phase is unfolding as part of the broader cycle, where price is retracing into areas of liquidity to rebalance market flow. This is not necessarily weakness, but a redistribution process that allows the market to set up for its next decisive move.
Following the recent rally, price entered a period of consolidation before breaking higher again, showing that buyers remain active. The ongoing return toward previously untested zones reflects how institutional flow realigns, creating space for renewed expansion.
If bullish intent continues, gold could extend toward higher levels after short pauses, with volatility remaining a key factor. The structure highlights that retracements are being used as preparation for continuation rather than reversal.

Gold Forecast: Liquidity Rotation Shaping Price ActionGold Forecast: Liquidity Rotation Shaping Price Action
Gold’s recent movement reflects shifting dynamics between liquidity capture and market rebalancing. The push above 3,800 was less about sustained trend extension and more about triggering stops and gathering liquidity before rotating lower. This type of move often indicates that large participants are managing positioning rather than chasing new highs.
The current correction phase is part of that process. Price is being driven back into zones where imbalances remain, allowing institutional flow to realign. Instead of showing weakness, this return highlights how markets redistribute liquidity to prepare for the next decisive move.
From a flow perspective, gold remains in an accumulation phase. Consolidation pockets reveal ongoing positioning, while the corrective dip reflects controlled market engineering rather than disorder. If this cycle continues, the next stage could see energy released in the form of a renewed expansion leg once sufficient liquidity has been absorbed.
In essence, gold is navigating a liquidity-driven cycle: sweep → redistribute → prepare → expand. The underlying order flow still favors upward continuation once the current rebalancing phase completes.

Double Top in SilverEntry- 143000-143200
Target- 142000, 141500, 141200
SL- Day high
Pattern - Double Top has been made in MCX silver and Comex silver in 1 hr and 15 min time frame.
Disclaimer- This is just for educational purpose.
Jai Shree Ram.

Gold Hits Fresh ATH fresh Support at 3790, Bulls Eye 3806 & 3850Gold printed a fresh all time high today and, so far, there are no signs of rejection on higher timeframes. The immediate level to watch on the downside is last week’s high near 3790, which now acts as key support. As long as price holds above this level on a 4H or higher close, bulls remain in control and may attempt a move toward the next resistance zone at 3800–3806, which is aligned with the weekly R1 and psychological round number resistance. A sustained breakout above this zone could open the door for a push toward 3850 (weekly R2). On the flip side, if sellers manage to drag price back below 3790 on a closing basis, we could see a deeper pullback before the next leg higher.

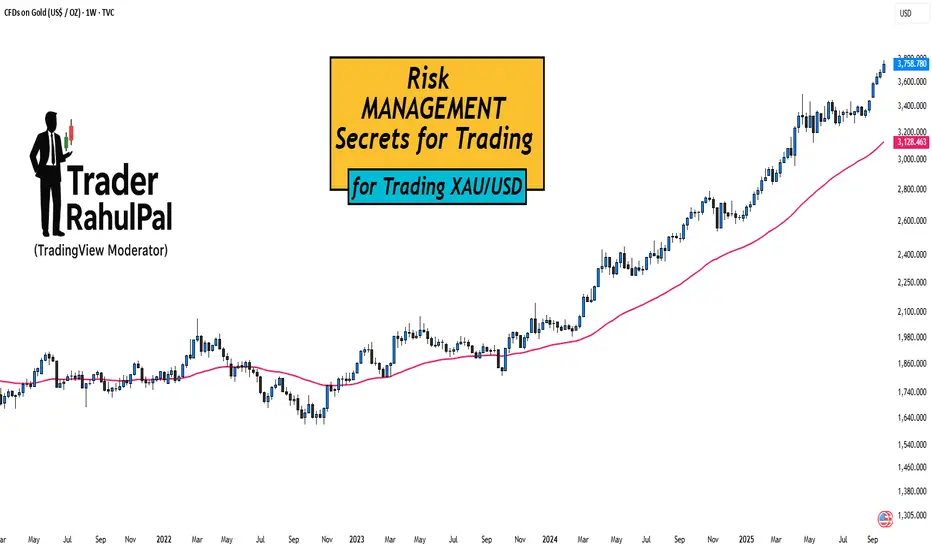
Risk Management Secrets for Trading XAU/USD!Hello Traders!
Gold (XAU/USD) is one of the most rewarding instruments, but also one of the most dangerous if you don’t manage risk properly.
Many traders lose not because their strategy is bad, but because they fail to protect their capital.
Here are some key risk management secrets every gold trader must know.
1. Position Sizing is Everything
Gold moves fast, a $5 move can wipe out accounts if the lot size is too big.
Always calculate position size based on risk per trade (ideally 1–2% of your account).
This way, even if you hit multiple stop losses, your account survives.
2. Wider Stops, Smaller Lots
Gold often spikes and hunts tight stop losses.
Use slightly wider stops, but reduce lot size to balance the risk.
This gives your trade room to breathe without increasing overall risk.
3. Never Trade News Without a Plan
During events like NFP, CPI, or Fed speeches, XAU/USD becomes extremely volatile.
If you’re not experienced, it’s better to stay out.
If you do trade, cut position size and expect slippage.
4. Daily Loss Limit
Decide in advance how much you can lose in one day (for example, 3% of account).
If that limit is hit, stop trading for the day.
This prevents emotional revenge trading, which is the biggest killer in gold trading.
5. Use Partial Profits
Gold reverses quickly, so book partial profits when the trade moves in your favor.
This locks in gains and reduces pressure.
Move stop loss to break-even once part profits are secured.
Rahul’s Tip:
Your job as a trader is not to catch every move, but to stay in the game .
Risk management may feel boring, but it’s the only reason why professional traders survive while retail traders blow up.
Conclusion:
In XAU/USD trading, strategy decides entries, but risk management decides survival.
By controlling lot size, stops, and emotions, you can make gold work for you instead of against you.
If this post helped you see risk management in a new light, like it, drop your thoughts in comments, and follow for more trading wisdom!