Gold (XAUUSD) Going Parabolic ?The chart suggests that Gold (XAUUSD) has been rising steadily in the past year.
Gold in general acts as hedge against inflation and uncertainty.
There can be further upthrust due to some catalyst. In general one should not short a parabolic move prematurely as it can keep moving upwards. Only with defined signals one must try that. Shorting in general is very difficult. Nevertheless if one wants to trade a parabolic move, they can long it with a small position so that the risk reward is great. Commit only that much which you are ready to lose with appropriate stop loss.
What effects the price of Gold in general -
1. Geopolitical events - e.g.
Ukraine War
Gaza War
Tariff Wars
2. Dollar Index - Post election DXY rose steadily causing selloff in emerging markets. Though Gold fell initially but it steadied and started moving upwards later. Since gold correlates negatively in general with DXY, it's important to keep a tab on it.
3. Demand and supply of physical gold.
Buying and selling by Central Banks around the world
Mining output
Demand by consumers
4. Monetary policies of Central Banks of USA, China, Japan etc
5. Trading in derivatives
PS - This is not an exhaustive list of course.
So in order to understand and speculate on Gold one must have an updated macro view and chart reading capacity.
Trade Safe
Commodities

Gold short-term analysisTechnically, the daily gold line continues to maintain its strength, setting a new record high. The daily chart maintains a bullish trend structure, and the price continues to run in the trend. At present, the MA10/7-day moving average continues to open and move up to 2977/3007, and the price runs along the upper track of the Bollinger Band. The RSI indicator stands above the 70 value and is close to the 80 value.
The short-term four-hour chart also keeps the price running on the upper track of the Bollinger Band, the moving average opens upward, and the price continues the MA10-day moving average and stops moving up to set a new record high. However, it should be noted that the RSI indicator has reached the 80 value, and there will be profit-taking today and tomorrow. The trading idea of gold today is still mainly to buy at low positions, and sell according to market conditions after the historical high.
Key points:
First support: 3044, second support: 3038, third support: 3023
First resistance: 3057, second resistance: 3068, third resistance: 3078
Operation ideas:
Buy: 3043-3046, SL: 3032, TP: 3060-3070;
Sell: 3073-3075, SL: 3084, TP: 3060-3050;

GOLD (XAU/USD) Trading Plan: Will Gold Break $3100? 🚀Published by MMFlowTrading on March 20, 2025
Overview 📊
Gold (XAU/USD) is in a strong uptrend on the H1 timeframe, with price action moving within a clear ascending channel 📈. The recent breakout above the $3000 psychological level signals robust bullish momentum 💪. However, key resistance levels are approaching, and upcoming economic events might influence the next move. Let’s dive into the technical and fundamental factors to craft today’s trading plan! 🧠
Technical Analysis 🔍
Ascending Channel:
Gold is trading within a well-defined ascending channel (highlighted in orange on the chart) 📉📈. The price has respected both the upper and lower boundaries, indicating a healthy uptrend. Currently, the price is near the upper channel resistance at $3070.612 🚧.
Key Resistance Levels (VPOC High):
The nearest resistance is at $3070.612, a high-volume node (VPOC) where sellers might step in 🛑.
If this level is broken, the next targets are $3081.053 and $3097.774, with a potential push toward the psychological $3100 mark 🎯.
Key Support Levels:
The closest support is at $3031.774, aligning with the lower channel boundary and a previous VPOC level 🛡.
A deeper pullback could test $3024.254 or even $3017.197, where buyers previously stepped in (marked by yellow circles on the chart) 📍.
Additional Key Levels:
Resistance: $3054 - $3061 - $3070 🚧
Support: $3044 - $3038 - $3031 - $3026 🛡
Fundamental Analysis 🌍
US Dollar Strength:
Gold has an inverse relationship with the USD 💱. On March 20, 2025, the market is awaiting the US Jobless Claims data and Fed speeches, which could impact the USD 📅. If the data indicates a weaker US economy, the USD might weaken, supporting Gold’s rally toward $3100 🚀.
Geopolitical Tensions:
Ongoing global uncertainties (e.g., Middle East tensions, US-China trade talks) continue to drive demand for safe-haven assets like Gold 🛡. This fundamental factor supports the bullish bias in the short term.
Interest Rates:
The Fed’s recent dovish stance on interest rates (as of early 2025) has reduced the opportunity cost of holding Gold, further fueling its uptrend 📉.
Trading Plan 📝
Buy Setup (BUY ZONE: $3032 - $3030) 🟢
Stop Loss (SL): $3026 ⛔️.
Take Profit (TP): $3038 - $3042 - $3046 - $3050 - $3060
Sell Setup (SELL ZONE: $3069 - $3071) 🔴
⛔️Stop Loss (SL): $3075
Take Profit (TP): $3065 - $3060 - $3055 - $3050
Market Note ⚠️
The market has been hitting all-time highs (ATH) after the FOMC storm early this morning 🌪. Traders, please stay cautious and strictly follow your TP/SL to keep your accounts safe! 🛡💡
Conclusion 🏁
Gold is at a critical juncture near $3070. A breakout above this level could pave the way to $3100, driven by strong technicals and supportive fundamentals 🚀. Alternatively, a rejection might lead to a pullback to the $3032 - $3030 buy zone. Stay disciplined and trade smart! 💪
What do you think about this setup? Drop your thoughts in the comments below! 👇 For more daily trading ideas, follow me on TradingView

Gold Price Action Analysis - March 20, 2025Gold Price Action Analysis - March 20, 2025
Current Market Status
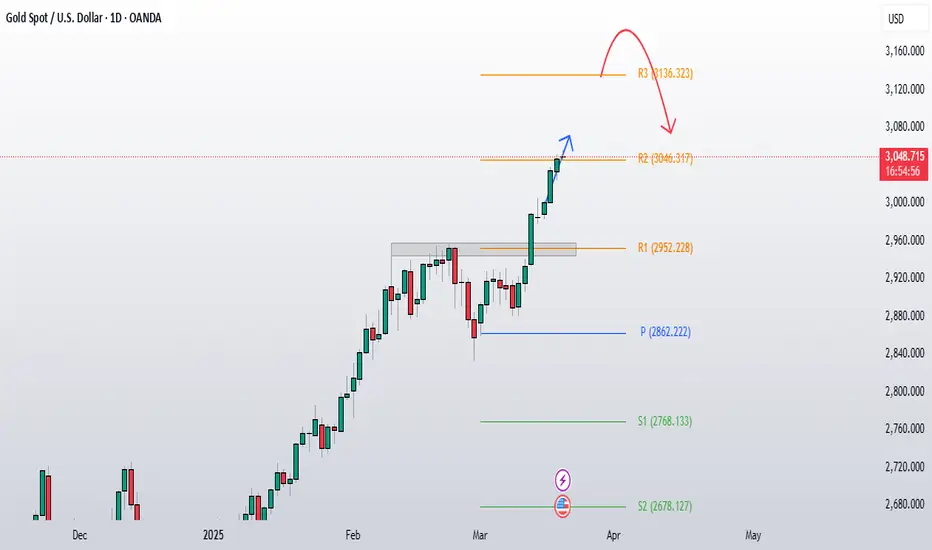
- Gold is currently trading at 3,050.055,
- Successfully conquered the R2 resistance level (3,046.317)
- Showing strong momentum with minimal retracement or consolidation
- Psychological level of 3,000 has been comfortably established as support
Technical Observations
- The price is following almost exactly the projected path that I shared on Monday (blue arrow)
- Minimal upper wicks on recent candles indicate buyers are maintaining control
- Volume appears to be supporting the move higher
- No divergence signals on the daily timeframe indicating weakness
Updated Projections
Primary Scenario (Continued Bullish Momentum)
- Having broken through R2 (3,046.317), gold is now likely to target R3 at 3,100
- The absence of significant profit-taking suggests potential for further upside
- Watch for a potential acceleration if momentum continues to build
Secondary Scenario (Short-term Consolidation)
- After such a strong move, an intraday pullback or consolidation may occur
- Potential consolidation range: 3,030-3,060
- This would be a healthy pause before the next leg up
- The overall bullish structure remains intact as long as price stays above 3,000
Key Levels to Monitor
- Immediate resistance: 3050-55 and 3100, then 3,136.323 (R3)
- Current support: 3,046.317 (previous R2, now potential support)
- Secondary support: 3,000 (psychological level)
- Critical support: 2,952.228 (R1)
Trade Considerations
- Overall outlook is still bullish while being cautious of potential short-term overbought conditions
- Consider partial profit-taking at 3100 0r R3 (3,136.323) if reached
- Potential dips toward 3,030-3,040 range could offer strategic entry points for traders looking to add to positions for Intra day on confirmations
Gold continues to demonstrate exceptional strength with no technical signs of weakness on higher timeframes. While an intraday pullback is possible, the primary trend remains firmly bullish.
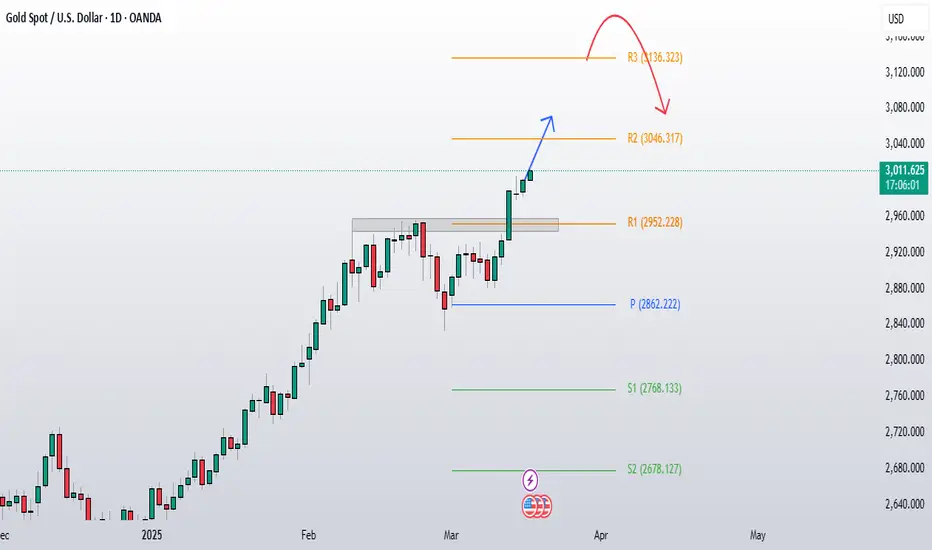
Gold Price Analysis Update - March 18, 2025Gold continues to demonstrate exceptional bullish momentum, validating yesterday's primary scenario prediction shared here. Currently trading at 3,010.965, gold has surged past the R1 target of 2,952.228 as forecasted and is now approaching the R2 resistance level at 3,046.317.
Current Market Conditions
-Successfully sustaining on the 3,000 psychological barrier
- Trading well above the previous all-time high (2,956.73), which is now serving as strong support
- The chart shows minimal retracement following the breakout, indicating robust buying pressure
Updated Projections
1. Primary Scenario (Continued Bullish Momentum): Gold is likely to test the R2 resistance at 3,046.317 in the near term. With current momentum, a push toward R3 at 3,136.323 remains a strong possibility.
2. Secondary Scenario (Minor Consolidation): We may see brief consolidation around current levels before the next leg up. However, as long as price remains above 2,952 (R1), the bullish outlook remains intact.
Key Levels to Monitor
- Immediate resistance: 3,046.317 (R2)
- Extended target: 3,136.323 (R3)
- Support levels:$2,952.228 (R1, previous resistance now support)
Market Sentiment
The strong daily close with minimal upper wicks indicates buyers remain in control with no significant profit-taking yet. The overall trend structure remains intact with higher highs and higher lows, confirming the bullish bias.
Gold's performance likely continues to be supported by geopolitical tensions, inflation concerns, and potential monetary policy adjustments. With no technical weakness apparent on the daily timeframe, maintain bullish outllok overall.
Gold Surges Unstoppably, Hits $3,036 – What’s Next?Gold is skyrocketing without brakes, reaching $3,036, making traders as happy as a holiday, while those waiting to buy the dip... can only watch the price soar sadly. 😅
📌 The main reason?
The USD is as weak as a soggy cracker, giving gold a perfect chance to break out.
Safe-haven sentiment keeps pushing gold higher, and even traders who bought at the top still seem happy as prices show no sign of stopping!
📈 Forecast:
If gold holds above $3,020, there's a high chance it will set a new record.
And if it corrects? Just gathering momentum for another big jump!
💡 What about you? Are you already in position or still waiting and watching?

XAU/USD 1H – Bullish Continuation from Demand Zone?📊 XAU/USD (Gold) 1H Analysis – Bullish Continuation Setup
🔹 Market Structure: Gold has been in a strong uptrend, with price currently consolidating near a key demand zone.
🔹 Key Levels:
🔴 Resistance: $3,050 - $3,060 (Potential target)
🟣 Demand Zone: $3,030 - $3,035 (Support area)
🟠 Deeper Support: $3,025 (Break below weakens bullish bias)
📈 Potential Trade Setup:
1️⃣ A possible pullback into the demand zone could attract buyers.
2️⃣ Price may wick below liquidity before reversing.
3️⃣ If support holds, we anticipate a move toward $3,050+.
✅ Entry Zone: $3,030 - $3,035
🎯 Target: $3,050 - $3,060
🚨 Stop Loss: Below $3,025
⚠️ Watch for price action confirmation before entering. A strong bullish candle from support could signal entry. Let the market show its hand! 🚀✨

US Dollar Index (DXY) – Pre-FOMC Update💥 US Dollar Index (DXY) – Pre-FOMC Update: Expert Analysis and Trading Strategies 💥
In just a few hours, the Federal Reserve (Fed) will announce its interest rate decision and update its economic projections in the Summary of Economic Projections (SEP). This is a highly anticipated event that will shape trading decisions in the coming weeks. The US Dollar Index (DXY) is currently fluctuating within the 103.00 - 104.00 range, reflecting investor caution ahead of the critical updates.
1. Interest Rate Decision and Its Impact on DXY
The policy rate is expected to remain unchanged at 4.25% - 4.50%. However, the market is more focused on signals about future rate cuts, particularly in 2025.
Chair Jerome Powell's post-meeting speech will be the key driver. The market will closely watch for hints on monetary policy, inflation, and the US economic outlook.
If the Fed adopts a hawkish tone (indicating sustained high rates or even further hikes), the DXY could rally strongly. Conversely, a dovish signal could weaken the USD.
2. Technical Analysis of DXY
🔴 Key Support: 103.18
The DXY is currently under pressure at the 103.18 support level. A break below this level could push the index further down to 103.00 or even 102.50.
This is a crucial zone, as failure to hold here would signal continued USD weakness in the short term.
🟢 Major Resistance: 105.00 and 105.57
If the DXY rebounds from current support levels, the next challenges will be the resistance zones at 105.00 and 105.57.
The 50-day and 200-day Moving Averages (MA) on the daily chart are also key indicators to watch. A break above these MAs could reinforce the bullish trend.
📉 Short-Term Trend:
On the 4H chart, the DXY is in a downtrend, with lower highs and lower lows. However, upcoming macroeconomic factors (the rate decision and Powell’s speech) could trigger a reversal or increased volatility.
Technical indicators like the RSI and MACD are in neutral territory, suggesting the market is awaiting clearer signals.
3. Trading Strategy Before and After the FOMC Decision
🔍 Before the Fed Announcement:
Caution is key. The market may experience mild fluctuations during the wait. Traders should avoid large positions and wait for clearer signals.
Closely monitor key support and resistance levels: 103.18 (support) and 105.00 (resistance).
🔥 After the Fed Announcement:
Scenario 1: Fed Holds Rates and Signals Hawkish Tone
The DXY could rally strongly, targeting resistance levels at 105.00 and 105.57.
Strategy: Look for buy opportunities when the DXY bounces off support or breaks above resistance.
Scenario 2: Fed Signals a Dovish Tone
The DXY could drop sharply, breaking below 103.18 and heading toward 102.50.
Strategy: Look for sell opportunities when the DXY breaks support or fails to surpass resistance.
Scenario 3: Fed Holds Rates Without Clear Signals
The DXY may continue to fluctuate within the 103.00 - 104.00 range.
Strategy: Trade within the range, using identified support and resistance levels.
4. Advice for Investors and Traders
📊 Risk management: Always set appropriate stop-loss and take-profit levels to protect your capital. Post-FOMC volatility can be intense, so prepare mentally and have a solid trading plan.
📰 Stay updated: Keep a close eye on Fed updates and market reactions. Jerome Powell’s speech could create significant trading opportunities.
🛠️ Use technical tools: Combine indicators like RSI, MACD, and Fibonacci to identify precise entry points.
5. Conclusion
Tonight’s FOMC meeting will be a decisive factor for the DXY’s short-term direction. With clear support and resistance levels identified, traders should prepare their strategies to capitalize on market movements.
🚨 Stay tuned for the latest updates on TradingView to ensure you don’t miss any trading opportunities!
Wishing you successful trades and profitable outcomes! 💪💰

Kalyani Steels trendline breakout - D timeframeKalyani Steels after achieving the target of 1179.50 exited parallel channel and held support at 700 range. Bullish reversal happened at 704.20 (mar 3) and bullish reversal confirmation at 721 (mar 17). Dec 17 '24 ATH to Mar 3 '25 precisely 44.86% fall as anticipated. Now price chart in daily timeframe showing double bottom with inverted hammer (Mar 19) along with RSI double bottom breakout. Weekly chart piercing line (i think) candlestick pattern along with RSI +ve divergence.

GOLD EA MAN UPDATE >READ THE CHAPTIAN Key Observations:
Support Zone: The price has respected the marked support area and is showing bullish momentum.
EMA Confluence: The price is currently below the 30 EMA (red), but if it crosses above, it could signal stronger bullish momentum.
Target Point: The projection anticipates a move towards 3,052.357, possibly after a minor pullback.
If price sustains above the 30 EMA and breaks through the minor resistance, your bullish target seems achievable. Are you already in a long position, or waiting for further confirmation?

Short-term strategy before the Fed's interest rate decisionGold continued to rise yesterday, up more than 1%. This is the power of the trend. Don't guess whether it has reached the top. This is not in line with market logic, because there is no turning signal. The risk of guessing that it has reached the top is relatively high. Of course, the market is always relative. It is impossible to keep rising. It is necessary to prevent the risk of large adjustments!
Yesterday, the highest impact of the US market was 3038. There may be room for a short-term rise, but you must pay attention to the future. Going long is also a short-term profit exit. The daily and weekly lines are in an overbought divergence state. The price deviates far from the short-term moving average, and the risk of stepping back is getting bigger and bigger. Be bullish but not blind, and don't chase more. The short-term has risen three times, and the possibility of a pullback needs to be prevented later!
Pay attention to the news of the Fed's interest rate decision. There was not much risk in going long before this. It should be a strong form. Gold continued to set new highs in 1 hour, but it is obviously not appropriate to enter at a high level now. It is better to wait patiently for a decline and continue to buy. Gold focuses on the support near the starting point of 3015 and continues to go long. The market is changing rapidly. Since the gold bulls continue to be strong, gold will continue to trade with the trend.
Key points:
First support: 3023, second support: 3016, third support: 3002
First resistance: 3039, second resistance: 3048, third resistance: 3056
Operation ideas:
Buy: 3013-3015, SL: 3004, TP: 3035-3045;
Sell: 3048-3050, SL: 3059, TP: 3020-3010;
For more daily analysis, click on my avatar to view

Gold - Long Term Elliot Wave Counts - Top is near!Gold has finally started it's last leg up, 5th of 5th on Weekly.
This can go another 3-5% to 90600, 9100 or so, or maybe slightly higher, however, when it ends, we are looking for a sharp fall, as an extended 5th with short retracement in 4th doesn't end well.
Lot of people would be trapped, and when it starts breaking levels it will create double pressure from bears shorting and bulls covering longs.
I am expecting around 75k.

GOLD AWAITS FED DECISION – WILL $3,050 BE THE NEXT TARGET?📌 Market Outlook
Gold is holding steady above the $3,000 level as investors remain cautious ahead of the March 19 FOMC meeting. The Federal Reserve is expected to keep interest rates unchanged, with increasing speculation about a potential rate cut in June.
Despite last week’s price surge, gold’s short-term direction hinges on how the Fed’s economic outlook unfolds. If policymakers signal a dovish stance, we could see new highs beyond $3,050. However, any signs of persistent inflation may trigger a short-term pullback.
📊 Key Technical Analysis
🔹 Support Levels (Buy Zones)
$3,000 – The psychological level where buyers are active.
$2,985 - $2,975 – Strong liquidity zone, likely to provide support.
$2,945 - $2,950 – If tested, this could be a major reaccumulation area.
🔺 Resistance Levels (Breakout Targets)
$3,034 - $3,050 – Key resistance, breaking above could open the door for further upside.
Above $3,050, momentum could accelerate toward $3,080 - $3,100.
🎯 Trading Strategy for Today
🟢 BUY ZONE: 2986 - 2984
📍 SL: 2980
🎯 TP: 2990 - 2994 - 3000 - 3005 - 3010
🔴 SELL ZONE: 3033 - 3035
📍 SL: 3039
🎯 TP: 3028 - 3024 - 3020 - 3015 - 3010
⚠ Market Sentiment & Risk Management
Gold is currently trading in an ascending channel with high volatility expected before the Fed’s decision.
Traders should prepare for false breakouts and possible profit-taking moves around key levels.
Stick to strict TP/SL strategies to mitigate risks!
📢 What’s your outlook for gold? Will we break above $3,050 or see a dip first? Let’s discuss! 🚀🔥

GOLD HOLDS ABOVE $3,000 – BIG MOVE AHEAD?📌 Market Overview
Gold remains stable above the $3,000 mark as traders await the March 19 FOMC meeting. The Federal Reserve is expected to keep interest rates unchanged, but speculation about a rate cut in June 2025 continues. Amid global economic uncertainty, gold maintains its position as a safe-haven asset, benefiting from a low-interest-rate environment.
🔹 Key Fundamental Factors
1️⃣ Fed’s Economic Projections
The upcoming forecasts will provide insights into how policymakers assess Trump’s fiscal policies.
A dovish Fed stance could push gold to new highs.
2️⃣ Safe-Haven Demand for Gold
Low interest rates increase gold’s attractiveness as a non-yielding asset.
Geopolitical tensions continue to support gold’s long-term bullish outlook.
3️⃣ Interest Rate & Inflation Impact
Traders anticipate a rate cut by June, fueling gold’s rally.
However, if inflation remains strong, the Fed may delay cuts, causing short-term pullbacks in gold.
📊 Technical Analysis – Key Levels to Watch
🔺 Resistance (Upside Targets)
$3,034 - $3,050: If gold holds above $3,000, a test of this zone is likely.
Breakout Alert: A move past $3,050 could trigger stronger bullish momentum.
🔻 Support (Pullback Zones)
$3,000: A critical psychological level.
$2,985 - $2,975: A potential dip zone where buyers might step in.
$2,945 - $2,950: Strong long-term support—breaking below could indicate a shift in trend.
🎯 Trading Plan
🟢 BUY ZONE: 2986 - 2984
📍 SL: 2980
🎯 TP: 2990 - 2994 - 3000 - 3005 - 3010
🔴 SELL ZONE: 3033 - 3035
📍 SL: 3039
🎯 TP: 3028 - 3024 - 3020 - 3015 - 3010
⚠ Market Caution!
Gold is consolidating above $3,000, but volatility is expected ahead of the Fed meeting.
Watch for potential breakouts or pullbacks—stick to risk management strategies!
📢 Will gold maintain momentum above $3,000, or is a correction coming? Share your thoughts below! 🚀🔥

GOLD : From Consolidation to Continuation - 3000 In SightGold has made a decisive breakout from its recent consolidation range 2900-30 (major support is now at the green rectangle) which is now establishing itself as major support around $2,920. This area aligns with the previous week's high, creating a strong technical foundation.
Key observations:
Breakout Confirmation: Gold has not only broken above the consolidation range but also cleared the Previous Monthly High (PMH) at approximately 2,960. This level should now act as support on any pullbacks.
Strong Bullish Momentum: The recent price action shows a powerful impulse move with minimal retracement, indicating strong buying pressure and institutional interest.
Order Block Formation: The daily candles preceding the breakout have created a bullish order block that should provide support if tested.
Market Structure Shift: The higher highs and higher lows confirm a bullish market structure, with the previous resistance levels now expected to act as support.
Target Projection: Based on the breakout momentum and channel projection (shown by blue arrows), the 3,000 psychological level appears to be the immediate target, with potential for extension toward 3,050-3100 if momentum continues.

"Gold Price Analysis: Supply Zone Rejection & Potential Drop Key Technical Levels:
Supply Zone Resistance (~3,004.973): Price is currently testing this resistance area, which could lead to a potential rejection.
FVG (Fair Value Gap) Support Level (~2,949.378 - 2,945.323): This area is marked as a potential support zone where price might find buying interest.
EMA 200 Support (2,945.323): A critical dynamic support level that aligns with the FVG zone.
Indicators:
EMA 30 (Red Line - 2,990.457): Short-term trend indicator.
EMA 200 (Blue Line - 2,945.323): Long-term trend indicator.
Price Action & Prediction:
The price is in the supply zone resistance and could potentially reject downwards.
The blue projected path suggests a pullback to the FVG support zone before a possible rebound.
If price breaks below this support, further downside could be expected.
Potential Trade Idea:
Short Setup: If rejection occurs at resistance, a short trade targeting the FVG/EMA 200 support could be considered.
Long Setup: If price reaches the FVG zone and finds support, a long position targeting previous highs could be a strategy.

Is it time to flee or enter gold?This week, the market focus is on the Fed's interest rate decision and the tension in Yemen in the Middle East.
Gold prices rose to a new record high as the uncertainty of tariffs and bets on the Fed's loosening of monetary policy keep gold prices attractive. Central bank gold purchases and trade uncertainty are the main driving forces behind the rise in gold prices; investment institutions are accelerating the transfer of large quantities of physical gold bars to New York vaults to avoid possible tariffs and take advantage of the price difference between London and New York gold prices for arbitrage.
After the sharp rise, gold entered a shock consolidation, which is also a common trend in this round of upward trend. Although the decline at the end of last Friday was not very strong, the upward trend cannot be easily reversed by a single decline, and greater strength and time are needed.
Although the technical side still maintains the structural operation of the upward trend, we need to consider the historical high price of gold, and it is not easy to chase the rise at a high level. The trading idea at the beginning of the week is to wait for a pullback to buy at a low level, and then sell short-term near the previous historical high or another historical high!
Key points:
First support: 2980, second support: 2972, third support: 2963
First resistance: 3005, second resistance: 3013, third resistance: 3026
Operation ideas:
Buy: 2980-2983, SL: 2972, TP: 3000-3010;
Sell: 3005-3008, SL: 3016, TP: 2990-2980;

GOLD IN A WAIT-AND-SEE MODE – IS A BIG BREAKOUT COMING?📌 Market Overview
Gold is showing weak momentum at the start of the new trading week after a sharp decline from last week's high. This suggests that investors are still waiting for clearer signals before committing to a direction within the current price channel.
This week, market participants will closely watch the Federal Reserve’s FOMC meeting, where key decisions regarding interest rate policies will be made based on last week’s inflation reports.
Meanwhile, geopolitical tensions are rising after Trump’s recent airstrikes on Iran-backed Houthi forces. However, despite this significant event, gold has yet to show a strong bullish reaction. This raises the need for further confirmation before defining the next major trend.
📊 Key Levels to Watch
🔹 Support Levels: 2982 - 2976 - 2966 - 2948
🔹 Resistance Levels: 2994 - 3004 - 3015 - 3034
🎯 Trade Setups for Today
🟢 BUY ZONE: 2975 - 2973
📍 SL: 2970
🎯 TP: 2980 - 2984 - 2988 - 2992 - 2998
🔴 SELL ZONE: 3033 - 3035
📍 SL: 3038
🎯 TP: 3030 - 3025 - 3020 - 3016 - 3010
⚠ Caution Ahead! Possible Breakout Incoming!
Gold has been trading within a narrow range since last week, and a strong breakout is highly likely during the late Asian or early European session. Traders should be prepared for high volatility and ensure proper risk management. Stick to TP/SL levels to protect your capital!
📢 What’s your outlook on Gold this week? Will it break higher or continue its correction? Drop your thoughts below! 🚀🔥

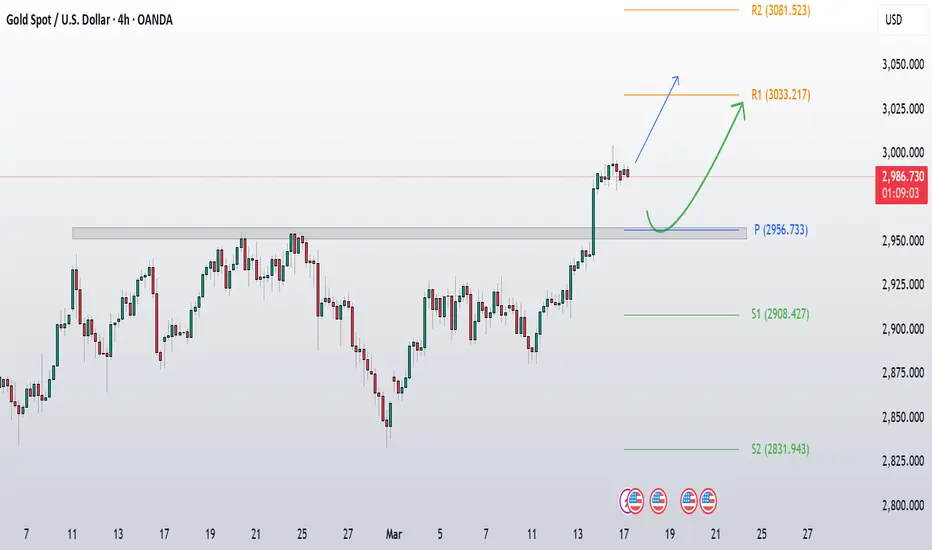
Gold : Bulls are in ControlGold is currently trading at 2,987, showing significant bullish momentum after breaking above its previous all-time high of 2,956.73 (weekly pivot level). The recent price action showing strong upward momentum with a clear breakout pattern ,Gold has successfully broken and established price action above the previous all-time high of 2,956.73, which is now acting as a support level.
Potential Scenarios:
Primary Scenario (Bullish continuation) : Expect continued momentum toward R1 (3,033) or potentially 3,050 as the recent breakout remains strong.
Secondary Scenario (Pullback then rise) : Price may retrace to test the weekly pivot at 2,956 (previous ATH) before resuming its upward trajectory.
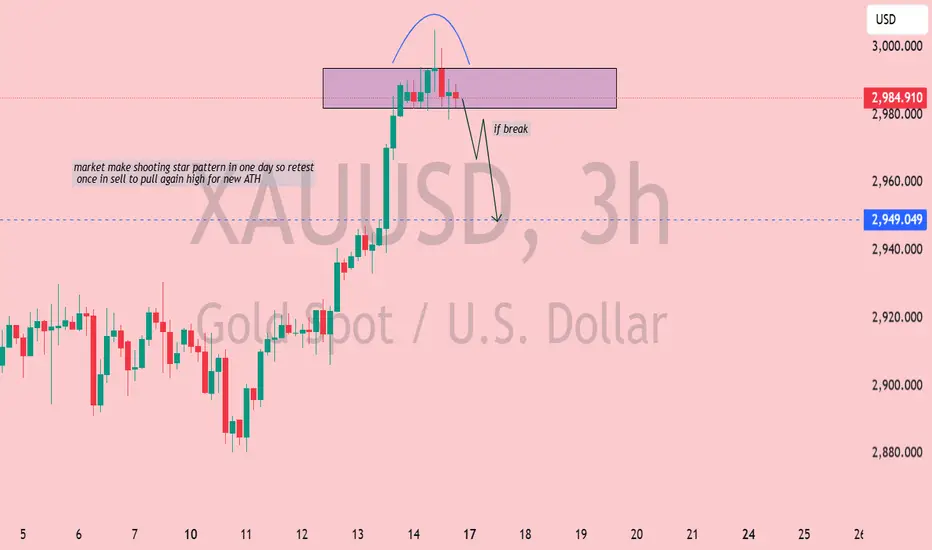
XAUUSD Analysis: Bearish Reversal with Potential for Liquidity📉 XAUUSD (Gold Spot vs USD) Analysis - 3H Chart
🌟 Shooting Star Pattern Detected: The market has formed a shooting star, a bearish reversal candlestick, signaling potential weakness at the top.
📍 Key Resistance Zone (Purple Box): Price action has been rejected from this area, showing strong selling pressure.
🔍 If Break Scenario: Should the price break below the 2,949 support zone (🔵), we can expect a bearish drop 📉 with potential liquidity grab before a pullback for a new all-time high (ATH) 🚀.
🧐 Market Sentiment: Bearish bias for now, but watch for a potential reversal after liquidity is swept.
✅ Trader's Tip: Wait for a clean break and retest before entering a short position. 🎯
Gold (XAU/USD) 30-Minute Analysis Bearish Breakdown Towards Gold (XAU/USD) 30-Minute Analysis – Bearish Setup📉
Key Observations:
1.Rising Wedge Breakdown:
- The price has been moving within an ascending channel(EA TRADE LINE).
- A potential breakdown is forming as the price approaches resistance.
EMA Levels:
-30 EMA (Red, 2,986.22: The price is hovering near this level, showing potential weakness.
-200 EMA (Blue, 2,950.00) This is the first major support level in case of a decline.
3. Bearish Projection:
- A break below current leve could trigger a sharp drop.
- The **target zone is around 2,902.73 – 2,902.41, aligning with prior support.
4. Risk Management:
Stop-loss (Red Zone): Placed above 2,990.86 to protect against invalidation.
Take-Profit (Green Zone):Set near 2,902, offering a strong risk-to-reward ratio
Conclusion:
-Bearish Bias: A drop seems likely if the price fails to reclaim higher levels.
Confirmation Needed A clean break of 2,980 could accelerate the move.
-Risk Facto If price reclaims 2,990+, the bearish setup might be invalid.

GOLD TRADING POINT UPDATE > READ THE CHPATIANBuddy'S dear friend 👋
SMC Trading Signals Update 🗾🗺️ Gold Traders SMC-Trading Point update you on New technical analysis setup for Gold 🪙 list week profitable profomans reached target point 2961 ) New technical analysis setup for Gold 🪙 a short trend 📉 analysis setup. Guys 🤝 Gold 🪙 1 Time Frame 🪟 patterns chart 📉. Looking for selling zone ☺️ 🤝 FVG level 3006$ 2996$ rejected point below 👇 ⬇️ target point 2832 - 2818. ) again back 🔙 that entry buying said. Update you next analysis Guys 🤝 now follow it' good luck 💯
Key Resistance level 2996+ 3006
Key Support level 2832 - 2818
Mr SMC Trading point
Pales Support boost 🚀 analysis follow)

GOLD (XAU/USD) Weekly Analysis – Correction or Breakout Ahead?Last week, gold (XAU/USD) hit a new all-time high (ATH) at 3005, but a sharp correction followed, bringing prices down to the 2980 - 2985 zone. This volatility suggests that the market is seeking equilibrium before determining the next move.
For the upcoming week, all eyes are on key economic data from the U.S., particularly the Federal Reserve's monetary policy and inflation indicators. These factors will directly impact the USD and gold’s direction.
📉 Gold Market Outlook
After a strong rally, gold is now in a corrective phase, absorbing liquidity before a potential continuation. Based on the technical chart:
The FVG (Fair Value Gap) formation suggests that gold might revisit lower levels to fill liquidity before resuming its trend.
The overall trend remains bullish, but key support levels need to hold for continued upside movement.
The market awaits signals from the Fed and U.S. economic data to determine the next major move.
🔥 Key Factors to Watch This Week
1️⃣ Federal Reserve Policy – Will Rates Remain High?
The Fed has maintained a hawkish stance, but if upcoming economic data show signs of weakness, expectations of rate cuts or easing policies could support gold.
👉 Scenario 1: If the Fed remains committed to tight monetary policy, gold could face more selling pressure and test deeper support levels.
👉 Scenario 2: If the Fed signals a more dovish stance, the USD could weaken, boosting gold prices.
2️⃣ U.S. Inflation & Economic Data – The Game Changer
Key reports like CPI and PPI will be the driving force behind market movements. If inflation slows down, expectations of a Fed rate cut will rise, pushing gold higher.
👉 Higher-than-expected CPI: The Fed may keep rates high → Stronger USD → Gold under pressure.
👉 Lower-than-expected CPI: Expectations for easing policies increase → Weaker USD → Gold rebounds.
📌 Key Support & Resistance Levels for GOLD
🔹 Major Resistance Levels:
3014 - 3034: A crucial zone where previous selling pressure emerged.
3050: A breakout above this level could open the door for further upside movement.
🔹 Major Support Levels:
2942 - 2915: The FVG zone, where liquidity might be filled before a potential rebound.
2885: A breakdown below this level could trigger a deeper correction.
🎯 Conclusion
Primary Trend: Gold remains in a long-term uptrend, but a short-term correction is possible before resuming the bullish move.
Market Catalyst: The direction of gold this week will be dictated by the Fed’s stance and U.S. inflation data.
Key Levels to Watch: 2915 - 2942 as critical support zones, while 3014 - 3050 will act as major resistance.
🔥 This week, closely watch gold’s reaction at key support and resistance levels to assess its next move! 🚀
