USOil the zone 58.200 is retesting again and again The zone 58.200 is retesting again and again.if market again tap this zone we can take trade according to the market condition Buy or Sell .
Commodities

$CRUDE will be very RUDE in upcoming months!on a weekly timeframe Crude consolidating in paraller channel making lower highs lower lows
in other angle its making a BULLISH FLAG pattern.
keep on watchlist.

Gold Holds Rising Channel – Upside Targets Still OpenGold is trading inside a clean rising channel, forming clear higher highs and higher lows, which confirms that the overall trend remains bullish. Instead of chasing breakouts, price is now doing what strong trends usually do, pause and consolidate before the next move.
The marked buying zone sits perfectly inside the rising channel and has already acted as a strong demand area. As long as Gold holds above this zone, buyers remain in control and upside continuation remains the higher probability scenario.
Upside targets are aligned with the channel resistance, which adds further confidence to this setup. These types of structures often reward traders who wait for pullbacks rather than reacting emotionally to fast candles.
A breakdown below the marked invalidation level would weaken this bullish view, but until then, the structure favors patience and trend-following.
Key Levels to Watch
Best Buying Range: 4519–4515
1st Target: 4535
2nd Target: 4553
Final Target: 4570
Structure Invalidation: Below 4497
Trend Bias: Bullish above support
Disclaimer: This analysis is for educational purposes only and should not be taken as financial advice. Please do your own research or consult your financial advisor before investing.

XAUUSD (H1) – Monday Trading StrategyLana prioritizes selling setups until a new high is broken.
Quick summary
Technical context: Price has pulled back strongly from the All-Time High, showing short-term weakness.
Daily bias: Sell on rallies, until price breaks and holds above a new high.
Key events: Speech from U.S. President Trump and updates related to U.S.–China trade may increase volatility.
News impact – what to watch
Trump’s speech: Often drives short-term USD sentiment through comments on growth, tariffs, and inflation. Gold may react sharply to headline risk.
U.S.–China trade activity (CCPIT): Any improvement in trade sentiment can support USD in the short term, adding pressure to gold. Rising tensions would favor gold as a safe haven.
Because of this, Lana will focus on price reaction at key zones rather than predicting the news outcome.
Technical analysis (H1)
Gold printed a new All-Time High and then sold off aggressively, signaling profit-taking near the top.
Price is now consolidating within a corrective structure, where selling rallies remains the higher-probability play.
Key zones identified on the chart:
Sell zone: 4529 – 4531
Buy reaction zone: 4498 – 4500 (support)
Trading plan for Monday
Primary scenario – Sell rallies
Sell: 4529 – 4531
This zone is expected to act as resistance during the current correction.
Bias change condition:
Only shift to a bullish continuation if price breaks above the previous high and holds.
Secondary scenario – Short-term buy reaction
Buy: 4498 – 4500
This is considered a scalp-only setup, as the overall intraday bias remains bearish.
Session notes
Asian session may remain slow, while volatility is likely to increase around the scheduled events.
Best trades are expected when price returns to planned zones rather than trading in the middle of the range.
This analysis reflects Lana’s personal market view and is not financial advice.

SILVER | Monthly TA – High-Risk ZoneSILVER | Monthly TA – High-Risk Zone
#Silver is in a vertical Expansion Phase and Trading far above Long-Term Trend Support.
Price is testing a macro Supply / Distribution Zone after a Parabolic advance.
If Distribution Confirms:
→ Mean Reversion Toward 0.382–0.5 Fib ($39–$31)
→ Extended Correction into 0.618 Fib (~$24) Possible
Momentum is Climactic — Risk > Reward at Highs.
This is a Decision Zone, not a Chase Zone.
Monthly Timeframe | Structure > Noise
⚠️ Disclaimer: This is Pure TA. Markets involve Risk. NFA & DYOR Before Making any Trading or Investment Decisions.

Breakout in Silver (Ag)...Chart is self explanatory. Levels of breakout, possible up-moves (where silver may find resistances) and support (close below which, setup will be invalidated) are clearly defined.
Disclaimer: This is for demonstration and educational purpose only. This is not buying or selling recommendations. I am not SEBI registered. Please consult your financial advisor before taking any trade.

GOLD Rise Up to $5000 Gold will be rising up to 5K dollors and its EWT seems 2nd wave is pushing to 3rd wave in my PoV .Gold Position Traders Holds Gold for 2026 and May returns High . Flippers can do buy at the current price and forward upwards to the market

Litecoin Super potential toward $300?Real Silver is Up +180% YTD 2025 & Digital Silver ( CRYPTOCAP:LTC ) is Down -44% YTD 2025
That Gap is Getting Impossible to Ignore.
When Real Silver is Pumping Hard but Digital Silver is Sleeping, it Usually Doesn’t Last Forever.
If the Rotation Happens in 2026, CRYPTOCAP:LTC at $250–$300 is Very Realistic.
Now Litecoin has One Job: Prove it Truly is Digital Silver.
NFA & DYOR

HINDCOPPER: Trendline and Triangle Breakout, Chart of the MonthWhy This NSE:HINDCOPPER Chart Could Signal India's Next Major Commodity Play, even after giving such a robust run so far. Let's Understand in the "Chart of The Month"
As per the Latest SEBI Mandate, this isn't a Trading/Investment RECOMMENDATION nor for Educational Purposes; it is just for Informational purposes only. The chart data used is 3 Months old, as Showing Live Chart Data is not allowed according to the New SEBI Mandate.
Disclaimer: "I am not a SEBI REGISTERED RESEARCH ANALYST AND INVESTMENT ADVISER."
This analysis is intended solely for informational purposes and should not be interpreted as financial advice. It is advisable to consult a qualified financial advisor or conduct thorough research before making investment decisions.
Price Action Analysis:
Long-Term Trend Structure:
- Historical Peak and Correction: The stock witnessed a spectacular rally in early 2010, reaching an all-time high of ₹658, marking its glory days during the global commodity super-cycle. This was followed by a brutal multi-year correction that took the stock down approximately 90% to levels near ₹55 by 2013.
- Extended Consolidation Phase (2013-2020): After the sharp decline, the stock entered a prolonged seven-year consolidation phase, oscillating between ₹40 and ₹90, building a massive base structure. This extended sideways movement allowed weak hands to exit and created a solid accumulation zone.
- The 2020-2023 Recovery Rally: Post-COVID recovery and commodity reflation themes triggered a strong upward movement from pandemic lows around ₹30-40 to the ₹90-120 range, marking the beginning of a structural reversal.
- Triangle Breakout Formation: The chart clearly displays a large ascending triangle pattern formed between 2020 and 2025, with the stock making higher lows while testing resistance near the ₹420-450 zone multiple times. The recent price action shows a decisive breakout above this multi-year resistance.
Current Price Action:
- Breakout and Retest: The stock has broken out from the ascending triangle pattern and is currently trading around ₹475.60 (as of December 27, 2025), showing a gain of approximately 45% from its recent breakout point.
- Intraday Movement: Current session shows strong volatility with an intraday high of ₹480.85 and a low of ₹443.25, indicating active participation from both bulls and bears near record levels.
- Short-Term Performance: The stock has surged over 75% in calendar year 2025 and has gained approximately 74.8% in the last six months, significantly outperforming the broader Nifty 50 index, which is up only 10.83% year-to-date.
Volume Spread Analysis:
- Volume Surge: The volume panel shows exceptional activity in recent sessions, with December 27 recording 494.78 million shares traded versus the 20-day average of 166.43 million shares, representing nearly 3x the normal volume. This indicates strong institutional and retail interest.
- Second Best Volume in History: Recent sessions have recorded the second-highest volume in the stock's trading history, suggesting a major accumulation or distribution phase.
- Volume Confirmation: The breakout from the triangle pattern is accompanied by robust volume expansion, which validates the move and reduces the probability of a false breakout.
Key Technical Levels:
Support Zones:
- Immediate Support: ₹415-420 zone, which represents the upper boundary of the recently broken triangle pattern. This level previously acted as resistance and should now provide support on any pullback.
- Secondary Support: ₹380-390 range, coinciding with the previous swing high from mid-2024.
- Major Support Base: ₹300-320 zone, which served as a strong consolidation area during the triangle formation phase. This represents a critical support level for the medium-term uptrend.
- Long-Term Base: ₹200-220 area, which marks the ascending trendline of the triangle pattern and would be a key level to watch in case of a deeper correction.
Resistance Zones:
- Immediate Resistance: ₹480-490 zone, representing the current all-time high region for this rally phase.
- Psychological Barrier: ₹500 level, a round number that often acts as psychological resistance.
- Historical Peak: ₹658 (all-time high from 2010), which remains the ultimate resistance target. However, adjusting for inflation and changed market conditions, this level may need to be recalculated.
Base Formation:
- Multi-Year Base (2020-2024): The stock carved out a large accumulation base between ₹150 and ₹450 over approximately four years, characterised by higher lows and repeated tests of the ₹400-420 resistance zone.
- Base Depth and Width: The base shows a well-structured pattern with good width (4+ years) and reasonable depth, which typically precedes significant upward moves.
Technical Patterns:
Ascending Triangle Pattern:
- Formation: Clear ascending triangle pattern visible from 2022 to 2025 with a flat top around ₹420-450 and rising bottoms connecting approximately ₹200 to ₹380.
- Breakout: Decisive breakout occurred in late 2024/early 2025 with strong volume confirmation.
Symmetrical Triangle:
- The cyan-colored triangle marked on the chart shows a shorter-term symmetrical compression pattern forming during 2024-2025, which has also been broken to the upside.
- This pattern suggests continuation of the bullish momentum with potential targets in the ₹500-550 range in the near term.
Higher Highs and Higher Lows:
- Since the 2020 bottom, the stock has consistently printed higher highs and higher lows, establishing a clear uptrend structure across multiple timeframes.
- Each correction has found support at progressively higher levels, indicating strong underlying demand.
Sectoral Backdrop:
Global Copper Market Dynamics:
- Supply-Demand Imbalance: The global copper market is sliding into a deficit, with the International Copper Study Group expecting a refined copper shortfall of around 150,000 tonnes in 2026, reversing previous surplus forecasts.
- Production Challenges: UBS forecasts deficits of 230,000 tonnes in 2025 and more than 400,000 tonnes in 2026 as mine disruptions in Chile, Peru and Indonesia collide with rising demand.
- Price Rally: International copper prices have surged approximately 36% year-to-date, reaching near-record levels above $12,000 per tonne on the LME, driven by tight supply and robust demand.
Structural Demand Drivers:
- AI and Data Centres: Data centres are estimated to need around 1.1 million tonnes of copper annually by 2030, close to 3% of global demand, representing a massive new source of inelastic demand.
- Electric Vehicles: Copper demand from the EV sector is projected to climb from 1.7 million tonnes per annum today to 4.3 million tonnes by 2035, growing at an annual rate of 10%.
- Energy Transition: The shift to renewable energy systems will require an additional 2 million tonnes of copper supply over the next decade, according to Wood Mackenzie research.
- Emerging Market Growth: India and Southeast Asia are expected to add 3.3 million tonnes of demand by 2035, translating to average annual growth rates of 7.8% and 8.2% respectively.
India-Specific Dynamics:
- Strategic Positioning: India is expected to surpass the United States as the world's third-largest copper consumer by 2050, reflecting rapid industrialisation and infrastructure development.
- Import Dependence: India currently imports a significant portion of its copper requirements, making domestic producers like Hindustan Copper strategically important.
- Government Focus: Copper has been included in the US Critical Minerals list, and similar designations globally highlight its strategic importance for economic and national security.
Fundamental Backdrop:
Company Overview:
- Monopoly Position: Hindustan Copper is the only Indian company mining copper and owns all the operating mining leases of copper ore in India, having access to about 45% of India's copper ore reserves and resources as of FY25.
- Vertical Integration: The company is India's sole vertically integrated copper producer, with operations spanning mining, ore beneficiation, smelting, refining, and rod extrusion.
- Government Backing: HCL is a Miniratna Category-I Central Public Sector Enterprise under the Ministry of Mines, providing it with government support and strategic importance.
Production and Operations:
- Production Capacity: Hindustan Copper produced approximately 537,000 tonnes of copper in the financial year 2025, outperforming private sector peers.
- Resource Base: The company holds resources and reserves of 755.32 million tonnes estimated as of April 1, 2024.
- Operational Units: HCL operates mines at Malanjkhand (Madhya Pradesh), Khetri (Rajasthan), and the Indian Copper Complex at Ghatsila (Jharkhand), along with smelting and refining facilities.
Recent Financial Performance:
- Strong Growth: Hindustan Copper reported a 39.1% quarter-on-quarter increase in consolidated revenues for Q2 FY 2025-26, with year-on-year growth of 38.5%.
- Profitability: Net profit increased 38.5% QoQ and 83% YoY in Q2 FY26, demonstrating strong operational leverage.
- Debt Reduction: The company has significantly reduced its debt burden, improving financial health and flexibility for expansion projects.
Strategic Initiatives:
- Revival of Rakha Mine: The company successfully executed a mining lease deed for the strategically important Rakha Mine in September 2024, which should boost future copper output.
- International Collaboration: HCL signed an MoU with CODELCO, Chile's state-owned copper mining giant, in April 2025 to exchange expertise and enhance capabilities in mineral exploration and processing.
- Expansion Plans: An MoU with NTPC Mining Ltd was signed in December 2025 to jointly pursue copper and critical minerals block auctions, indicating an aggressive expansion strategy.
- State-Level Partnerships: MoU signed with Madhya Pradesh State Mining Corporation for exploration of critical minerals, including copper, in the state.
Valuation Metrics:
- PE Ratio: The stock trades at a trailing PE of approximately 80x, which is elevated but reflects its monopoly position and growth expectations.
- Market Capitalisation: As of December 27, 2025, the company's market cap stands at approximately ₹42,992 crore.
Key Developments:
- LIC Stake Sale: Life Insurance Corporation of India reduced its stake from 6.086% to 4.072% through open market sales between August 2024 and December 2025, representing a booking of profits after the strong rally.
Risk Factors:
Technical Risks:
- Overextension: The stock has rallied 75% year-to-date and is trading well above its intrinsic value estimates, suggesting vulnerability to profit-booking.
- Resistance Ahead: The stock is approaching psychological resistance at ₹500 and faces uncertain price discovery beyond current levels.
- Volume Concerns: Extremely high volumes could indicate climactic buying, which sometimes precedes consolidation or correction phases.
Fundamental Risks:
- Commodity Price Volatility: As a pure-play copper producer, the company is susceptible to international copper price fluctuations.
- Production Constraints: Several of the company's smelting and refining facilities have remained suspended since 2019, limiting downstream value addition.
- Operational Efficiency: The company currently sells copper concentrate rather than finished products from some facilities, reducing margins.
- Execution Risk: Ambitious expansion plans through auctions and partnerships carry execution and capital deployment risks.
Market Risks:
- Valuation Multiple Compression: At current elevated valuations, any disappointment in earnings growth or copper prices could trigger sharp corrections.
- Global Economic Slowdown: Recession fears or China slowdown could impact copper demand despite structural growth drivers.
- Supply Response: Higher prices may eventually incentivise new supply additions globally, potentially easing the deficit.
Bull Case:
- India's Only Copper Miner: Monopoly position in copper ore mining provides strategic moat and pricing power.
- Structural Demand Drivers: AI, EVs, renewable energy, and India's industrialisation create multi-year demand tailwinds.
- Supply Deficit: Global copper market moving into deficit with limited near-term supply additions supporting prices.
- Operational Leverage: Fixed cost base means higher copper prices flow directly to the bottom line.
- Strategic Importance: Government backing and critical mineral status provide support for expansion.
Bear Case:
- Extreme Valuation: Trading at a 257% premium to intrinsic value leaves little room for error.
- Production Limitations: Suspended facilities and the concentrate sales model limit revenue potential.
- Execution Uncertainty: New projects through auctions are years away from production.
- Commodity Cyclicality: Copper prices could correct sharply if macro conditions deteriorate.
- Institutional Profit-Booking: LIC stake reduction signals some smart money taking profits.
My 2 Cents:
NSE:HINDCOPPER is at a critical juncture, benefiting from a rare combination of technical breakout, commodity super-cycle dynamics, and structural demand shifts driven by AI and electrification. But at these elevated valuations, be cautious and have disciplined risk management.
Full Coverage on my Mid-Week Newsletter coming Wednesday.
Keep in the Watchlist and DOYR.
NO RECO. For Buy/Sell.
📌Thank you for exploring my idea! I hope you found it valuable.
🙏FOLLOW for more
👍BOOST if you found it useful.
✍️COMMENT below with your views.
Meanwhile, check out my other stock ideas on the right side until this trade is activated. I would love your feedback.
As per the Latest SEBI Mandate, this isn't a Trading/Investment RECOMMENDATION nor for Educational Purposes; it is just for Informational purposes only. The chart data used is 3 Months old, as Showing Live Chart Data is not allowed according to the New SEBI Mandate.
Disclaimer: "I am not a SEBI REGISTERED RESEARCH ANALYST AND INVESTMENT ADVISER."
This analysis is intended solely for informational purposes and should not be interpreted as financial advice. It is advisable to consult a qualified financial advisor or conduct thorough research before making investment decisions.

XAUUSD (H4) – Trading Rising ChannelLana focuses on pullback buys for the week ahead 💛
Weekly overview
Primary trend (H4): Strong bullish structure, price is respecting a clean ascending channel
Current state: Price is trading near ATH and Fibonacci extensions → short-term reactions are possible
Weekly strategy: No FOMO. Lana prefers buying pullbacks at value zones, not chasing highs
Market context
Recent comments from the U.S. highlight strong economic growth and confidence in trade policies. While such statements can influence USD sentiment, gold at year-end is often driven more by liquidity conditions and technical structure than headlines.
With holiday liquidity thinning out, price movements can become sharper and less predictable. That’s why this week Lana stays disciplined and trades strictly based on structure and key levels.
Technical view based on the chart (H4)
On the H4 timeframe, gold is moving smoothly within a rising channel, consistently forming higher lows. The strong impulse leg has already completed its psychological breakout phase, and price is now hovering near the upper area of the channel.
Key points:
Fibonacci extension zones near the top act as psychological resistance, where temporary pullbacks are normal.
The best opportunities remain inside the channel, around value and liquidity zones.
Key levels Lana is watching this week Primary buy zone – Value Area (VL)
Buy: 4482 – 4485
This is a value zone within the rising channel. If price pulls back here and holds structure, continuation to the upside becomes more likely.
Safer buy zone – POC (Volume Profile)
Buy: 4419 – 4422
This POC zone shows heavy prior accumulation. If volatility increases or price corrects deeper, this area offers a more conservative buy opportunity.
Psychological resistance to respect
4603 – 4607: Fibonacci extension & psychological barrier At this zone, a short-term rejection or liquidity grab is possible before the next directional move.
Weekly trading plan (Lana’s approach)
Buy only on pullbacks into planned zones, with confirmation on lower timeframes.
Avoid chasing price near ATH or psychological resistance.
Reduce position size and manage risk carefully during low-liquidity holiday sessions.
Lana’s note 🌿
The trend is strong, but discipline at the entry is everything. If price doesn’t return to my zones, I’m happy to stay patient and wait.
This is Lana’s personal market view, not financial advice. Always manage your own risk. 💛

Gold in Final Bullish Wave – Last Push Higher ExpectedGold (XAU/USD 4H) is in a strong bullish trend and is currently moving in the last part of Wave (5). The clear breakout above the previous resistance shows that buyers are in control, and the bullish structure is still valid. As long as the price stays above the main support area, the outlook remains positive, with the next target around 4,580–4,650 , where this upward move is likely to finish. For short-term trades, a sensible stop-loss can be placed below 4,420 , while the bullish view becomes invalid if the price falls below 4,360 . If everything goes as expected, Gold should make one final move higher and then take a normal corrective pullback (A-B-C) after the strong rally.
Stay tuned!
@Money_Dictators
Thank you :)

XAU/USD – Bullish trend, focus on Buying the DipMarket Context
Gold remains in a bullish environment, trading within an ascending structure. The recent pullback appears to be a technical retracement after an impulsive move, not a trend reversal.
From a fundamental perspective, expectations of a more accommodative Fed continue to weigh on the USD, keeping gold supported on dips. This backdrop favors trend-following BUY strategies rather than aggressive SELLs.
Technical Structure (H1)
Overall structure remains Higher High – Higher Low
Price is holding above the ascending trendline
No confirmed bearish Break of Structure
Current phase = rebalancing / pullback within uptrend
Key Zones on Chart
OBS BUY Zone: 4,483 – 4,475
Deeper Support: 4,457
Near Resistance: 4,515
Upper Resistance / Target: 4,534
Major Supply: 4,566
Trading Plan – MMF Style
Primary Scenario – Trend Continuation BUY
Wait for price to pull back into the OBS BUY zone (4,483 – 4,475)
Look for bullish reaction / structure hold on lower timeframes
This zone aligns with demand + trend support
Targets
TP1: 4,515
TP2: 4,534
TP3: 4,566 (expect reaction / profit-taking)
Alternative Scenario
If price breaks above 4,534 with acceptance
→ Expect a push toward 4,566, but avoid chasing at premium
Invalidation
A H1 close below 4,457 would weaken the bullish structure and shift bias to neutral.
Summary
Gold remains bullish as long as structure support holds. The priority is to buy pullbacks at key demand zones, manage risk near resistance, and avoid emotional entries at the highs.

Hindustan Copper BullishNovember quarter report revenue reported- 7.18B
After a long down trend now stock is break all time high on 26 dec 2025.
Technical Analysis: after breakout stock take retracement at 225 and make a sustain up move tillrange 325-365.
support range 285-400
You can enter here 464 with a stoploss of range 285-400,
Buying Zone range : 285-400

HEG: Long consolidation breakout at 550HEG: CMP 550
Trend: Bullish.
Resistance: 612/683/727
Support: 520/496
Long consolidation breakout at 550. Needs volume to support sustained breakout.

Gold 1H – Smart Money Traps Near 4540–4450 Range🟡 XAUUSD – Intraday Smart Money Plan | by Ryan_TitanTrader (23/12)
📈 Market Context
Gold remains structurally bullish on the higher timeframes, but price is now trading inside a compression zone after a clear impulsive expansion. With year-end liquidity thinning and traders positioning ahead of fresh Fed rate expectations and USD yield fluctuations, Gold is vulnerable to liquidity manipulation rather than clean continuation.
Recent USD softness and mixed macro headlines keep Gold supported, yet extended pricing near highs increases the probability of stop hunts on both sides before the next decisive move.
Smart Money behavior here favors range engineering — drawing in breakout traders above highs and shaking out impatient long positions below key demand — before revealing true intent.
🔎 Technical Framework – Smart Money Structure (1H)
Current Phase: Bullish HTF structure with short-term distribution
Key Idea: Expect liquidity interaction at premium (4540–4542) or discount (4450–4448) before displacement
Structural Notes:
• Higher-timeframe bullish BOS remains intact
• Recent CHoCH signals short-term distribution risk
• Price is trading in premium, extended from equilibrium
• Clear impulsive leg left unmitigated inefficiencies below
• A defined scalping range has formed between premium and discount
• Liquidity rests clearly above 4540 and below 4450
Liquidity Zones & Triggers:
• 🔴 SELL GOLD 4540 – 4542 | SL 4560
• 🟢 BUY GOLD 4450 – 4448 | SL 4440
🧠 Institutional Flow Expectation:
Liquidity sweep → MSS / CHoCH → BOS → displacement → FVG / OB retest → expansion
🎯 Execution Rules (matching your exact zones)
🔴 SELL GOLD 4540 – 4542 | SL 4560
Rules:
✔ Sweep above premium buy-side liquidity
✔ Bearish MSS / CHoCH on M5–M15
✔ Clear downside BOS with impulsive displacement
✔ Entry via bearish FVG refill or refined supply OB
Targets:
1. 4510
2. 4485
3. 4450 – extension if USD strengthens or yields push higher
🟢 BUY GOLD 4450 – 4448 | SL 4440
Rules:
✔ Liquidity grab into discount and prior demand
✔ Bullish MSS / CHoCH confirms demand control
✔ Upside BOS with strong bullish displacement
✔ Entry via bullish FGV fill or demand OB retest
Targets:
1. 4480
2. 4510
3. 4540 – extension if USD weakens and bullish flow resumes
⚠️ Risk Notes
• Premium trading increases fake breakout probability
• No entry without MSS + BOS confirmation
• Expect volatility during U.S. session and thin year-end liquidity
• Reduce risk around Fed-driven or USD yield headlines
📍 Summary
Gold is still bullish by structure, but current price action signals liquidity games inside a defined range. Smart Money is likely to engineer stops before expansion:
• A sweep above 4540 may fade back toward 4485–4450, or
• A liquidity grab near 4450 could reload long positions toward 4510–4540+
Let price show intent — Smart Money waits, retail reacts. ⚡️
📌 Follow @Ryan_TitanTrader for daily Smart Money gold breakdowns.

Why Gold Behaves Differently During Christmas Week – A Lesson!Hello Traders!
If you have traded gold for a few years, you might have noticed something strange around Christmas week.
Your usual setups feel different. Levels don’t react the same way. Moves look random, slow, or suddenly sharp without logic. This is not because your analysis stopped working.
Gold behaves differently during Christmas week because liquidity behaves differently.
Understanding this one concept can save you from unnecessary losses.
What Changes in the Market During Christmas Week
During Christmas week, a large part of institutional traders, banks, and big market participants are either inactive or trading with very light exposure. Volumes drop significantly, and participation becomes uneven.
When fewer large players are active, the market structure changes. Gold still moves, but the quality of moves changes.
I’ve learned to treat this week very differently from normal trading weeks.
Why Low Liquidity Changes Gold’s Behavior
Gold is a highly liquid instrument most of the year, but during holiday weeks, especially Christmas, liquidity becomes thin.
With thin liquidity:
Small orders can move price more than usual
False breakouts become more frequent
Clean follow-through after breakouts reduces
Price starts reacting more to random flows than to strong conviction.
The Common Trap Retail Traders Fall Into
Most retail traders trade Christmas week exactly like any other week. They expect normal volatility, normal reactions, and normal continuation.
What actually happens is different.
Price spikes suddenly, hits stops easily, and then goes quiet again. This creates frustration and confusion, especially for intraday and scalping traders.
I’ve personally learned this the hard way earlier in my trading journey.
Why Gold Can Look “Manipulated” During Holidays
When liquidity is low, price movements feel exaggerated. Stops get hit easily, wicks become longer, and reversals appear sudden.
This makes traders feel like gold is being manipulated.
In reality, it is not manipulation, it is absence of depth. When the market lacks depth, price becomes sensitive.
How I Personally Trade Gold During Christmas Week
Over time, I changed my approach completely for holiday periods.
I reduce position size significantly, even if my analysis is strong.
I avoid aggressive intraday trades and prefer higher timeframe context.
I accept that missing trades is better than forcing trades during low liquidity.
Sometimes, the best trade during Christmas week is no trade.
Why Patience Matters More Than Prediction Here
During Christmas week, prediction matters less than protection. Even correct analysis can fail due to lack of participation.
Gold may move, but moves are often unreliable and short lived. This is where discipline protects capital.
I remind myself every year, markets will still be there next week.
Rahul’s Tip
If gold starts behaving strangely during Christmas week, don’t doubt yourself immediately.
Check liquidity first. Reduce size, reduce expectations, or step aside completely.
Preserving capital during low-quality conditions is also a skill.
Conclusion
Gold does not change its nature during Christmas week. Liquidity changes, and gold simply reacts to that.
When you understand how liquidity affects behavior, you stop forcing trades and start respecting the environment.
If this post helped you understand holiday trading better, like it, share your experience in the comments, and follow for more practical gold trading insights. Happy Merry Christmas to all from @TraderRahulPal :))

XAUUSD (Gold) Technical Outlook - 24/12/2025XAUUSD – Gold Technical Snapshot (Intraday)
Gold remains bullish across higher timeframes (Daily–Monthly). Price is trading near 4,492, close to the day’s high, with all major moving averages aligned upward. Momentum indicators support the uptrend, though overbought conditions suggest possible short-term pullbacks.
Key_Levels
Support: 4,480 / 4,465
Pivot: 4,495
Resistance: 4,520 → 4,550 → 4,575
Outlook & Strategy
Bias stays bullish above 4,480
Buy pullbacks near support or breakouts above 4,520
Below 4,465, expect a corrective move toward 4,440–4,410
Disclaimer: This analysis is for educational purposes only and not financial advice. Trading involves risk—always manage your risk and do your own research.

Gold 1H – Traps form near 4500–4420.Gold 1H – Liquidity Compression Sets Traps Around 4500–4420
🟡 XAUUSD – Intraday Smart Money Plan | by Ryan_TitanTrader (23/12)
📈 Market Context
Gold is trading inside a strong bullish structure after a clean impulsive expansion, currently hovering in a premium zone near recent highs. With price extended from the mean, the market is vulnerable to liquidity engineering rather than immediate continuation.
CPI uncertainty and mixed USD flows continue to reduce directional conviction, favoring stop hunts at key psychological levels instead of clean breakouts. This environment often rewards patience and confirmation-based execution rather than anticipation.
Smart Money is likely to manipulate both sides of the range — sweeping late buyers above 4500 or shaking out weak longs into the 4420 discount before the next meaningful expansion.
🔎 Technical Framework – Smart Money Structure (1H)
Current Phase: Bullish structure with signs of short-term distribution
Key Idea: Expect liquidity interaction at 4500–4502 (premium) or 4420–4418 (discount) before displacement
Structural Notes:
• Higher-timeframe bullish BOS remains intact
• Price is trading deep in premium, extended from equilibrium
• Clear impulsive leg created unmitigated FVGs below current price
• Momentum is slowing near highs → distribution risk
• Liquidity is resting clearly above 4500 and below 4420
Liquidity Zones & Triggers:
• 🔴 SELL GOLD 4500 – 4502 | SL 4510
• 🟢 BUY GOLD 4420 – 4418 | SL 4410
🧠 Institutional Flow Expectation:
Liquidity sweep → MSS / CHoCH → BOS → displacement → FVG / OB retest → expansion
🎯 Execution Rules (matching your exact zones)
🔴 SELL GOLD 4500 – 4502 | SL 4510
Rules:
✔ Sweep above psychological 4500 buy-side liquidity
✔ Bearish MSS / CHoCH on M5–M15
✔ Clear downside BOS with impulsive displacement
✔ Entry via bearish FVG refill or refined supply OB
Targets:
1. 4470
2. 4450
3. 4420 – extension if USD firms or risk-off accelerates
🟢 BUY GOLD 4420 – 4418 | SL 4410
Rules:
✔ Liquidity grab into discount and bullish structure support
✔ Bullish MSS / CHoCH confirms demand control
✔ Upside BOS with strong bullish displacement
✔ Entry via bullish FVG fill or demand OB retest
Targets:
1. 4450
2. 4475
3. 4500 – extension if USD weakens and bullish flow resumes
⚠️ Risk Notes
• Extended bullish moves increase fake breakout probability
• No entry without MSS + BOS confirmation
• Expect volatility during U.S. session
• Reduce risk around CPI-related or Fed-driven headlines
📍 Summary
Gold remains structurally bullish, but trading at premium levels where conviction is fragile. Smart Money is likely to engineer liquidity before the next expansion:
• A sweep above 4500 may fade toward 4450–4420, or
• A liquidity grab near 4420 could reload bullish flow toward 4475–4500+
Let price reveal intent — Smart Money waits, retail rushes. ⚡️
📌 Follow @Ryan_TitanTrader for daily Smart Money gold breakdowns.

Gold Trading Psychology: Right Analysis, Wrong Position SizeHello Traders!
Over the years, I’ve noticed something very common in gold trading.
Most traders are not wrong in their analysis. In fact, many of them read gold levels, structure, and direction almost perfectly. The problem usually starts after the entry, not before it.
The trade fails not because the idea was wrong, but because the position size was too big to handle emotionally.
This is one of the most silent killers in gold trading.
Why Gold Punishes Position Size Mistakes
Gold is not a slow-moving instrument. Even during normal market conditions, it can move sharply within minutes. When your position size is larger than what your mind can comfortably handle, every small pullback starts feeling like a threat.
Instead of calmly following your plan, your focus shifts from structure to P&L.
At that moment, psychology takes over logic, and the trade usually ends badly, even if price later moves exactly as you expected.
What Actually Happens Inside the Trader’s Mind
This is something I’ve personally experienced earlier in my journey.
You enter a gold trade with confidence because your analysis is clear.
Price moves slightly against you, which is completely normal.
But because the position size is heavy, your heartbeat increases, your screen gets more attention than it deserves, and suddenly you are no longer reading price, you are reading fear.
Stops get adjusted, exits get rushed, and discipline quietly disappears.
Why Traders Oversize Gold Positions
Many traders oversize gold because it feels familiar and liquid. Some do it because gold has given quick profits in the past, creating overconfidence. Others do it subconsciously to recover previous losses faster.
But gold does not reward emotional urgency.
It only rewards patience, structure, and controlled risk.
How I Corrected This Mistake in My Own Trading
The biggest improvement in my gold trading came when I stopped thinking in terms of lots and started thinking in terms of mental comfort.
I began sizing my trades in a way where even if the stop loss was hit, it would not disturb my mindset or decision-making. Once I did that, something interesting happened, my execution improved automatically.
Same charts.
Same analysis.
Very different results.
The Real Secret Behind Consistency in Gold
Consistency in gold does not come from predicting every move correctly.
It comes from staying calm while the move is developing.
And calmness is impossible if your position size is forcing you to watch every tick.
If you cannot hold the trade without stress, the size is wrong, no matter how good the setup looks.
Rahul’s Tip
Before placing any gold trade, ask yourself honestly:
“Can I hold this position calmly if gold moves against me first?”
If the answer is no, reduce the size. Protecting your mindset is more important than chasing profits.
Conclusion
Many traders lose money in gold despite having good analysis.
The real issue is not strategy, indicator, or entry timing.
Right analysis with wrong position size will still lead to losses.
But average analysis with correct sizing can build long-term consistency.
If this post felt relatable, like it, share your experience in the comments, and follow for more real gold trading psychology.

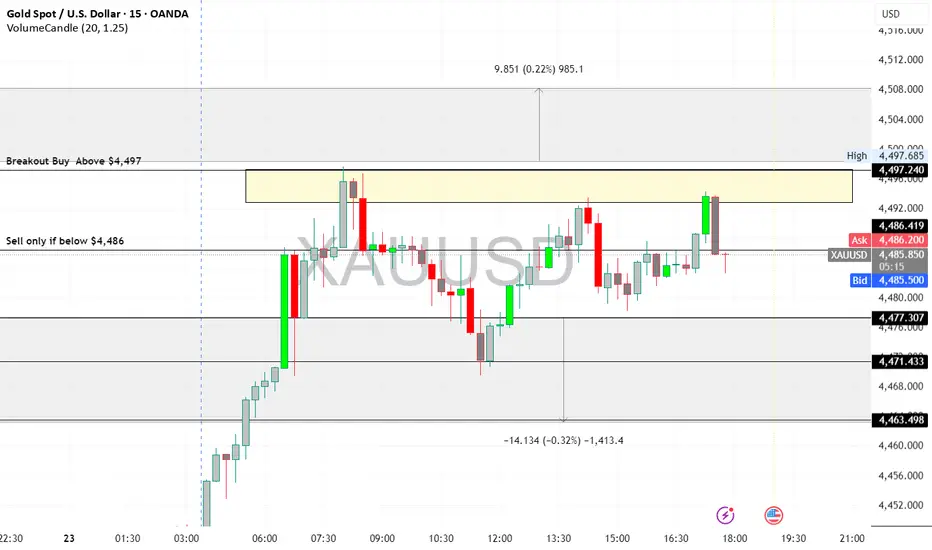
XAUUSD (Gold) Intraday Outlook - 23/12/2025XAU/USD Trend: Strong Bullish
Current Price: $4,491.99
Key Levels:
Support: $4,486 / $4,479
Resistance: $4,497 / $4,501 / $4,508
Pivot: $4,490
Strategy:
Buy on dips: $4,486–$4,479 → Target $4,497–$4,501
Breakout buy: Above $4,497 → Target $4,501–$4,508
Sell only if below $4,486
Gold remains bullish; prefer buying on dips or breakouts, keep stops tight near support.
Disclaimer: Trading involves risk. This analysis is for educational purposes only and is not financial advice. Trade responsibly.
Silver at a Critical Inflection Point [25% DOWNSIDE EXPECTED]Silver has delivered a powerful rally this year , but key Technical Milestones will now complete. in the 72-75 zone
🔹 Multiple Cup & Handle targets achieved on the log chart
🔹 ~300% Fibonacci extension of the post-COVID move reached
🔹 Decades-long $50 resistance broken — a major structural event
🔹 Using price symmetry, $75 now stands out as a heavy resistance zone
🔹Possible Retracement zone: 46 to 54
📉 With pattern completion and long-term resistance converging, risk-reward strongly favors caution at current levels.
Markets move in cycles — and Silver may be entering the next phase.
NOT SEBI REGISTERED. ⏐ ALL VIEWS ARE PERSONAL⏐ NOT AN INVESTMENT ADVICE

NMDC, big breakout candidateNMDC 80 weekly breakout happening after long consolidation. VCP pattern on daily charts plus all bullish crossover on leading and lagging indicator
Metals and PSU stocks getting buying (short covering also)
Expected higher levels if breakout sustained is 88 to 105. Invalid below 78 closing on 2 day basis

Silver Intraday: Exhaustion Sell Near Upper Bollinger BandTrading Day - Monday (22nd Dec 2025)
Entry : Sell
Entry Zone: 208,000 – 208,200
Stop Loss: 208,760
Targets: MCX:SILVER1!
T1: 207,000
T2: 206,000
Reason:
* Upper BB rejection candle → momentum exhaustion
* PSAR dots compressing → trend strength weakening
* Vertical rally without pullback → correction likely
* Red candle after strong green → profit booking sign
* Price far above BB mid → mean reversion risk
Risk:
• Risk per trade < 2%
• Avoid trade if SL hit or Wait for next Entry confirmation
#Silver
#Intraday
#Commodities
#RSI
#PSAR
#RiskManagement
