GUJGASLTD - CONFLUENCE (MORE PROBABILITY)Confluence:
1. Moving Average
2. Break of Structure
3. Fibonacci golden level
624-630 are the demand zone levels. Once price reaches the zone, wait for candlestick confirmation and break of structure in retracement trend.
Confluence

GRANULES - ACCUMULATE FOR LONGTERMHere we can see distribution in Granules after a long run up since the last few years.
Its advisable to take small quantities with a longer time frame in mind.
The Rectangular marked space is a confluence area on the daily chart, expect the zone to be held buy buyers. If everything plays out well we should break out on the upside by the end of this year.

THOMAS COOK | POLE FLAG + SUPPORT CONFLUENCEREASONS FOR ENTERTING TRADE
1. A pole flag structure with the base of the flag bouncing off the 200EMA.
2.This 200EMA bounce point coincides with the long-term support trendline,
3. & the 61.8% retracement of the pole.
3. Price sustains above the flag range after retest
Buying above 65 for a projected price target which is set as the pole height, from the breakout point.
SL 56


Confluence of Demand zone and Triangle in AirtelBhartiAirtel is showing a symmetrical triangle pattern and a triangle pattern with a long term demand zone.Wait for a breakout.preferably upward movement is coming and take a long postion with a target of 600.

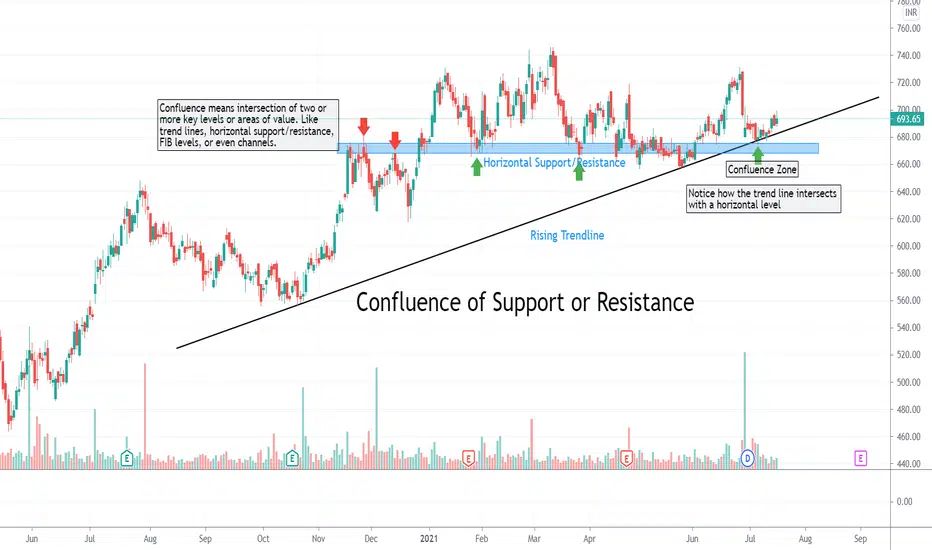
Confluence of Support or ResistanceA confluence of support or resistance is simply an intersection of two or more important levels. Market participants prefer to trade around a zone that involves two or more factors rather than a zone with just one. The probability of winning is higher around confluence zones.
Buy Tata PowerGo for Long position in Tata Power..
Showing good consolidation and a confluence of trend line and a triangle pattern.might be a wealth creator.


Mentorship InstaView 29 June’21: Strong intra-day Supports
Nifty View: Seems like the “Dark Cloud Cover” pattern about which I mentioned yesterday did play out a bit in today’s trading session as the benchmark Nifty dropped 0.38% to close at 15,795. Now a closer look at the 15min chart of the index clearly shows how the index faced support within the range of (15,760-15,780) multiple times in today's trade. And a couple of more interesting facts - we have a 61.8% Fibonacci Retracement and the “Point of Control” from Volume Profile which confluences close to this range. What does this mean? We have a very strong short term support close to 15,750 and if this level holds tomorrow then we will see a fine bounce back. Keep a close eye on RELIANCE.
Thank you for following my work and please feel free to share your thoughts and suggestions.
Trade Well. Trade Wise.

SBI Card is approaching the zone—upside potential of 15%+?NSE:SBICARD has approached the 200SMA on Daily chart and is not too far away from 50SMA on Weekly. As highlighted in the chart, we can see a confluence of support zone and FIB level.
A confirmation candle might be needed, but it looks like an interesting long setup, especially if 900 is retested and held. Target can be around ATH which is ~15-20% away.
Price action in this stock tends to be a little choppy, so best to be alert.

Support Confluence + AB=CD
Buy : 54
Tgts of 60.8 , 62.7.
SL: 49
Trade according to your own risk appetite. Thank you.

ASHOKA | CONFLUENCE SETUP FOR 16%Reasons for trade explained in the chart.
Buy above 90, for targets of 115, SL 77.
Thank you.

► ADVANCE PATTERN #8: APLLTD ◄► ADVANCE PATTERN #8 ◄
📌 Levels are mentioned on chart for ❝Swing trading❞. These are original and unique patterns that can achieve their target almost 80-90% times. Here, I have posted one of my favourite 💕 chart patterns.
☆ Please check the description section ⌨ for early entry level in given stock ₪ to get better Risk to Reward (☈☈) ratio.
☆ Kindly like & share ➥ this pattern. Comment ⎚ with what do you think. Follow me @ tradingview for more updates and like the chart ❤!!!
▣ Key Highlights:
➨ Rounding pattern of 1 Year
➨ Cup with handle
➨ Inverted Head and Shoulder
➨ MA 100 Resistance
➨ Double W pattern
➨ Unique Confluence
📌 Levels are;
Entry: ▲ 1000
SL: ☢ 950
Target: ➚ 1111/1212/1313
RR: ☈ 1:4
Thank you. Happy Trading!!!
Best Regards,
𝘿𝙧. 𝙎𝙝𝙖𝙢𝙧𝙖𝙟𝙖 𝙉𝙖𝙙𝙖𝙧
𝙋𝙝𝘿 𝙞𝙣 𝙏𝙚𝙘𝙝𝙣𝙤𝙡𝙤𝙜𝙮.
✮ Disclaimer ✮
--------------------------------------------------------
All investments involve risk, and the past performance of a security, industry, sector, market, financial product, trading strategy, or individual’s trading does not guarantee future results or returns. Investors are fully responsible for any investment decisions they make. Such decisions should be based solely on an evaluation of their financial circumstances, investment objectives, risk tolerance, and liquidity needs.
---------------------------------------------------------

RELIANCE: When was the last time you saw the stock down over 8%?RELIANCE sells off with a historical one-day fall of 180 points. The stock has been in a downtrend for some time and never managed a bounce back for pull-back traders to initiate a short trade. Over the past three weeks, the stock has corrected significantly from its recent high of 2300. Not to forget the fact that RELIANCE is the top-weighted stock in the bourse. So how far will it fall?
This is the daily chart of RELIANCE wherein I have marked important zones of demand and supply which have proven itself in the past. On top of that, I have plotted the Fibonacci Retracement to find confluences. And yes, we do have a few of them. First, the range of (1790-1820), which is the immediate support for the stock. Considering the momentum with which the stock corrected today, we can expect a soft landing at this zone soon. It's a little far fetched, but the zone of (1600-1620) is a very strong support range for the stock, which we do not expect to get tested anytime soon, but will definitely keep in mind if things go really bad.
Any counter bounce back from current prices, of course, will face multiple resistances of which the first one is at the psychological 2K level. Strategically, if you are short on the stock and making money, then it’s a good idea to protect open profits by trailing stop loss. And if you are contemplating a buy at lower levels in your cash portfolio, then a staggered approach below 1850 towards 1790 is advisable.
Trade Well. Trade Wise.

Bajaj Finance | Confluence of ResistanceBajaj Finance has hit a confluence of resistance. Should be a good place to initiate shorts will stop above 50 SMA.
(Disclaimer: Our charts and contents are just for the purpose of analysis, learning and general discussion. Do not consider these as trading tips or investment ideas. Trading in Stocks, Futures and Options carry risk and is not suitable for every investor. Hence it is important to do your own analysis before making any investment or trading decisions based on you personal circumstances and it is always better to take advice from professionals)

AB=CD, FLAG-POLE & FIBONACCI CONFLUENCE @ BOILEVELS MENTIONED IN THE CHART.
Disclaimer:
It is very important to do your own analysis before making any investment based on the chart mentioned here.
Trade wisely!

The Confluence TradeI can see lot of convergence at 503 to 512 zone. That's a big zone but I can't help it b'coz ATR is high. Also observed bullish gartley and ABCD harmonic pattern in a highly oversold zone. So there are high chances of reversal from this zone. I ll hunt for 538, 558 and 568. Initial stops is quite wide, but it could be set below the buying signal which will be assumed as the established swing low.
Kindly apply your own due diligence before trading ideas from TV.
Trade safe and Do hit the like button.
Regards
Bravo

Bata: Dancing On The CloudsThe stock broke out of a long term resistance near 610 on higher timeframe charts. Overall market correction may push the stock down to retest 610 zone again, which may now act as a support. This zone coincides with the rising channel trendline. I also expect that by the time the stock retests that zone, the 55 EMA will also be there (hand drawn on the chart) to provide extra cushion.
So at the 605/615 zone, we will have the confluence of potential horizontal support; channel trendline support; and supposedly the 55 EMA.
The stoploss for this trade would be 580 and the targets would be 647, 660, 680 and near 700 .
Hit like if this information can be useful.
Trade Safe.
Do you own research before trading with my ideas.
Regards
Bravetotrade

MotherSumi: The Confluence ZoneOne can clearly observe: nice rotation of price inside a channel; the wedge formation; and the price bouncing from a support line (red dashed line). Currently the stock has retraced back to an important confluence point at 214-215 zone.
On short side, a break below the confluence zone can take the price to 310.50 and 307.50 levels. Stops would be above 320.
On the other side, the aggressive long entries can be taken at the confluence point with stops below this zone. If one needs more confirmation, staying above 320 can take the stock to 322 and 328 levels.
Hit like if you think this information can be useful. Comments are welcomed.
Trade safe.
Best Regards
Bravetotrade

Tata Motors trading nervyAs per fibonacci analysis,
Tata Motors is still trading in the green box which is a bullish signal.
It has consistently retraced from 0.5 fibonacci ratio.
Expect a strong upmove towards 460 levels where it will get a resistance from the confluence line .
Keep a strict stoploss of 425.
Any closing below 425 will take the stock further down by atleast 5%

Educational 11: Elliott Waves + Butterfly Pattern Confluence In the above chart, I have showcased a confluence or relationship between Elliott Waves and Harmonic Patterns. Where I have mentioned and pointed out time where they confluence and provide us a successful trading opportunities. Such confluence is simple to understand and provide a great reward over risk by initiating in them.
I have attested below edcuational chart of Butterfly Pattern and also a confluence between Elliott Waves and Head n Shoulder pattern for further reference.
I would appreciate your comments, charts and opinion on the same.
Regards,
Neetesh Jain
