Yatharth Consolidation Breakout in Progress?? Some Insights...⏺️Technical Analysis
⏹️S napShot
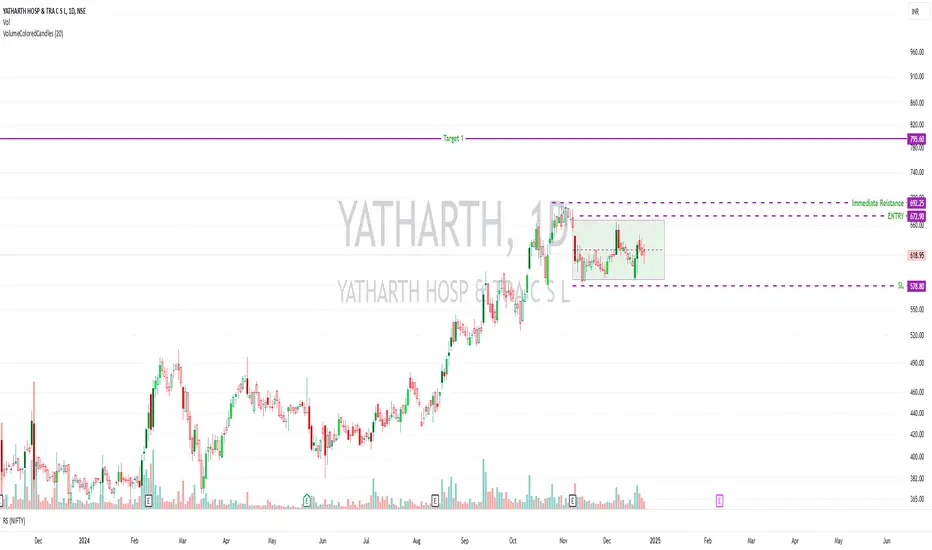
Entry: 672.9
SL: 578.8
Positional Target 795.6
692.25 is an immediate resistance, breakout from this level with volume and wide range candle can be considered for further addition or fresh entry. Exercise caution since overall market is bearish and sell on the rise.
✅Detailed Analysis
⏹️Price Action: The stock is currently in a consolidation phase, with strong support at ₹578.80 and resistance at ₹692.25.
⏹️Entry is suggested at ₹672.90, with an immediate target of ₹795.60. If the resistance at ₹692.25 is broken with significant volume, it may signal the start of a new uptrend.
⏹️Stop-loss is placed at ₹578.80 to protect capital in case of adverse price movement.
⏺️Volume & Momentum: The price action indicates the stock has strong buyer interest near the lower end of the consolidation range.
⏺️The Relative Strength (RS) against the Nifty shows a gradual upward trend, indicating that the stock is outperforming the market.
✅Fundamental Analysis
⏺️Key Metrics:
⏹️Market Cap: ₹5,314 Crore – A mid-cap company in the growing healthcare sector.
⏹️Current Price: ₹619.
⏹️P/E Ratio: 41.1 – The stock is trading at a higher valuation compared to the industry average, suggesting strong growth expectations. However, this should be justified by robust revenue and profit growth.
⏹️Book Value: ₹109 – The Price-to-Book ratio is ~5.67, indicating that the stock is priced significantly above its net assets.
⏹️ROCE (Return on Capital Employed): 23.9% – A strong indicator of efficient capital utilization, well above the 15% benchmark for quality companies.
⏹️ROE (Return on Equity): 21.7% – This shows the company is generating significant returns for shareholders.
⏹️Dividend Yield: 0.00% – Indicates the company is likely reinvesting profits into growth rather than paying dividends.
⏺️Sector Analysis:The Indian healthcare industry is growing rapidly, driven by increasing demand for medical services, rising incomes, and expanding medical insurance coverage.
Yatharth Hospitals is positioned to benefit from this growth, especially in urban and semi-urban areas.
⏺️ Strengths: Strong Profitability Ratios: Both ROCE and ROE are impressive, reflecting efficient operations and shareholder returns.
⏺️ Signalling Growth Potential: With no dividend payouts, the company is focused on reinvestment and expansion, signalling aggressive growth plans.
⏺️ Valuation Concerns: While the company shows strong operational metrics, the high P/E ratio suggests the market is pricing in significant growth. Investors should monitor quarterly earnings to ensure growth expectations are met.
⏺️ Risk Factors: High valuation could lead to short-term volatility if earnings do not meet market expectations.
Rising competition in the healthcare sector and regulatory risks (like price caps on services) could impact margins.
⏺️Trade Plan
Positional: For traders, a breakout above ₹692.25 with volume provides an opportunity for a quick rally toward ₹795.60.
Maintain a stop-loss at ₹578.80 to minimize risk.
⏹️ Long-Term: The company has strong fundamentals and operates in a growing sector, making it a promising long-term investment.
However, given its high valuation, investors should ideally wait for dips or monitor quarterly results to ensure consistent performance before making significant allocations. Overall market is sell on the rise and bearish. So risk management is the key.
Consolidation-breakout
Emmbi Industries Ltd Technically checks many boxes.Emmbi Industries Ltd.
📅 Timeframe: Daily Chart
Technical Observations
1. Cup and Handle Breakout:
2. Inverse H&S
3. Base Breakout
The stock has formed a classic Cup and Handle and an inverse Head and Shoulders pattern, which is a bullish continuation setup.
3. Three White Soldiers:
Post-breakout, the stock formed Three White Soldiers (three consecutive bullish candles), a strong bullish indicator.
Fundamental Snapshot
💼 Market Cap: ₹300 Crores (Small Cap).
📊 Current Price: ₹169.
📈 High/Low: ₹172 / ₹87.6 (52-week range).
📚 Book Value: ₹104 (Price to Book Ratio: ~1.63).
📉 PE Ratio: 29.6 (relatively higher compared to industry standards).
💸 Dividend Yield: 0.18% (low yield).
📊 ROCE: 8.43% (moderate efficiency).
📈 ROE: 6.03% (average return for shareholders).
Key Levels to Watch
-Entry Point: ₹172 or wait for multiyear Breakout level
175.
-Stop Loss (SL): ₹129.73 (Below the handle and
consolidation support).
🎯 Targets:
All-Time High (ATH): ₹262.45 (Medium-to-long-term target).
Strengths of the Setup
✅ Volume Confirmation:
Breakout backed by rising volumes, indicating strong market interest.
✅ Trend Alignment:
Stock is trading well above the 50-day and 200-day moving averages, supporting the bullish trend.
✅ Healthy Consolidation:
The long consolidation before the breakout reduces the chance of a false move.
Risks and Considerations
⚠️Microcap Company.
⚠️ Valuation Concerns:
PE ratio (29.6) is on the higher side, indicating the stock might be overvalued compared to peers.
⚠️ Dividend Yield:
At 0.18%, the dividend yield is minimal, which may not attract dividend-seeking investors.
⚠️ Broader market conditions (e.g., Nifty 50, Nifty 500) should support bullish sentiment 📉.
Trading Plan
📌 Buy Above: ₹172.0 or wait for breakout of 175
📌 Stop Loss (SL): ₹129.73 (Strictly on closing basis)
📌 Targets:
Medium-Term: ₹262.45 🎯
📊 Watch for a pullback retest of ₹159.00 with rising volumes. It can be an excellent re-entry or adding opportunity.
Do not forget to position size since the SL is extremely Deep. Risk management is the key here. Market conditions are bad and unpredictable. Please excuse Ttypos if any.

SHARDACROP: Breakout Alert!
From our Previous entry( which I posted here) Stock clocked 23%. Now it is:
✅ Consolidation Above Breakout Zone: Healthy consolidation near ₹879, indicating strength and accumulation.
✅Base on Base Formation
✅ Volume Confirmation: Significant volume during the breakout phase, validating bullish sentiment.
✅ Support from Moving Averages: Price trading above the 50 and 200 DMAs, confirming a bullish bias.
🎯 Key Levels:
Entry Zone: ₹-879-880
Medium-Term Target: ₹1,050-1,100
Stop Loss: ₹773 (Closing Basis)
💡 Risk/Reward:
Risk: ~11.8%
Reward: ~20%-22%
📌 Note: Always maintain proper risk management and conduct your own research before taking any position.

INFY BREAKOUT ON Daily TF and Weekly TFInfosys (INFY) has been in a prolonged phase of consolidation, repeatedly testing a well-established resistance level over time. Despite multiple attempts, the stock consistently retracted from this level without delivering a decisive breakout. However, INFY has now closed convincingly above this resistance on both the Daily and Weekly time frames. This breakout suggests a strong potential for an imminent upside, supported by technical confirmation.
This setup presents a favorable risk-reward trade opportunity, with minimal risk due to the narrow stop-loss range. For investors with a long-term perspective, INFY also offers the possibility of substantial gains, even without relying on a stop-loss strategy. The breakout marks a critical juncture, highlighting its potential for sustained bullish momentum.

ASALCBR - 3 Months Consolidation Breakout - All Time HighAssociated Alcohols & Breweries Ltd
1) Time Frame - Daily.
2) The Stock has been in a Consolidation since (September, 2024). Now, It has given a Consolidation breakout & Closed at it's Life Time High with good volume & good bullish momentum candle in Daily Time Frame.
3) The stock may find it's next resistance around the price (1200 - 7.80% from the current price 1112.95).
4) Recommendation - Strong Buy.

MCX - 2 Months Consolidation Breakout - All Time HighMulti Commodity Exchange of India Ltd
1) Time Frame - Daily.
2) The Stock has been in a Consolidation since (October, 2024). Now, It has given a Consolidation breakout & Closed at it's Life Time High with good volume & good bullish momentum candle in Daily Time Frame.
3) The stock may find it's next resistance around the price (7900 - 14.15% from the current price 6920) .
4) Recommendation - Strong Buy .

AGIAGI coming out of long consolidation. market participation also increased in recent positive sessions.

PENNAR IND, momentum stockPennar ind at 220, gave consolidation breakout. Stock is into momentum on higher side on longer time frame.
Can expect 260 to 290 in medium term

Keep an EYE on Usha Martin LtdBigger the consolidation better the breakout / so keep an eye on usha martin ltd / high probability of channel breakout on daily chart. cmp 413.40 Plan your trade
not a buy or sell recommendation / do your analysis before take a trade

Atul Consolidation after Breakout Now Ready to BreakoutNSE:ATUL Consolidating after Previous Breakout Now Ready to Breakout again if closed above 8136. Consistently Rising Volumes in the Past Few Days. Keep in Radar.
Check out my other stock ideas below until this trade gets activated, I would love your feedback.
Disclaimer: This analysis is intended solely for informational and educational purposes and should not be interpreted as financial advice. It is advisable to consult a qualified financial advisor or conduct thorough research before making investment decisions.

@tatapower range breakout done Swing trading concept NSE:TATAPOWER Swing trading concept
Range breakout strategy
Daily time frame
Duration 15-20 days
Breakout done with rising volume 📈🚨✔️
Stoploss at your risk
Do as directed
Do your analysis before taking any step
This is not trading recommendation or advise

Continuous Accumulation With Consistent VolumesNSE:RENUKA has been Continuously Accumulated with Consistent Volumes in the past 4 Months with Positive Cues on Ethanol on the Domestic Front adding to Brazil's Wildfires on the Global Front. Today it Broke the Consolidation Range with Heavy Volumes.
A Close above 54 Levels will have more Upside, and 47 Will be a Crucial Level to Defend the Accumulation Zone is Crucial. Keep a Watch.
Check out my other stock ideas below until this trade gets activated, I would love your feedback.
Disclaimer: This analysis is intended solely for informational and educational purposes and should not be interpreted as financial advice. It is advisable to consult a qualified financial advisor or conduct thorough research before making investment decisions.

Breaking Consolidation With Increasing Relative StrengthNSE:ULTRACEMCO is Breaking the Consolidation range, crossing key levels after getting consolidated at Accumulation Zones, in Reverse Cup and Handle Pattern.
Check out my other stock ideas below until this trade gets activated, would love to have your feedback.
Disclaimer: This analysis is intended solely for informational and educational purposes and should not be interpreted as financial advice. It is advisable to consult a qualified financial advisor or conduct thorough research before making investment decisions.

monthly breakout!Above chart is of timken india which is involved in business of manufacturing ball bearings,incorporated as tata timken.
technical point of view
1.on a weekly tf we can see the stock consolidating around 21 ema an good break above it can result in quick upside momentum.
2.if you look closely on the monthly tf the stock beautifully consolidated in a channel for 570-580 days and broke the resistance.
3.according to charts a long term trade or an mid term trade can be executed smoothly on cuuret levelskeeping sl below the 21 eme on monthly tf
(closing basis)
4.targets can be kept firstly on the all time high which is around 28-29% and secondly around 60% for long term
5.simple rr of 1:4 can be achieved if market continues the upside momentum if not one can close trade according to his/her appetite
ALWAYS REMEMBER NO ANALYSIS IS PERFECT AND IAM NOT YOUR FINANCIAL ADVISOR,DO YOUR OWN RESEARCH
ABOVE POST IS ONLY FOR EDUCATIONAL PURPOSE,NO BUYING RECOMMENDATION
do follow me for such content i will try to give my best

CREST - 8 Months Consolidation Breakout - All Time HighCrest Ventures Ltd
1) Time Frame - Weekly.
2) The Stock has been in a Consolidation since (February, 2024). Now, It has given a Consolidation breakout & Closed at it's Life Time High with good volume & good bullish momentum candle in Weekly Time Frame.
3) The stock may find it's next resistance around the price (790 - 34.25% from the current price 588.45).
4) Recommendation - Strong Buy.

A Bullish Breakout Analysis of Alkyl AmineAlkyl Amine stock has recently exhibited a noteworthy price action following a consolidation phase that extended beyond 1,000 days. The stock has successfully retested a pivotal support level and demonstrated a robust bounce, closing above this key level, accompanied by a significant surge in buying volume. This development is indicative of a potential shift in the trend towards a bullish posture.
From an Elliott Wave analysis perspective, the stock appears to be in the early stages of a wave pattern. This observation aligns with the bounce occurring at the 61.8% Fibonacci retracement level from the most recent higher high, suggesting a critical change in momentum.
Further validating the bullish outlook, momentum indicators such as the RSI and the MACD are showing favourable signals on both the daily and weekly timeframes, reinforcing the likelihood of upward price movement.
In terms of potential price levels, the current-demand zone is identified between 2305 and 2349 . Should the stock succeed in closing above the initial resistance level at 2484 , the next resistance levels to monitor would be at 2848 , 3162 , and ultimately 3526 .
Disclaimer: This analysis is intended solely for informational and educational purposes and should not be interpreted as financial advice. It is advisable to consult a qualified financial advisor or conduct thorough research before making any investment decisions.

GMBREW - 2.5 Months Consolidation Breakout - All Time HighG M Breweries Ltd
1) Time Frame - Daily.
2) The Stock has been in a Consolidation since (July, 2024). Now It has given a Consolidation breakout & Closed at it's Life Time High with good volume & good bullish momentum candle in Daily Time Frame.
3) The stock may find it's next resistance around the price (1155 - 17% from the price 986.30).
4) Recommendation - Strong Buy.

Ascending Triangle formationAscending Triangle formation as well as Symmetrical Triangle Formation seen in L&T. Also it has been in consolidation since January, 2024. Most Probably it will give a strong Breakout very Soon.

M&MFIN A BREAKOUT - WILL IT SUSTAIN OR WILL IT FIZZLE OUT ?Mahindra & Mahindra Financial Services Ltd. is an interesting consolidation breakout with following
1. RSI on all time frames (D/W/M) above 60
2. ABCD pattern under formation on Monthly chart
3. Major 20 Week SMA support near 290
4. Breakout of 16 months consolidation between 250-325 zone
Will it sustain or will it Fizzle out ?
Lets See How it evolves.
Lets See How it Evolves.
Disclaimer: NOT A BUY / SELL RECOMMENDATION I am not an expert I just share interesting charts here for educational purpose and not to be taken as buy/sell recommendation. Please seek expert opinion before investing and trading as trading/ investing in market is subject to market risks. I do not hold any position in the stock as on date but I may look to buy on dips with my own Risk Reward matrix.

AMI ORGANIC A BREAKOUT WILL IT SUSTAIN OR FIZZLE OUT ?AMI Organics Ltd. is an interesting breakout
1. RSI on all time frames above 60
2. Narrowing Bollinger Bands on Weekly chart with Price walking on upper band
A BREAKOUT Will it sustain or Will it Fizzle out ?
lets see How it evolves.
Lets See How it Evolves.
Disclaimer: NOT A BUY / SELL RECOMMENDATION I am not an expert I just share interesting charts here for educational purpose and not to be taken as buy/sell recommendation. Please seek expert opinion before investing and trading as trading/ investing in market is subject to market risks. I do not hold any position in the stock as on date but I may look to buy on dips with my own Risk Reward matrix.

JUBLPHARMA - 6 Years -Consolidation breakout - WklyJUBLPHARMA - Price consolidated 6 years and gave breakout with very good volume.
Good setup to enter if it retest the breakout around 1000 levels.
Name - JUBLPHARMA
Pattern - Consolidation Breakout
Timeframe - Daily
Volume - Very Good volume
Cmp - 1191
Target - 1836
SL - 976
Here’s a summary of Jubilant Pharmova Ltd’s Q1 FY25 results:
Financial Highlights
Net Profit: Jubilant Pharmova reported a net profit of INR 482.10 crore, a substantial increase from INR 6.40 crore in the same quarter last year1.
Revenue: The total revenue for the quarter was INR 1,731.70 crore, up by 9.12% YoY1.
Operating Profit: Operating profit surged to INR 556.70 crore, a remarkable 596.75% increase YoY1.
Operational Highlights
Operating Margin: The operating margin improved significantly to 32.15%, up by 538.49% YoY1.
Expenses: Total operating expenses decreased by 33.13% QoQ to INR 1,175 crore1.
Comparative Performance
Quarter-over-Quarter: Compared to the previous quarter, revenue grew by 3.2%, and net profit increased by 5.6%1.
Outlook
The strong performance in Q1 indicates a positive trend for the rest of the fiscal year, driven by robust revenue growth and improved operational efficiency.

SBICARD - WILL IT RETEST ITS BREAKOUT OR NOT ?SBI Cards And Payment Services Ltd. an interesting chart with Harmonic Pattern under progress
1. Narrowing Bollinger Bands on Weekly chart and price started moving on upper band last week
2. Break out from base formation after 8-9 month's consolidation within 680 - 750 levels.
3. Daily and Weekly RSI above 60
4. Next minor resistance between 830-870 zones
A chart to keen on radar and to watch
Will it RETEST its breakout levels or
Will it complete its pattern journey without any RETEST
Lets see How it evolves.
Disclaimer: NOT A BUY / SELL RECOMMENDATION I am not an expert I just share interesting charts here for educational purpose and not to be taken as buy/sell recommendation. Please seek expert opinion before investing and trading as trading/ investing in market is subject to market risks. I do not hold any position in the stock as on date but I may look to buy on dips with my own Risk Reward matrix.

LAOPALA - Consolidation or box breakout - Breakout - DailyLa Opala RG is a leading manufacturer and marketer of tablewares (opal and glass) in India.
LAOPALA - Consolidation or box - Breakout - Daily
Name - LAOPALA
Pattern - Consolidation or box breakout
Timeframe - Daily
Volume - Very Good
Cmp - 359
Target - 407
SL - 351
Always welcome for any comments with your feedback or give it a like if you find it useful.
