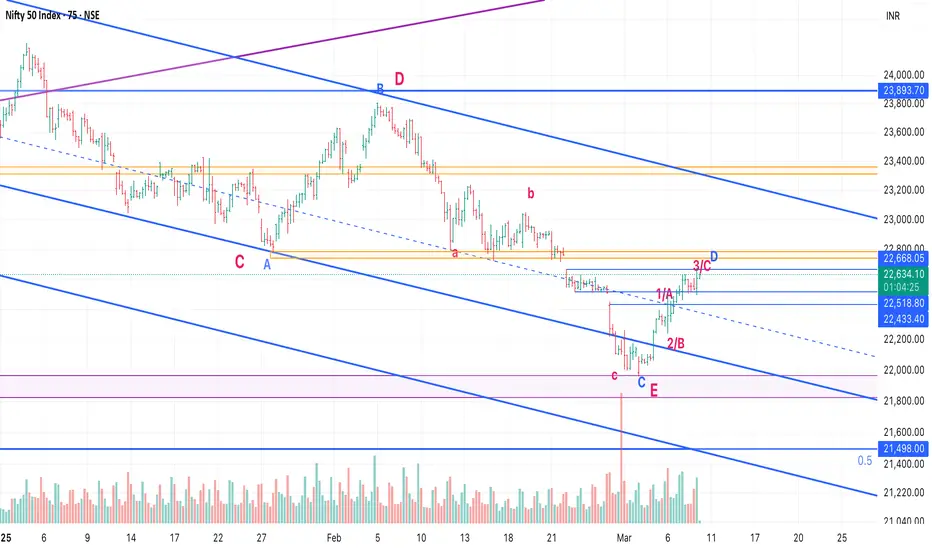
Nifty - EW Update - Time to be lightABC up from recent low seems to be done.
Also, we are in the range from where price had gapped down and broken last time
So, it's time to be cautious. If we make another leg up, then we have 5 up which will be good and we can start taking longs on the next retracement.
However, if we turn from here, we are going lower in E of E to 21500 or so.
Contains IO script
GOLD chart analysis for Friday 10 March Session 15M TFI've looked the gold chart in every timeframe and figured out some level's and zone to rely on it for this session last closing was at 2909 due to which we've got our nearest support zone of 2907 - 2902 and after that a level of 2996 is the support below it no support for the day range until 2880 and if we talk about resistance zone's and level's 2916 - 2919 is the resistance zone and after that 2927 - 2930 is the next resistance zone after it next level is ATH of resistance , we've to look for reversal and continuation pattern's at the zone's and level's before entering in any trade because in daily TF the formation of Doji candle occur's ,so watchout the pattern's carefully before entering and SL is above or below the zone's according to the trade.
in.tradingview.com

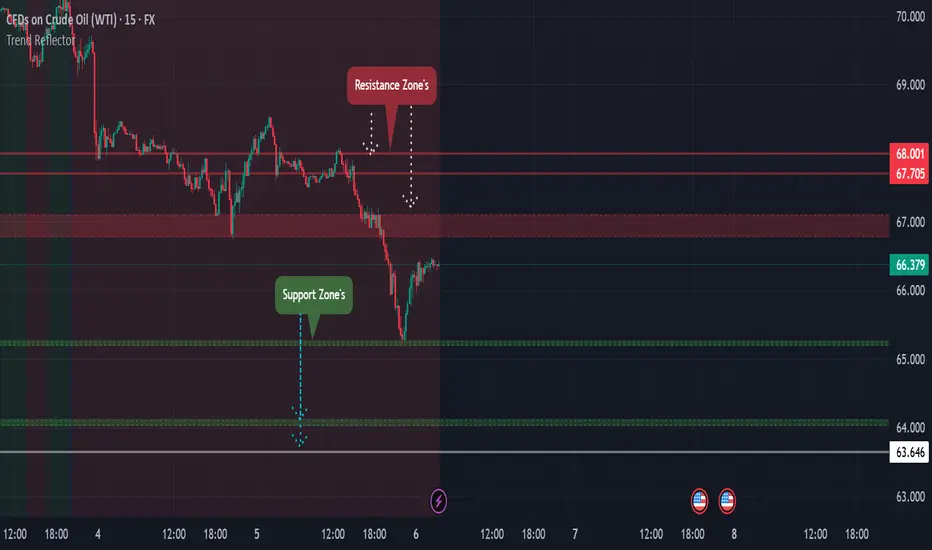
USOIL Trade IDEA for upcoming session of Monday 15M TFOn looking at the chart of USOIL in higher TF's i've figured out some imp and key levels and zones to focus on last session it closed at 67.019 and if we look on price movement then our next resistance zone is 67.465 - 67.560 after that we get the next zone which is 68.100 - 68.215 which is the last session approx high and after this we can get new resistance zone of 68.550 - 68.600 if we talk about support then nearest support is 66.757 - 66.589 and after that we can get new support at 68.250 - 68.085 then next support is 65.616 , while looking at the chart in every TF's i think crude may head for higher price for some session's because it get rejection on weekly and daily TF and it also showed bullish scenario in my self made indicator , i've given all the imp level's wait for resistance breakout and place SL below resistance low ( alternative and safe method is to wait for retesting then enter) if price goes downward's then wait for reversal pattern's then enter and place SL below support low , wait for price to show some reversal or continuation pattern before entering.
in.tradingview.com
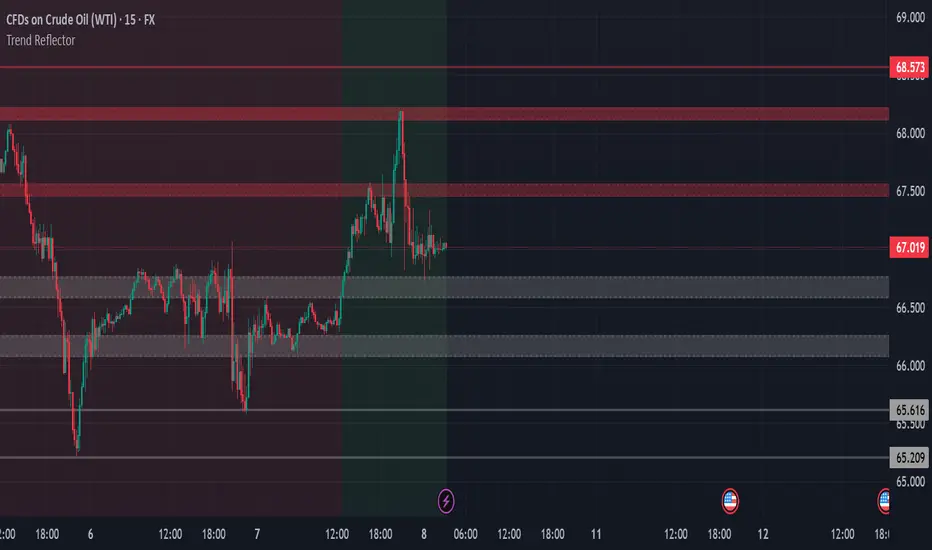
USOIL chart pattern for upcoming session of Thursday 15M TFIn the last session USOIL closed at 66.379 (2.4%) down and made of low of 65.208 , i've looked the chart on every TF and i've figured out some important levels of the crude ,on looking at the closing and price action formed our Near and major resistance zone is 66.795 - 67.090 this is a big zone but major zone and after that we've got the next resistance at 67.705 and the next one is 68.000 -68.105 , while looking at the chart in higher TF now market is going to compress or outburst for alternative scenario we've got some support zone's 65.259 - 65.200 is the level of support zone and it's also almost the low level of last session after that next support we've got on looking at every TF is 64.040 - 64.140 and after that 63.646 is the level which hold's some support , these are the level's which i got while studying the chart until new one is formed so we've to very clear here watch out every zone and level and look how price react's to it i've already told you how to trade in rejection and continuation pattern in our previous idea's ( and yeah sorry for typing mistake of level's and zone's in last USOIL idea published ) and i request every follower to avoid trading in news time ,now let's see how market react's on these levels.
GOLD chart pattern for upcoming session of Thursday 15M TFi've looked chart in every TF and figured out some level's for the thursday session's , gold closed at 2928 in the last sessioon and nearest resistance is 2930 -2934 and above it the resistance is 2952 - 2953 which is the ATH and nearest support (first) is 2913 - 2910 and below it the next support (second) is 2896 - 2893 and below it the third support zone of 2871 - 2864 , looking at the closing i think between first support and resistance is no trade zone , if price form some reversal and continuation pattern then we've to enter only and should place our place above or below the zone's respective to our trade position ( short or long ) , look for patterns at the zone's , let's see how market react's to these pattern .

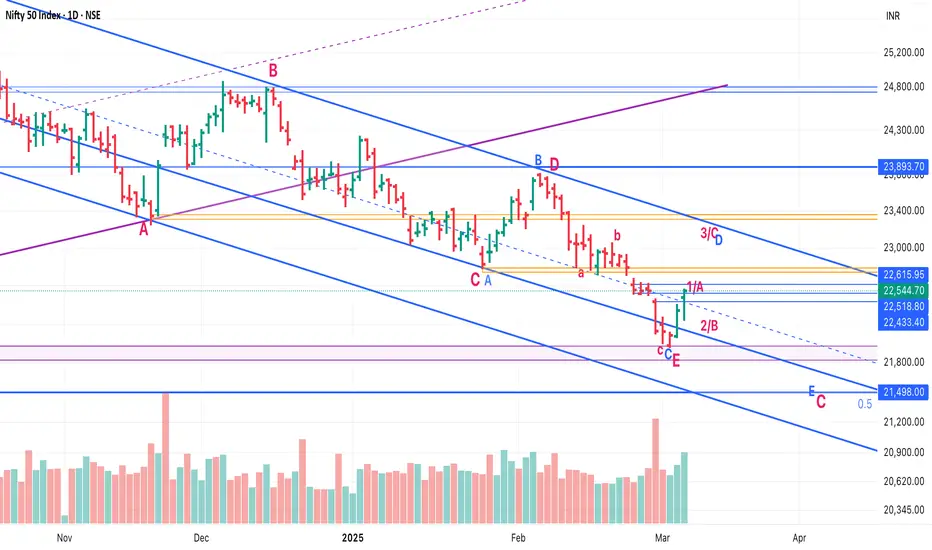
Nifty EW UpdateSo we had a good 2 days of upside.
I am changing the possibilities a bit:
1. Possibility 1 (Red): We are in larger Triangle (ABCDE - Red) E done and we have made a bottom. Wave 1 of next leg up seems done, we should expect a 2 now.
2. Possibility 2 (Blue): We are in a Larger ABC (Red) and C is further an ED (ABCDE - Blue).
In that case the leg up of last 2 days was an A.
We should expect a B down (22200-250) and C up (22800, 23050) which will complete D.
Post that, we will have a E of Red C down, mostly till 21500, 21200.
Still hoping red one holds, but no one knows. :)
GOLD chart analysis for Wednesday session 15M TFOn looking at price movement and candlestick pattern on every TF i've figured out some zone's for wednesday session , according to closing price of gold it first resistance zone is 2927-2932 and next major resistance is 2952-2956 and if we talk about support then we've got the nearest support as 2909-2904 and follwing to it next support is 2895-2890 and 3rd support is 2883-2878 , price should come to second support sone and it should work as pullback zone from there price should make a upside move first support can also work as pullback zone but i think it's not strong as 2nd one , we should follow clear and simple approach watch out every zone look for price raction at zone if price make reversal signs at support then go for upside trade and place SL below support if it break's support with continuation pattern then short for next support in case of resistance short if reversal occurs buy if continuation occurs after continuation buy it in retesting for better risk management place sl below resistance.

USOIL Trade IDEA for upcoming session of Wednesday 15M TFOn looking at the chart of crudeoil on all timeframe i've figured out some levels to watch for today
S1 Zone - 69.680-69.700 ( represented as white line in chart ).
S2 Zone - 69.420-69.470
one of these zones should work as reversal zone of the instrument from there price should take rejection and should move to upside breaking of these zone's we should watch for the price reaction on 66.740-66.950 if this zone also breaks then we can see the levels of 65.500 til this level there is no support for now until new one create's.
and the Resistance Zone's are -68.480-68.620 if this level is breaked then look for 69.000-69.100 level and also on this level breaking price should reach 70.000.
Look for price reaction on every level and zone watch how it reacts to zone's and levels if rejection occurs then place trade according to that if continuation occurs then place trade according to that ( on breakout or breakdown it's good to place trade on retesting for better and safe trade's ,let's see how price react's.

Nifty EW UpdateConfusion remains:
Either bottom done in an ABC in E
OR it's just 3rd wave in C3 done and 4th going on.
Crossing 22800 should give confidence that it's not C3, and we could have made a bottom.
All in all, stocks are doing well, Metals, PSEs, Capital goods etc are already breaking above the levels they were at when Nifty was at 23k.

Nifty - Elliot Waves UpdateWe are in a confusing situation right now.
Possibility 1 (in red): We are in an ED and E of ED got done in ABC
Possibility 2 (in blue): Larger C is going on and only 3 of C3 is done - We can head till 20500 (even lower) in this case.
In both cases we are either at bottom or within 5% of it. However, upside is big - at least 23500.
One good thing is that we recovered after a gap down in last 2 days, especially when US markets fell quite sharply yesterday.
Wait and watch time for traders. Deploy cash time for investors :)

USOIL Trade IDEA for upcoming session of Monday While looking at the candlestick pattern's and price movement of USOIL looks like there is no change in Support and Resistance zone's as shown in my last session idea but i'll mention levels again and also show them in chart 70.106 - 70.634 is no trade zone but a zone displayed by orange color 70.500-70.600 is resistance zone this zone is the good resistance zone price fall from this zone in the previous session and surprisingly for the upcoming session of monday it formed tweezer top ( Equal High ) in 15min TF highlighted by circle in chart so price should fall from this level and SL should be above Orange zone and we will follow the target levels as shown in chart as support levels alternative scenario is if our SL is triggered then we will wait for the price to go above 70.634 and closely watch it's price movement if it sustain above it then we will go for upside trade and target should be 71.676-71.976 zone highlighted in the chart .

GOLD chart analysis for Monday session 15M TFGold (XAUUSD) price closed at 2857 level in the last session after studying it in all time frame we've figured out some level's of it 2863 - 2868 is the nearest resistance zone and after that next resistance zone is 2877 - 2882 and 2853 is the nearest support level and after that next support is 2832.59 we will go simple here this time look for reversal or continuos pattern on the zones and level's and make trade placement according to them i'll follow my signal generation and trend direction indicator to place my trade , and here i've told you the levels which should work very well , be focused on candlestick pattern to get the best trade's.

NIFTY Nifty formed head and shoulder patern on Left chart (daily time frame) right chart (weekly time frame)


BTC Technical Reversal Signals EmergeFrom the supply and demand structure analysis of VSH (volume spread histogram), the current technical side of the BTC market has initially shown a reversal signal. The core logic of VSH is to identify the direction of intervention of the main funds through the relationship between price fluctuations and trading volume, and the recent K-line structure has shown typical supply contraction and demand-led transformation characteristics.
At the daily level, when BTC tested the key support band below many times before, the trading volume showed a step-by-step decay, indicating that the short selling pressure was gradually exhausted. During the price drop, the K-line entity narrowed and was accompanied by a long lower shadow, reflecting the continued strengthening of the low-level carrying power. Especially in the recent narrow range shock stage, there have been many single-day large-volume positive lines that broke through local resistance, and the trading volume shrank rapidly during the callback, forming a classic reversal structure of "high demand and low supply". This phenomenon of volume-price divergence verifies that the market chips are shifting from weak hands to strong hands.
What is more noteworthy is that the weekly VSH histogram shows that the current price range has shown a "supply test failure" signal for three consecutive weeks: when the shorts tried to suppress the price, they encountered a strong counterattack from the buyers, but the trading volume did not increase simultaneously, indicating that the main funds did not actively distribute at this position. At the same time, the price volatility index has been compressed to the lowest point of the year, and the market has formed a compact bottom structure after sufficient turnover, which usually indicates that the medium- and long-term change window is approaching.
From the perspective of supply and demand balance, the current market has entered the "re-accumulation stage". The main funds cleaned up the floating chips through repeated shocks, and the green demand column of VSH began to appear densely below the key price center, while the red supply column showed a discrete distribution and decreasing momentum. This structural transformation of supply and demand forces means that the market has gradually digested the pressure of the upper locked-in disk, laying a technical foundation for the trend reversal. When the demand expansion finally breaks through the supply critical point, a new round of trend market may officially start

Bearish Outlook on the Dollar IndexBearish Outlook on the Dollar Index: Supply Zone Resistance Signals a Reversal
The Dollar Index (DXY), a widely watched measure of the U.S. dollar’s strength against a basket of major currencies, is a pivotal indicator in global financial markets. Viewed through the lens of a long-term supply-demand structural cycle, the index appears to be approaching a turning point. It is currently testing a critical supply zone, suggesting that its recent upward momentum may be faltering. This article explores why a bearish outlook is warranted, drawing on technical analysis, fundamental factors, and market sentiment to argue that a reversal could be imminent.
Technical Analysis: Supply Zone as a Formidable Barrier
In technical analysis, a supply zone represents a region where selling pressure has historically overwhelmed buying interest, acting as a ceiling that limits upward price movement. On longer-term charts, such as weekly or monthly timeframes, the Dollar Index is now encountering such a zone. This area has consistently halted past rallies, with the index struggling to maintain gains before retreating. As it approaches this level again, early signs of hesitation—such as declining volume and weaker upward momentum—are becoming apparent. These patterns suggest that the current uptrend may not have the strength to push through, increasing the likelihood of a downward correction.
Fundamentals: Economic Dynamics Undermine Dollar Strength
The fundamental backdrop also supports a bearish view. Since mid-2024, the Federal Reserve has begun lowering interest rates, a shift that reduces the yield advantage of U.S. assets over time. While markets may have priced in some short-term effects, the sustained impact of lower rates weakens the dollar’s appeal relative to other currencies. If other major central banks adopt or maintain tighter monetary policies, capital could shift toward alternatives like the euro or yen. Additionally, changing global trade dynamics and rising geopolitical uncertainties may drive investors toward traditional safe-haven assets like gold, rather than the dollar. Together, these factors limit the dollar’s potential for further gains.
Market Sentiment: Overbought Conditions Hint at Reversal
Market sentiment provides another layer of evidence for a bearish turn. Recent reports indicate that speculative bets on a rising dollar have reached unusually high levels, reflecting widespread optimism among traders. However, such extreme positioning often serves as a contrarian signal, foreshadowing a potential reversal—especially when the index is stalling at a supply zone. Should the dollar fail to break through this resistance, a cascade of profit-taking and triggered stop-loss orders could amplify downward pressure, hastening a decline.
Conclusion: A Bearish Turn Looms for the Dollar
In summary, the Dollar Index’s current position at a key supply zone, coupled with technical resistance, fading fundamental support, and overstretched market sentiment, points to an impending reversal. Investors should stay alert as the index navigates this critical juncture. A failure to sustain its upward trajectory could mark the start of a bearish phase, opening up new possibilities in currency and asset markets.

USOIL Trade Idea (Zones) for Friday session 28-02-25After studying USOIL at higher TF and watching it's closing price i think 70.106 - 70.634 is No-trade zone for USOIL due to it's complexity at higher timeframe , i've also drawn a zone which can push price to downward direction which is represesnted by orange color in the chart if price sustained above this level then it can go to it's next resistance zone of 76.500 - 76.600 but here SL should be below the zone which is 70.106 and the zone itself is mutual in multiple timeframe so be cautious to trade in this zone and use manage Quantity , and for alternative scenario if price goes below 70.106 and sustained then we can see then 69.150 level because it was the last swing created and below it other levels are also mentioned in the chart , look for reversal and continuation pattern to enter in trade .

GOLD Trade Idea (Zones) for Friday session of 28-02-25We've got some level's to watch out for this instruments to trade on friday 2881.04 - 2882.55 is the minor Resistance zone highlighted as orange zone in the chart if price goes beyond this and sustained then it will go to it's next resistance zone which is 2889 - 2895 this resistance zone can push price to downward direction look for reversal pattern at this zone and put SL above this zone minor resistance can also cause price to go downward so look for reversal signs to short it minor support level of gold is 2867 - 2868 from here it can for some swing if this price breaked then we can get 2860 - 2854 level , so watch it carefully for the good trade.

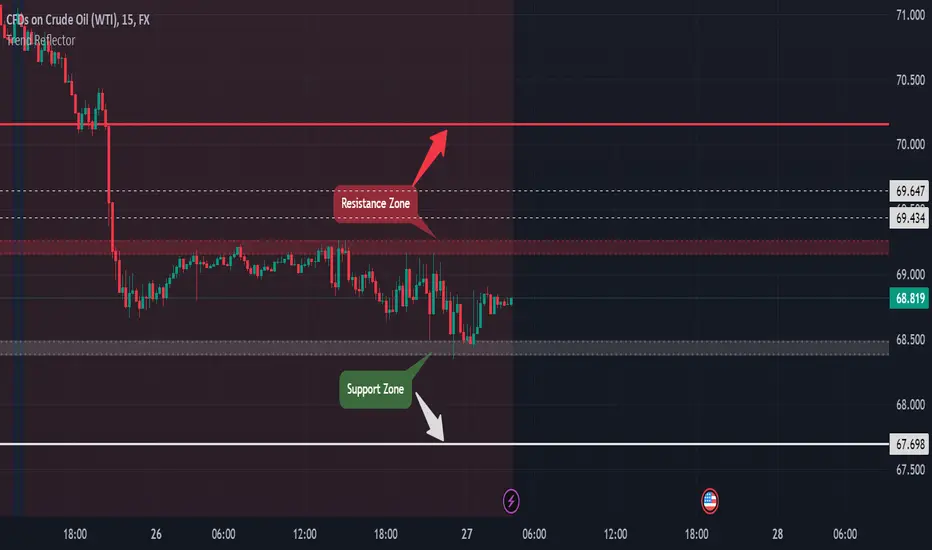
USOIL Trade IDEA for upcoming session's of Thu & FridayClosing of the last session of USOIL occurs at 68.819 and after looking at every timeframe and the price action concludes the support and resistance zone's for the upcoming session's as we look in chart next support zone 68.380 - 68.486 if price goes below this level then wait for minor retesting and short for 67.700 level which is next support this is because in higher TF picture show's downtrend ( but in lower TF retesting occurs ) for alternative scenario's if price goes upward then 69.155-69.270 is the next and strong resistance zone at this place look for reversal pattern this would be the zone from where price drop ( but 69.430-69.630 is minor reversal range shown as dotted lines in the chart which can cause reversal if price surpases the first resistance zone ) if price breaks these zones then take a buy for next resistance zone of 70.000 - 70.100 but it seems price drop of the USOIL for these session's let's see what will happen .
Nifty 50 - Elliot Wave UpdateHere are the scenarios (ignore technical details (as I can post only one chart per post)
Possibility 1: ED in E of E - 22400 should be low
Possibility 2: C started in E - Can go till 22000 - 22250
Possibility 3: C1, C2 done C3 going on - This will be bad. - 21600 possible
Tomorrow (Friday, Feb 28) is a crucial day for us to get the answer.
Tracking Nifty 500 (currently at 20315) will give a better picture.
Why? Because it was holding above the previous low, while Nifty had broken. This was giving the confidence that Nifty is divergent and forming a bottom, and we should head up after Feb expiry.
So, here’s what we need to track in Nifty 500 (today’s close: 20315)
If we turn before 20130 - We'll go up till 22300-500
If we break 20130, then we'll first go down to 19300-500, and then recover to 21500-700
Best would be today’s closing becomes the bottom, and we have a +1% green day tomorrow - breaking 20550 tomorrow is important (20 month moving average).
Let's see what the market has in store!

XAUUSD TRADE Idea for Thursday and Friday Session'sGold seems like some Range bound and little confusing but looking at each different TF we've got some levels for it to get trades near minor support is 2911 if it breaks then next major support zone is 2906 - 2909 may be we can see some ranging market from these level but if it breaks then next level's we can see is 2890 alternative scenario is if price goes upward then 2918 - 2920 is resistance if price crossed this level and sustained then it will go 2930 - 2933 level easily but also look for reversal patterns at these level it can work good in this instrument, all level's and zone plotted in the chart from there you can grab it .

$AMZN - Possible Inverse Head & Shoulders NASDAQ:AMZN - Possible Inverse Head & Shoulders - Measured Move $225 which lines up with 200 SMA (yellow line). Let's see if we can get a breakout.

$AMZN Forming a Bullish Hammer Candle and Oversold on the DailyNASDAQ:AMZN forming a Bullish Hammer candle on the Daily and oversold right. It's right under 100 SMA (white line) let's see if we can get a bounce here and break back above. I was happy to see it finish the day green after being down 2% on the day.
