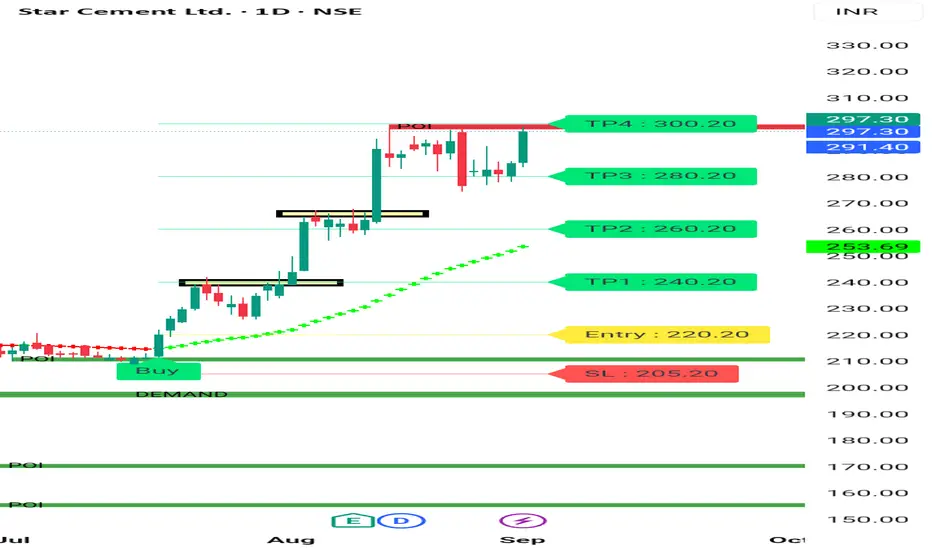
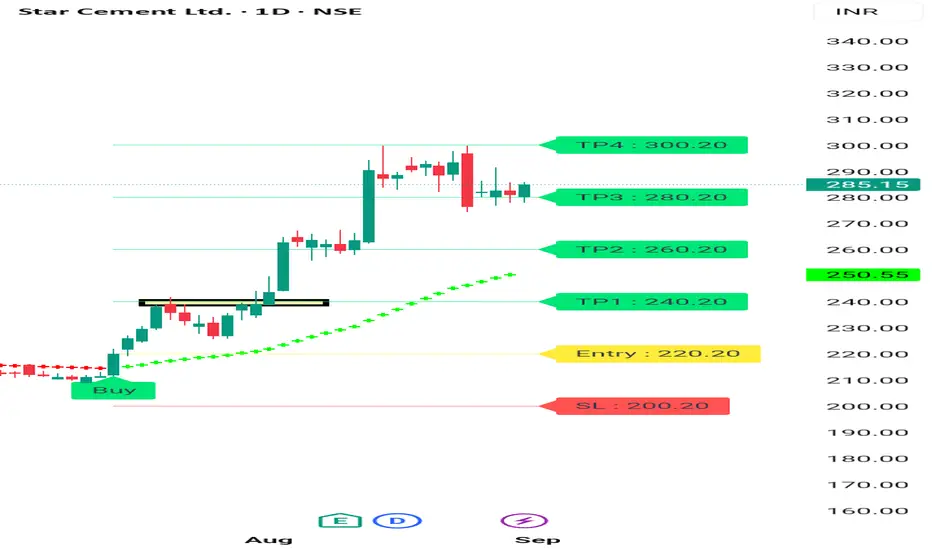
STAR CEMENT BREAKOUT/ Bullish Structure Star cement is good Stock fundamentally as well as Technicaly. It's moved from 220 to 297 . It's moving in a pattern you can see in chart . Now again it's at breakout level of its give movement above 300 then again 4 -5% move may give very fast . It's a high Momentum Stocks.
About company
Star Cements Ltd is engaged in manufacturing and selling of Cement Clinker & Cement. It sells its products across north-eastern and eastern states in India. It is the largest cement manufacturer in North-east India.
Key Points for star cement
Product Offerings
Ordinary portland cement (OPC), Portland Pozzolana cement(PPC), Anti-rust cement (ARC), Portland Composite Cement (PCC) and Weather Shield Cement (WSC)
Market Share
The company is the largest cement player in North-east India with ~24% market share. Star Cement has one of the finest limestone reserves.
Business-wise Sales
In Q1FY23, trade sales (sales to distributors & dealers) accounted for 86% of revenues while non-trade sales (sales to direct customers) accounted for the remaining 14% revenues.
Manufacturing Capabilities
Co. has 6 manufacturing facilities out of which 3 are situated in Meghalaya and 2 in Assam and 1 in West Bengal. The production capacities are as follows -
Clinker: 2.8 MTPA
Cement: 5.7 MTPA
Power: 51 MW & 12.3MW WHRS
The company plans to take cement capacity
to ~10MTPA by FY26.
Improvement in Capacity Utilization
The capacity utilization of the clinkerisation units was at ~86% during the FY22 as against ~75% during FY21.
Capex Plans
The company plans to expand:
A 3.3 MTPA clinker unit with 10 MW WHRS at
Lumshnong for ~Rs. 1,300 Cr.
B Two grinding units and 800 TPD AAC block
plant in Assam for ~Rs 950 Cr.
C 24 MW Captive solar power plant in
Guwahati, Assam for ~Rs 110 Cr.
Contains IO script
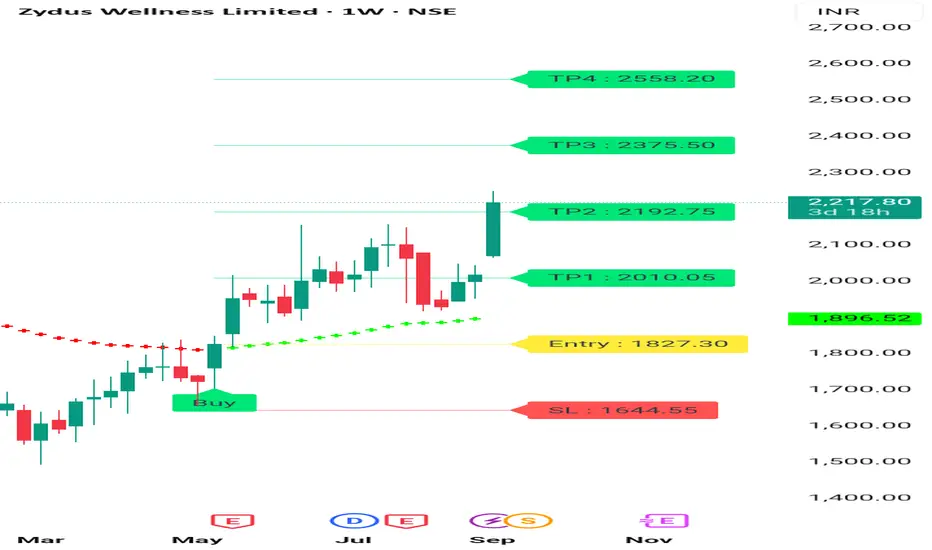
ZYDUS Wellness Weekly Chart Zydus wellness Given Good movement on Acquisition. Zydus wellness Given Weekly breakout, it's forming Rounding Pattern . Next tgt may be 2450 + 2500 in next 3 -6 months. Consult your financial advisor before making any position in this stock .
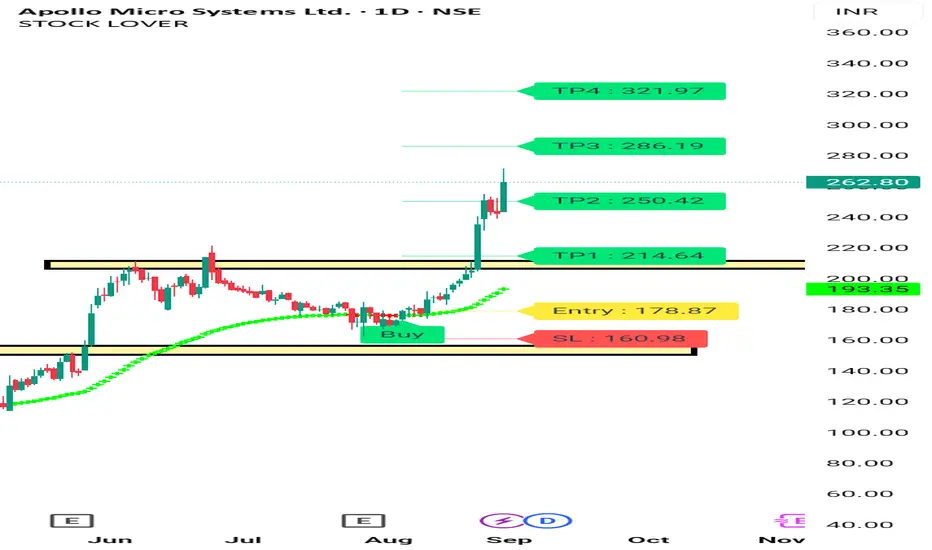
APOLLO MICRO SYSTEM BULLISH CHART APOLLO micro system chart posted on tradingview on 24 Aug , it's moved 12% Since then. It's win a order . Chart Shows u movement before news . Keep Following Us and Enjoy. For More, watch my Profile.
Consult your financial advisor before making any position in stock market. My all views are for educational purposes only.
Godfry Philips Double Every Year Godfrey Philips is Such a Wonderful Stocks its Getting Double Every Year in last 4 Year . It's Given more than 80% CAGR IN LAST 5 year u can Check it's CAGR on Screener . No buy sell Reccomendation. My Views is for Educational purposes only. Consult your financial advisor before making any position in stock market.
For more information Check my Profile. Thanks 👍

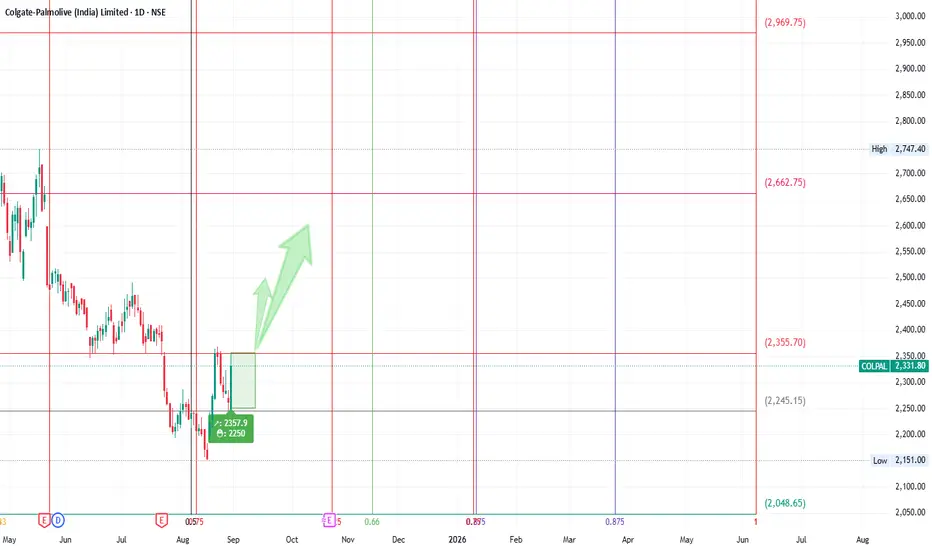
Colpal AnalysisIts quite long time Colpal is falling from 3764 all time high. Now i can see a bounce from this level as per Gann system. My indicator has also gave a buy signal. But I am waiting for a price to close above 2360. Then i can see immediate target 2400,2500,2570,2600
STAR CEMENT BULLISH Structure Start Cement Showing Good Strength on 1 Day Chart. Be Can See Star Cement given breakout and moving up in a higher high Pattern. It's a good sign that stock Still in Upper Range in this Falling market.
Consult your financial advisor before making any position in stock market. It's not my buy sell Reccomendation. My views are for educational purposes only.
Apollo Micro Systems Good Breakout Appollo Micro Systems given 12% Since my last post on Apollo Micro Systems. It's in bullish Uptrend. Keep Follow for more update and watch my profile. Thanks 👍
Nifty 24500 Sell Signal Nifty Falled Good From 24800. Nifty now at crucial Level at 24500 Round number and in over sold zone also. Nifty may Be in a zone before next move today . Let see what will happen .

Xau USD 15 min Chart I posted last time Xau USD chart when price was 3406 . Now U can check It's given good move . U can check my old post of Xau USD . It's good movement by Xau USD but now Risk Reward is not good. Let be take retracement.

Xau USD 15 min Bullish Chart Xau USD is bullish on 15 min Chart entry given on 3395 now 3407 is running, a small hurdle near 3310 -11 if crossed then good move possible. My views are for educational purposes only. No buy sell Reccomendation. Consult your financial advisor before making any position in stock market / Crypto/ Forex market .

Nifty 24700 put Nifty 24700 put given good move today . We Was Bearish On nifty from 26 Aug and Today again good movement. Now We have covered Nifty Pe. Nifty Show Good Support at 24500 . Let us see what will happen Further. Thanks 👍

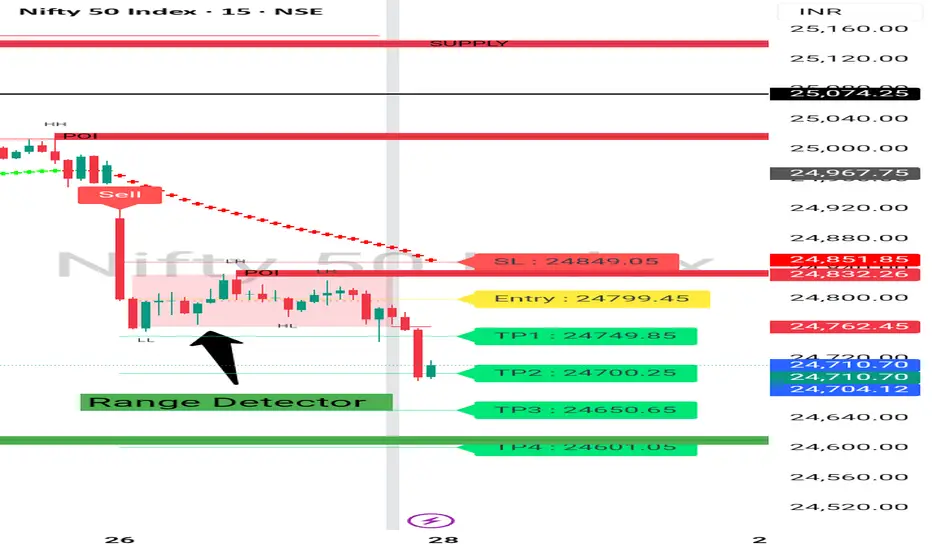
Nifty May Be a Range Today It's my Views , Nifty may be in a Range .
Nifty already given good move Before expiry on news . Now nifty may cosolidate in Range. Upside 24850 Lower Side 24650 as per OI data .Oi of 24700 Put also more . So 24700 also a good Support .Nifty expiry may be in between 24850 - 24650 . Thanks 👍
Nifty 24900 Put Movement on 26 Aug . Now Consolidation Possible This is Nifty 24900 put 15 min Chart . It's given moved already. Today on 28 Aug Nifty may Dance in a Range . So be Cautious . Market likes uncertainty but now all knows it's movement. So nifty fall may be or may not be . Thanks 👍

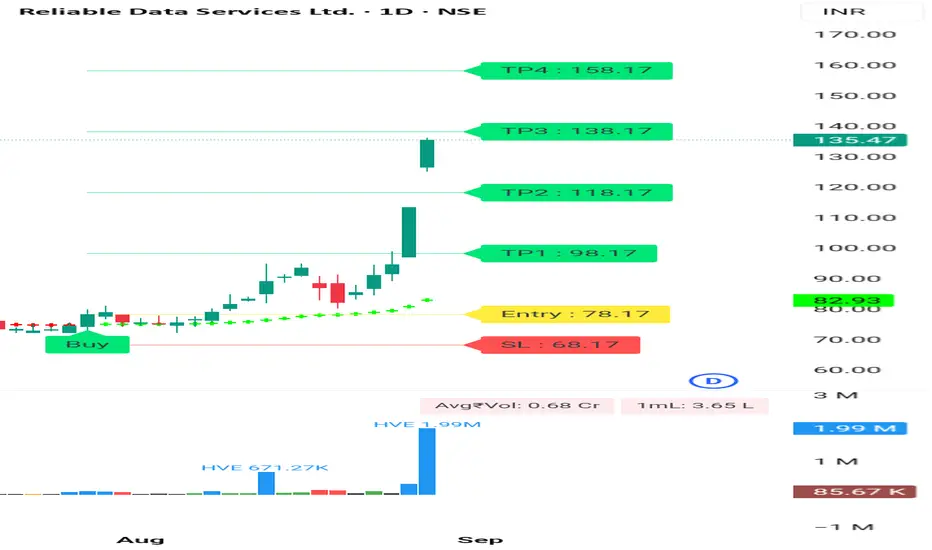
Reliable Bullish Chart Reliable Given Bullish Movement With Highest Ever Volume Some Days back .its making Higher High Daily basis. Now Wait For Retracement as Stock Already given Good move . How to Catch Such Stock Is very Important. Consult Your Financial Advisor Before Making any position in stock market.
Force motor bullish Structure - Higher Lows Force motor is very good company in auto sector . It's in uptrend, high Momentum Stocks. It's Showing Strength after every Retracement. You can see this after retracement.

LONG ETH for 5000$ETH showing signs of Inside bar on daily timeframe. LONG here for a 5000$+ target.

Eclerx weekly breakout This stock in uptrend . This given breakout on weekly & daily time frame. It's good buy for 5 -10% Swing Trading movement. It's in uptrend. Keep stoploss of 5% . Consult your financial advisor before making any position in stock market. My all views are for educational purposes only.

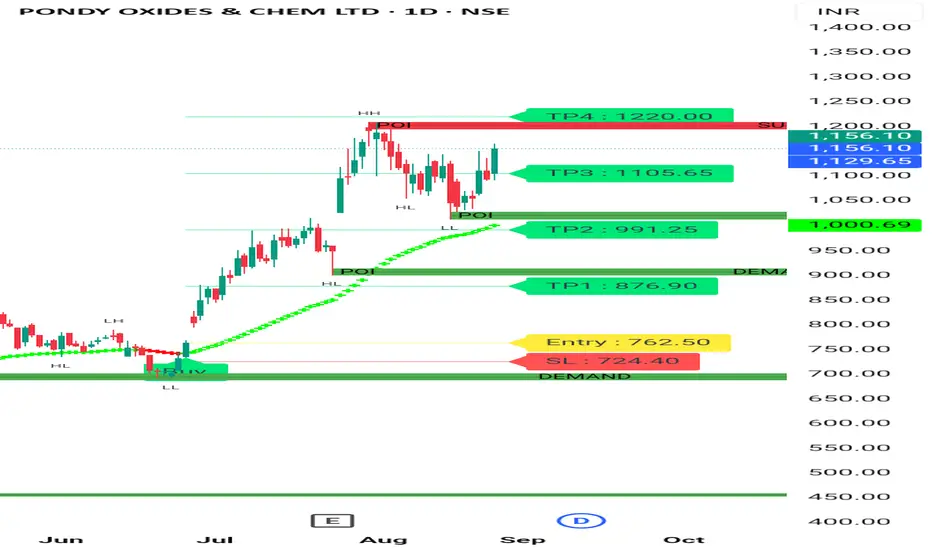
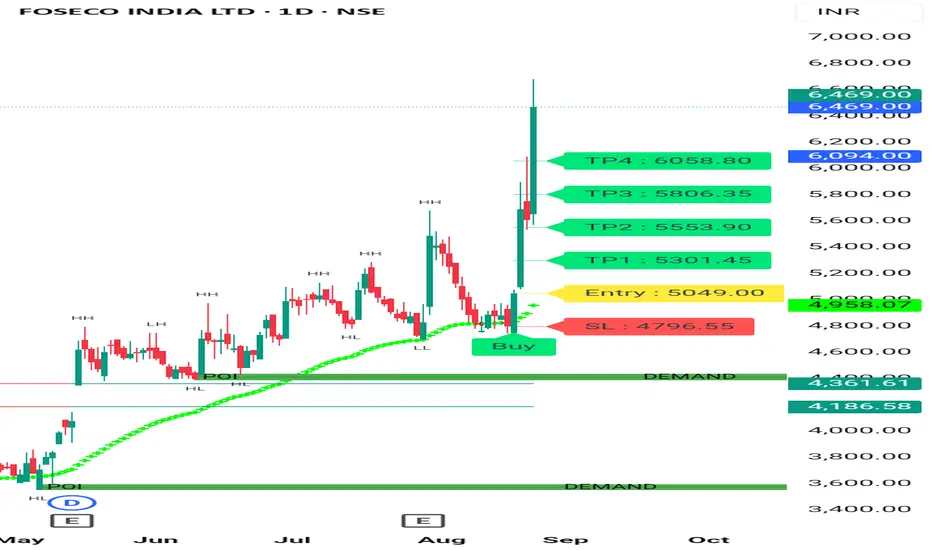
POCL BULLISH CHART Pocl Showing Strength with Demand zone at Bottom.
POCL is in the metallic and non-metallic recycling industry as India’s largest secondary Lead manufacturer in Lead Alloys. Its core product, lead and lead alloys, is mainly used in making lead-acid batteries. Company converts scraps of various forms of Lead, Aluminium, and Copper into Lead Metal, Aluminium Metal, Copper, and its Alloys. It carries out smelting of Lead Battery scrap to produce secondary lead metal, which is further transformed into Pure lead and Specific Lead Alloys. Further, company also manufactures Zinc metal and Zinc Oxide
Pondy Oxides & Chemicals Ltd
About
Incorporated in 1995, Pondy Oxides and Chemicals Ltd manufactures Lead Metal and Alloys and other Non-ferrous metals
Key Points
Business Overview:
POCL is in the metallic and non-metallic recycling industry as India’s largest secondary Lead manufacturer in Lead Alloys. Its core product, lead and lead alloys, is mainly used in making lead-acid batteries. Company converts scraps of various forms of Lead, Aluminium, and Copper into Lead Metal, Aluminium Metal, Copper, and its Alloys. It carries out smelting of Lead Battery scrap to produce secondary lead metal, which is further transformed into Pure lead and Specific Lead Alloys. Further, company also manufactures Zinc metal and Zinc Oxide
Product Portfolio
a) Lead: The company offers Pure Lead, Lead Calcium Alloys, Lead Tin Alloys, Lead Antimony Alloys, Lead Master Alloys, and Specialty Alloys. These products primarily serve Lead Acid Battery and other battery OEMs, with 56% of sales in export markets.
b) Plastics: The portfolio includes PPCP, ABS, HDPE, LDPE, PC, PPH, Nylon 6, Nylon 66, and other industrial plastics. These materials are widely used in automobiles, appliances, furniture, paints, battery OEMs, and electronics, catering entirely to the domestic market.
c) Copper: The company supplies Clove, Cobra, Mill Berry, Grease Mill Berry, and Tin Mill Berry, mainly for copper wire and other copper applications. With 80% of its sales driven by exports, it maintains a strong global presence.
d) Aluminium: Offering ADC Series (JIS Standard), LM Series (BS Standard), and custom-made alloys, the company caters exclusively to the domestic automobile industry, ensuring high-quality material supply.
Manufacturing Facility
** Unit 1 - Lead Smelter Division I, Tamil Nadu; Capacity: 48,000 MTPA
Unit 2 - Smelter Division II, Andhra Pradesh; Lead Capacity: 84,000 MTPA and Copper Capacity: 6,000 MTPA
Unit 3 - Aluminium Division, Tamil Nadu; Capacity: 12,000 MTPA
Unit 4 - Plastics Division, Tamil Nadu; Capacity: 9,000 MTPA
Unit 5** - TKD Lead Division (Work in Progress), Tamil Nadu; Phase 1 & 2: 72,000 MTPA (36,000 MTPA each)
Overall Capacity - Product wise
Lead: 132,000 MTPA
Plastics: 9,000 MTPA
Copper: 6,000 MTPA
Aluminium: 12,000 MTPA
Global Presence
The company has a global presence across 20+ countries, supported by 270+ overseas suppliers. It serves key international markets, including Asia, Europe, the Middle East, and North America.
Production Volume - 9MFY24 vs 9MFY25
Lead Production: 50,954 MT -> 68,041 MT
Lead Sales: 50,906 MT → 67,577 MT
MoU:
POCL has entered a memorandum of understanding with the government of Tamil Nadu for building recycling plants in the state.
Clientele:
Amara Raja Batteries Ltd, Sebang Global Battery Company Ltd, and Glencore International AG
Geographical Revenue Split - FY24:
Exports ~57%, Domestic ~43%
Acquisition:
On March 4th 2024, company acquired Industrial land parcel of 122.65 acres at Mundra, Gujarat, with a total investment of Rs. 41.40 Crores
CAPEX and QIP
The company invested 70 Crs in 9MFY25 for capacity expansion and operational enhancements. Additionally, it raised 175 Crs through QIP to fund further working capital & expansion plans.
Capacity Expansion
The company is nearing completion of Phase 1 of its lead capacity expansion, adding 36,000 MTPA, with trial production set for March 2025. The total planned expansion across Phase 1 & 2 is 72,000 MTPA, increasing total lead capacity to 204,000 MTPA from the current 132,000 MTPA.
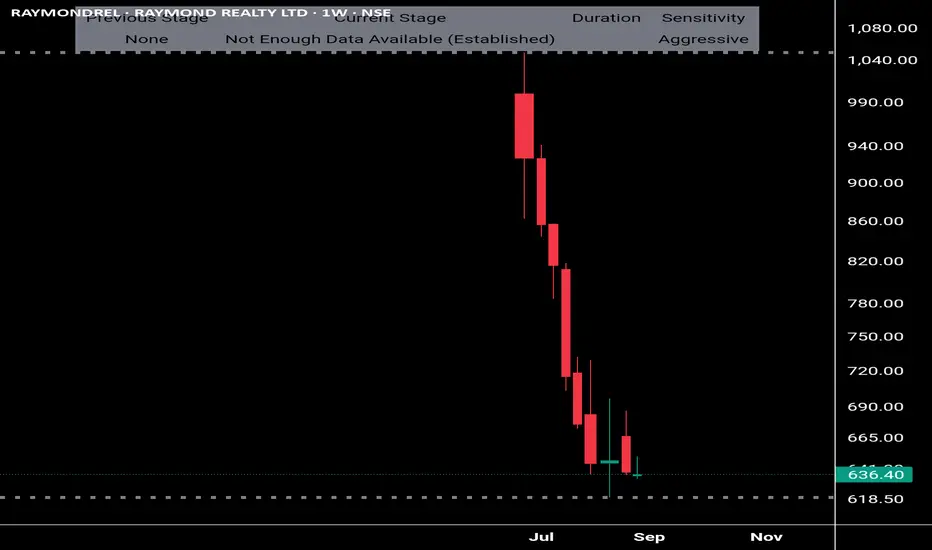
Raymond Realty - finding support at current levels1. Newly listed, demerged real estate entity of Raymond Group.
2. Seems undervalued; likely due to forced selling post demerger.
3. Technical data for last few weeks suggests bottom formation.
Bit Coin Sell tradeBit coin became bearish after giving break down of Golden Reversal level . we were expecting it to reverse from Golden Reversal to continue Bullish moment ,
Bit coin instead gave break down of Golden reversal and become bearsish from golden reversal 900 points done .. target 1 and target 2 are marked on the chart . by mistake i post very big sl .. the sl here is 115850

Xau USD Gold 15 min Chart Xau USD gold Chart - given good return yesterday in buy side. Buy was near 3321 with SL . U can see all in chart . Demand zone was at bottom. Now it's in a Range as u can see. If range is broke up or down , we can see trade . Thanks 🙏

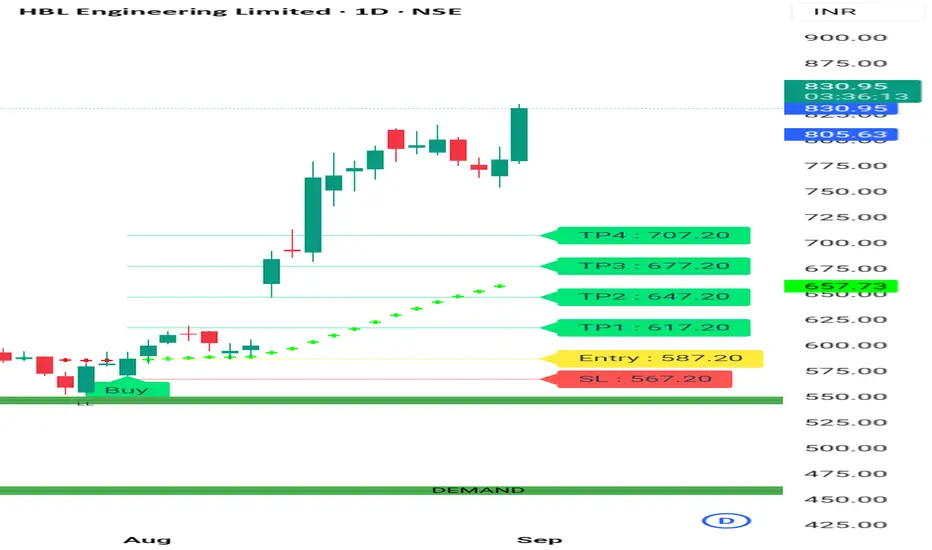
1 Day Chart This in uptrend. It's moving In a pattern Higher High pattern. It's a good healthy sign . Price moved good in last 1 week . Now wait for retracement. No buy sell Reccomendation. Consult your financial advisor before making any position in stock market. Thanks 🙏 follow & share
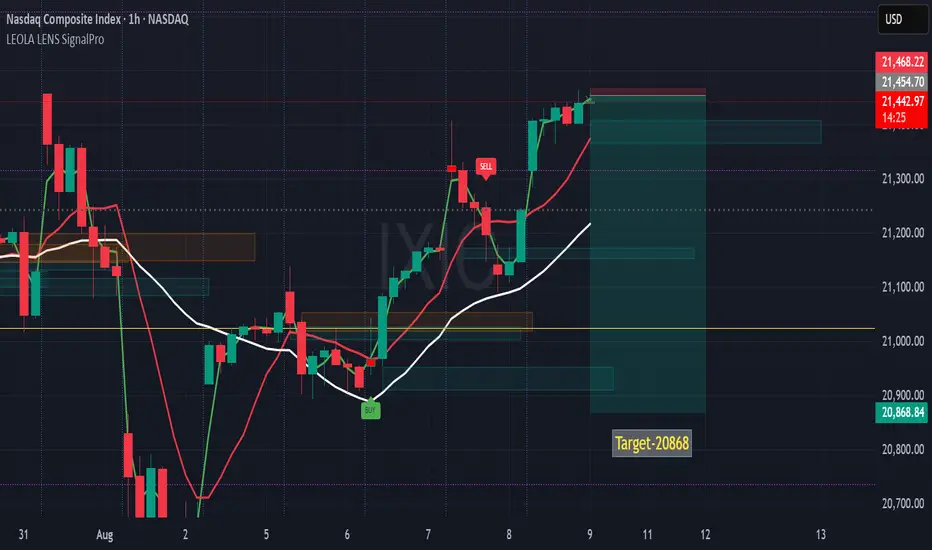
NASDAQ Composite (IXIC)- 1hr Reversal Setup Targeting 20,868This 1-hour chart shows a potential short-term reversal on the NASDAQ Composite, identified using Leola Lens SignalPro.
🔍 Technical Notes:
🟢 Price recently tested the upper red supply zone near 21,454, where prior SELL pressure emerged.
⚪ The white trendline (mid-term bias) is still below price, suggesting a test of resilience before reversal.
🔴 Multiple rejections near the supply zone may hint at exhaustion of buying momentum.
📉 Target: 20,868 — aligning with a prior structural pivot and liquidity zone.
🟡 Watch for confirmation via lower timeframe breakdowns before any continuation lower.
The setup reflects a possible supply-zone reaction after an extended rally, with a measured move toward a lower support zone.
⚠️ Disclaimer:
This analysis is for educational purposes only and should not be taken as financial advice. Always do your own research and consult a licensed financial advisor before making any trading decisions.