Nifty 15 chart Nifty given breakdown below 25000, on 5 min Chart good fall . If nifty closed below 25k today then it's shown weakness . Be cautious. No buy sell Reccomendation. Its for educational purposes only. Take carefully Fed meeting is in USA.
Contains IO script

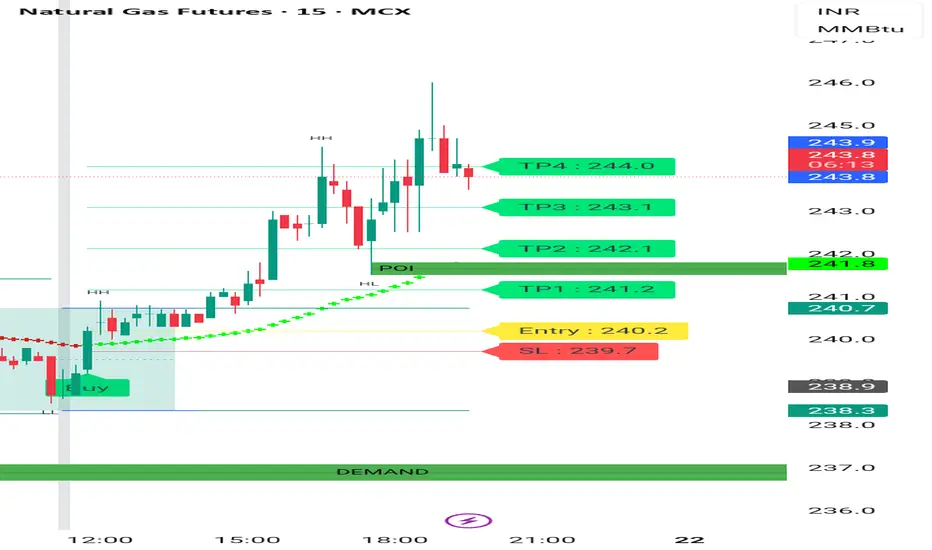
Natural gas 15 min Chart Natural gas 15 min Chart shows good strength. It's moving up with demand zone . Cmp 243. It may move further up . No buy sell Reccomendation. It's for educational purposes only. Consult your financial advisor before making any position in stock market. Stock market is risky .
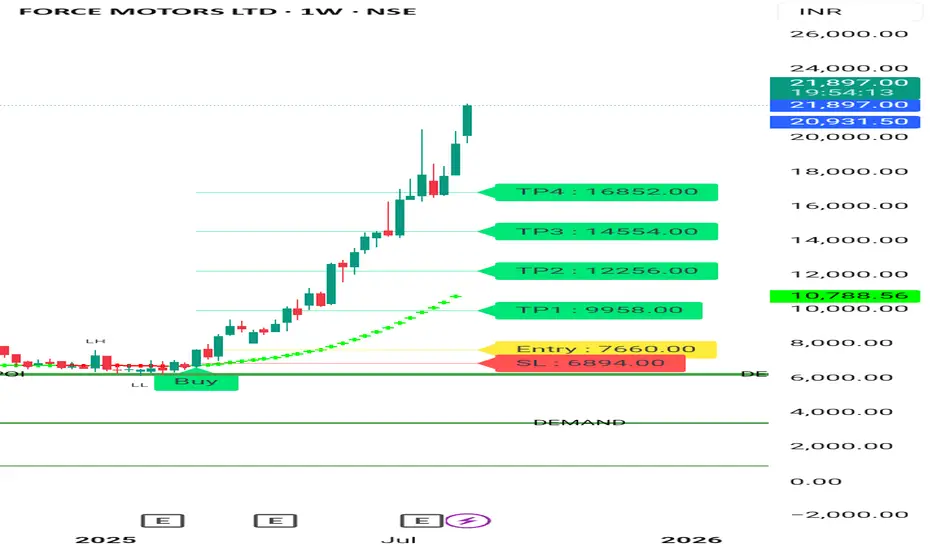
FORCE MOTOR 1 DAY CHART Force motor 1 Day Chart Shows Good Strength with Demands Zones at Bottom, Gst cut by Govt Fuled Auto sector it's moved good . It's a good buy on Retracement. Like and Share . Thanks . No buy sell Reccomendation. It's for educational purposes only.
silver can be broughtsilver is at liquidity seweep level, silver can be brought sl below zone 3 mins candle closing target upper liquidity sweep


crude oil can be soldcrude can be sold . crude is taking rejection from liquidity sweep sl above liquidity sweep . target lower liquidity level .

Nifty can be soldNifty is taking rejection from liquidity sweep level . it can be sold for sl 24090 target 24950/ 24800
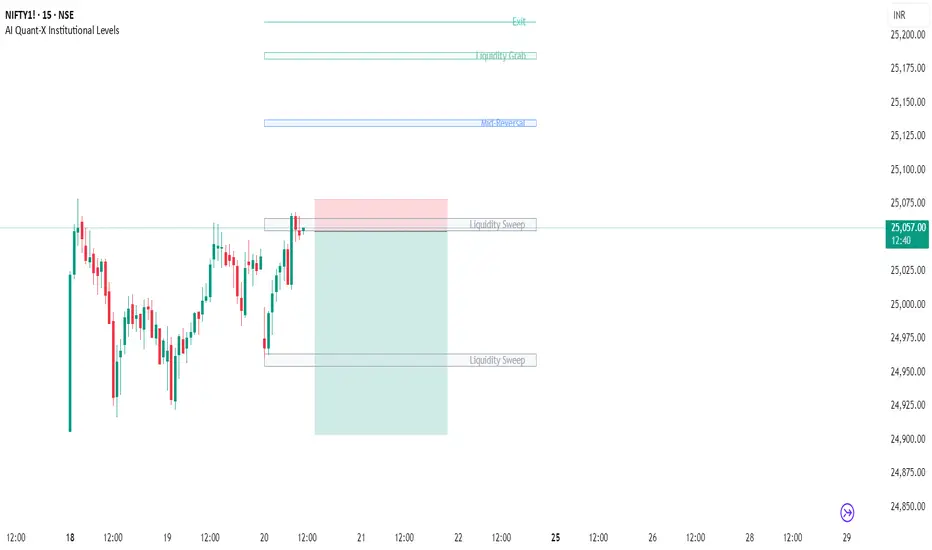
Nifty50 Intraday Rebound-Sets Eyes For Long 🔍 Key Observations:
✅ A fresh Buy label has printed after a series of lower lows — suggesting potential momentum shift.
🔴 Previous Sell cluster accurately marked the swing high near 25,145 zone.
⚪ Price is still trading below the 200 EMA, but attempting to reclaim short-term trendlines.
🟫 Minor Liquidity Box indicates supply pressure ahead, aligning with previous structure resistance.
📊 Risk-to-reward suggests the move could extend towards 25,145.35, if price holds above 24,707.
🎯 Setup Summary:
Bias: Cautiously bullish, short-term retracement within broader downtrend
Target Zone: 25,145 – matching previous support turned resistance
Invalidation: Below 24,647 where recent demand may fail
🧠 Educational Insight:
This setup highlights a classic counter-trend bounce from oversold levels, often seen when market participants begin profit-taking or short-covering. Momentum confirmation is crucial beyond the red zone to validate follow-through.
⏱ Timeframe:
15-Minute (Intraday)

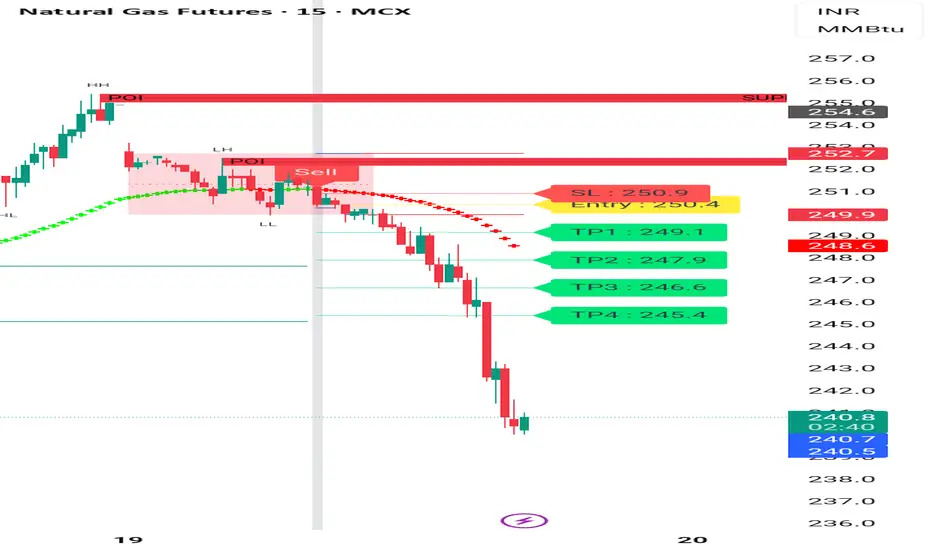
Ng shoryed with indicator at 250 . Now 240 Ng shoryed with indicator at 250 . Now 240 . natural followed our set up. And good opportunity to sell at 250 with set up .
EURUSD-Possible Reversal Forming After Extended DowntrendEURUSD has been in a strong downtrend, consistently respecting the short-term and long-term EMAs.
Recent Buy signals from SignalPro have appeared at the base, showing early signs of buyer interest.
The most recent Sell signal failed to continue the move lower — suggesting momentum may be fading.
🔍 Setup Structure:
Entry Zone: Watching for confirmation above 1.15510 (EMA breakout + structure shift)
Stop Loss: Below 1.15199 (beneath local swing low)
Target Area: 1.17224 — aligned with previous inefficiency and potential liquidity magnet
⚙️ SignalPro Insights:
Yellow caution zone (if it appears next) often precedes higher-probability directional changes.
Multiple signals have triggered near historical demand zones — aligning with possible institutional activity.
⚠️ This chart and analysis are for educational purposes only. Not financial advice. Past performance does not guarantee future results. Always conduct your own analysis and manage risk accordingly.

ETHUSD-Potential Reversal Eyes LongETHUSD declined into a previously tested support zone, triggering a new Buy signal from SignalPro.
Price is currently attempting to reclaim short-term structure but remains under EMA resistance.
The recent Sell signal failed to create a lower low, potentially signaling bearish exhaustion.
🔍 Educational Setup Observation:
Reclaim Zone: Near 3,790.00
Stop Reference: Below 3,744.71 (beneath structural low)
Target Zone: 4,223.47 — aligned with prior imbalance and resistance from previous high-volume node
If price can decisively reclaim above EMAs, momentum shift may accelerate.
⚠️ This analysis is for educational purposes only. It does not constitute financial advice. Always do your own analysis and apply proper risk management.

BTCUSD-Eyes on Bullish PullbackPrice action formed a clean pullback into prior support after an earlier rally.
Multiple Buy signals have appeared at the lows, with the latest near a previous Liquidity Control Box.
The yellow caution label triggered near the top earlier, signaling possible short-term exhaustion — now invalidated as price re-approaches structure.
🔍 Trade Structure (Educational Reference):
Observed Entry Zone: Near 117,840 after reclaiming short-term EMA
Stop Level: Below 117,379 (beneath structure low)
Potential Target: 121,102 — aligns with higher timeframe imbalance and previous untested levels
🧠 SignalPro Notes:
The earlier Sell signals followed by failed downside continuation show weakening bearish control.
EMA realignment in progress — continued strength above white EMA could accelerate momentum.
⚠️ This chart and analysis are for educational purposes only. It is not financial advice. Please perform your own analysis and manage risk carefully.

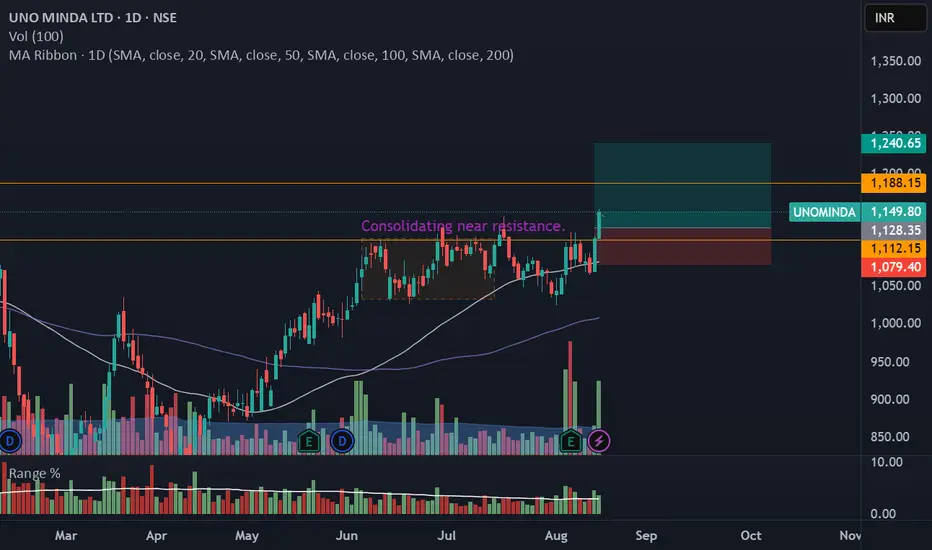
UNOMINDA – Daily Timeframe Breakout Idea (Resistance Zone Break)UNO MINDA LTD. has shown a breakout above a key horizontal resistance level on the daily chart, accompanied by a nearly 1.5 times volume surge near the breakout, as seen earlier, supported by strong momentum.
🔍 Breakout Context:
- Price broke above the ~₹1110 and 1120 horizontal resistance, which had held for over 6 months.
- Breakout supported by more than average volume and just above average range near the resistance zone.
- The price is also trading above both the 50- and 100-day SMAs, indicating strong trend continuation.
- This aligns with a bullish continuation setup.
📉 Trade Plan:
- CMP: ₹1149
- Entry: Near ₹1128
- Target: ₹1240 (~10% upside from CMP)
- Stop-Loss: ₹1079 (Closing Candle)
- Risk-Reward Ratio: ~1 : 2.2
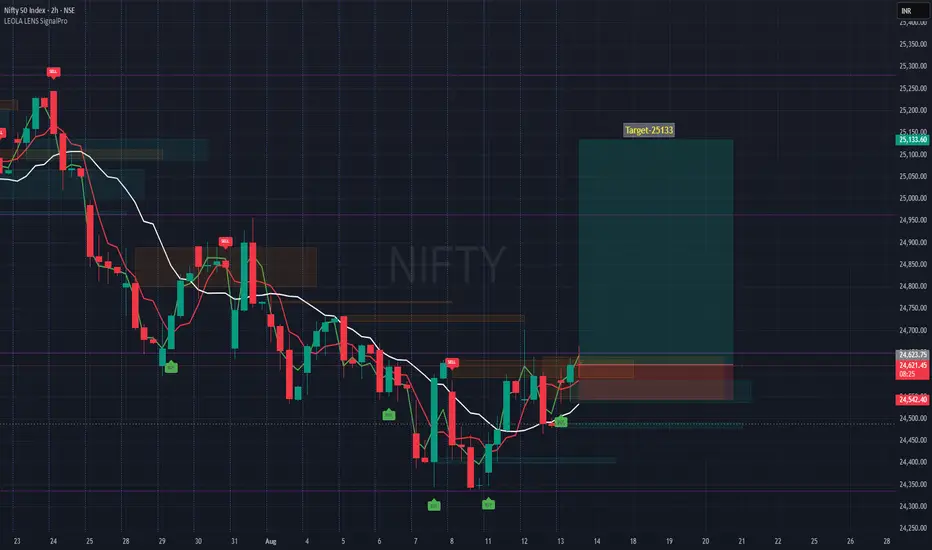
NIFTY Eyes Long on 25133- Bullish Breakout WatchTimeframe: 2-hour (H2)
Entry Zone: Around current breakout level of 24,619
Target: 25,133 – aligns with a prior reaction high and measured move projection from recent swing range.
Stop-Loss: 24,542 – just below the most recent higher low, protecting the setup if momentum fails.
Reasoning:
Price has been forming higher lows since August 7, indicating gradual strength building.
Moving averages have turned upward, confirming short-term trend change.
Previous sell-side liquidity zones have been cleared, reducing overhead resistance until the 25,133 area.
Volume profile shows a gap zone between 24,650 and 25,100, often filled quickly in trending conditions.
Risk Management:
This is a swing-style setup within an ongoing uptrend on the lower timeframe but still needs confirmation from follow-through buying.
Disclaimer:
This chart is for educational discussion only and does not constitute financial advice or a recommendation to trade. Markets carry risk, and decisions should be based on your own analysis and risk tolerance.
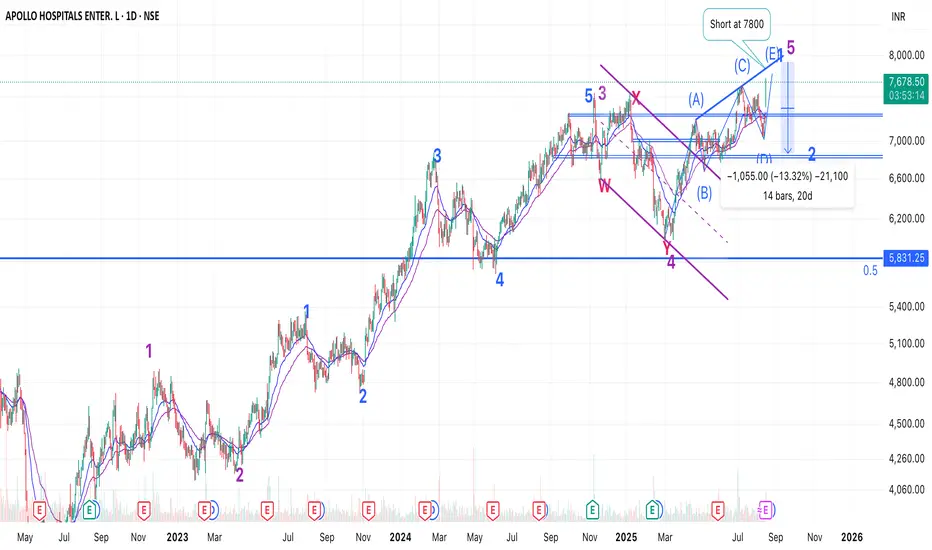
Apollo Hospital - Elliot Wave Counts - ShortApollo has been an out-performer in the entire correction phase.
However, just like many other Pharma stocks - which outperformed but are now topping out, Apollo Hospital is also about to complete 5 up in an ED.
Check Divis for reference:
Now, weather this 5 up completes just one more from the March 2025 lows or the entire upmove from May 2022 lows remains to be seen.
In both cases, we should get a decent 8-10% pullback.
Buy trade in Crude .crude can be brought from the shared levels . Proper Entry sl and targets are market . this levels . Today as per liquidity sweeep levels plotted by our indicator we are expecting and uptrend in crude . These levels are as per XTI USD charts.

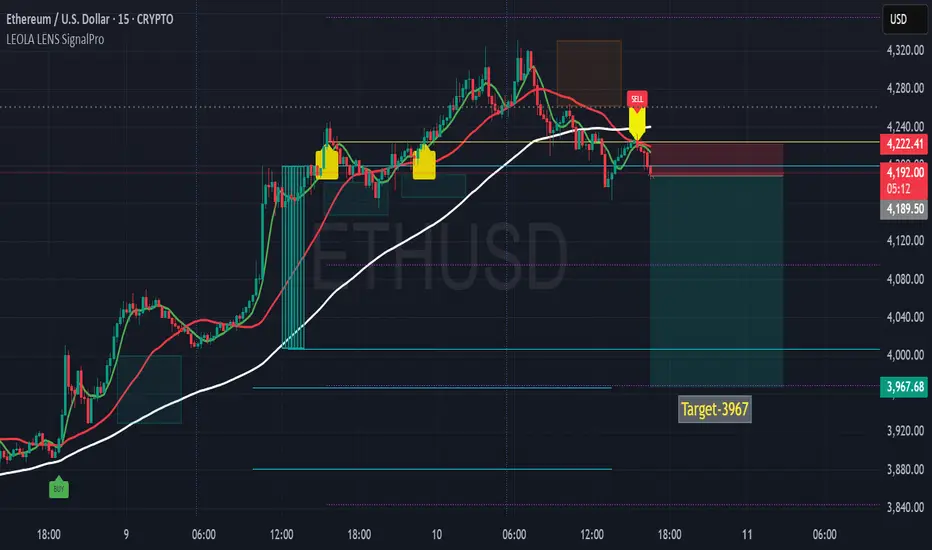
ETHUSD-15MIN SHORT Setup After Supply RejectionThis chart highlights a potential short trade opportunity on ETHUSD following rejection at the overhead supply zone.
Technical Notes:
Yellow caution markers signaled earlier high-probability trend shift points.
Price tested the zone near 4,240, where prior selling pressure emerged.
The recent SELL marker aligned with a break below the moving average, confirming bearish bias.
Liquidity levels below remain untested, offering a possible draw toward the 3,967 target.
Stop-loss placed above recent highs to maintain favorable risk-to-reward.
Bias: Bearish toward target area unless price reclaims and sustains above supply zone.
Disclaimer: This analysis is for educational purposes only and does not constitute financial advice. Trading and investing involve risk, and past performance is not indicative of future results. Always conduct your own research before making trading decisions.
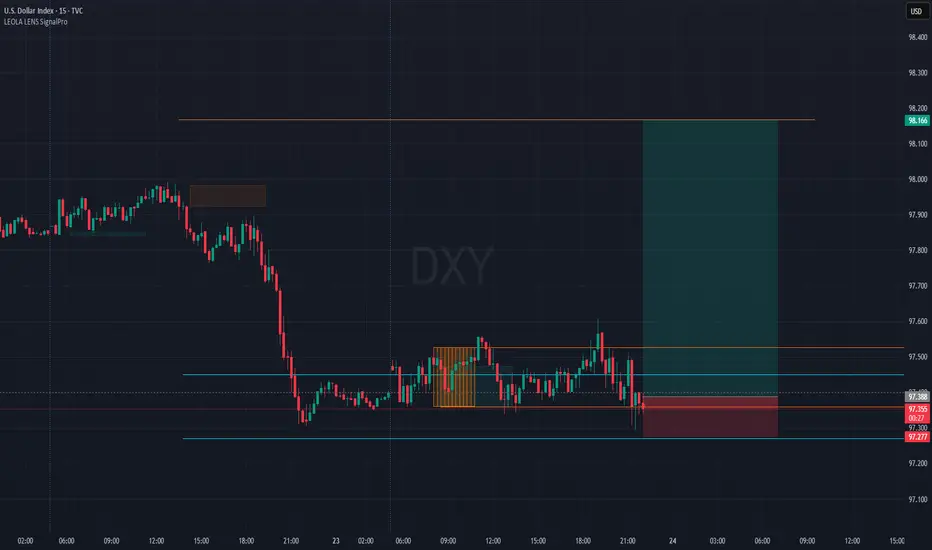
DXY Range Break Attempt- Can the Dollar Regain Control?DXY showing signs of life after an extended sideways compression near key structure lows.
Price reacting from SignalPro’s Liquidity Control Zone, hinting at possible bullish shift.
📈 Long setup framed with:
Retest of lower zone holding above 97.28
Targeting upper imbalance toward 98.166
🟧 Previous caution label reflected indecision phase – now resolving with fresh push attempt.
Key Technical View:
🔹 Tight range breakdown rejected, forming potential bear trap
🔹 SignalPro highlights entry zone clarity and risk-defined setup
🔹 Bullish continuation scenario valid above demand zone hold
🧠 Chart for learning purposes only.
📊 Tool: Leola Lens SignalPro | ⏱ Timeframe: 15m
ETHUSD EYES FOR LONG - Intraday ViewThis 15-minute chart on ETHUSD highlights a potential structure-aware reversal zone, guided by Leola Lens SignalPro overlays and trend context.
🔍 Technical Structure Highlights:
🟡 Caution Labels Active — Market is transitioning with signs of indecision. High-probability trend change zones are being tested.
🔻 Price remains below both the adaptive red and white base trendlines, signaling bearish pressure is still dominant.
🟥 Recent SELL signal held well, driving price lower into the Liquidity Control Box, which has now acted as a local support area.
🟢 Multiple attempts to reclaim structure are visible — but the price is still trading under key compression zone near $3,513.
🔁 What to Watch:
A clean break and hold above $3,513 could indicate a potential squeeze toward the $3,600–$3,720 zone.
Rejection from current levels could retest the base support near $3,455 or lower if trend resumes.
🧠 This chart is a visual study of structure, momentum, and reaction using Leola Lens SignalPro tools. All views are for educational purposes only. Trade safe.
#ETHUSD #Crypto #Ethereum #LeolaLens #PriceAction #SmartContext

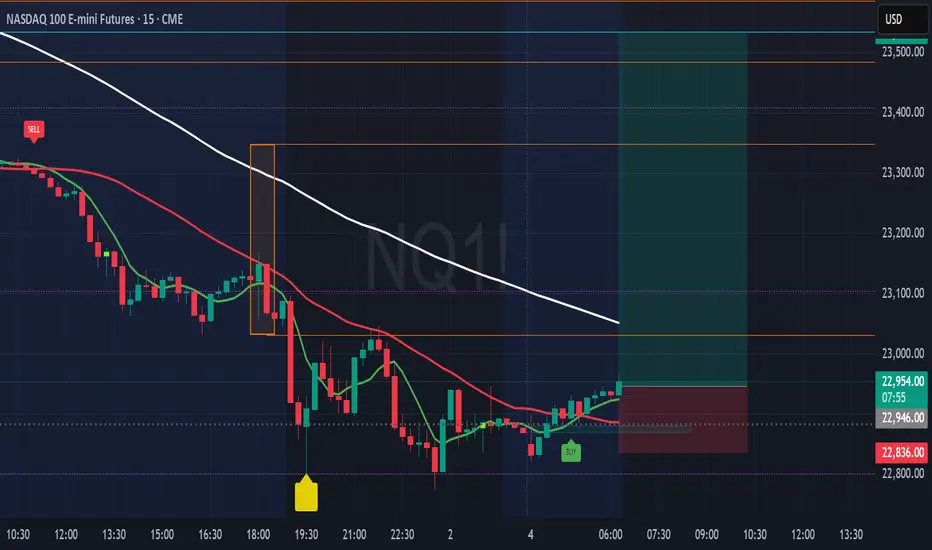
NQ100 - Eyes Long Towards 23531📌 NQ100 Futures 15-min — Buy Signal After Momentum Exhaustion & Trap Zone
Technical Structure Insights (15m):
🟡 A caution label printed near the evening session, highlighting a potential trap zone after short-term buyers were absorbed near the white moving average (trend resistance).
🔻 Price broke lower, completing a strong impulse leg to the downside.
🟢 BUY Signal has since appeared after price based out near 22,830 — coinciding with the purple reaction line.
📈 Current price is climbing back toward dynamic resistance levels (red and white moving averages).
🔍 Price must reclaim and sustain above 23,000 for upward continuation to remain structurally valid.
Otherwise, this may evolve into a lower high setup within the broader trend context.
Disclaimer: This chart is for educational purposes only and does not constitute financial advice. Always perform your own analysis and manage your trading risk responsibly
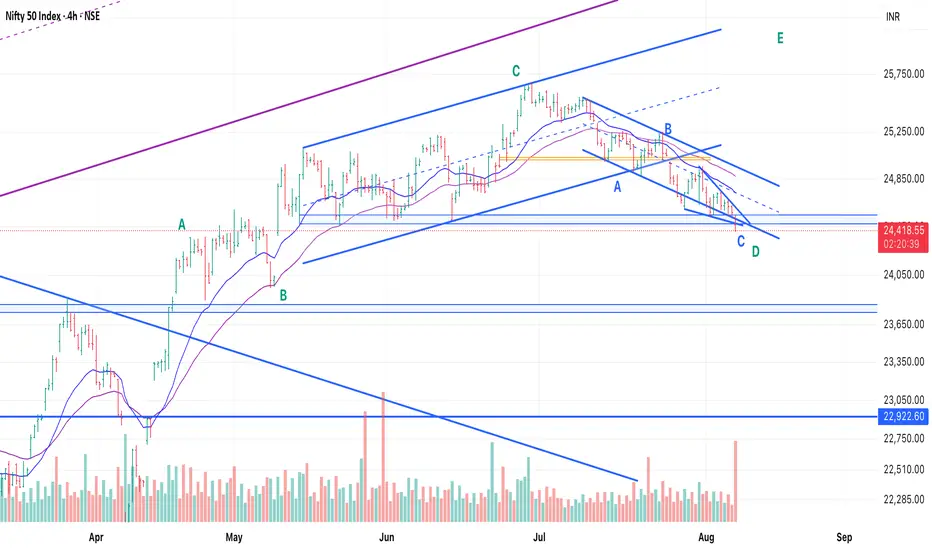
Nifty - Elliot Waves Counts - LongLooking for bottom everyday, as broader markets indicating one more high.
Aligning Nifty counts with broader markets - We have an ABC with C ending in an ED - If it has to turn and head up to another high, this is the time.
Wait for one green day for confirmation.
Level at which view goes wrong - If 24320 breaks on the downside.
All the best!
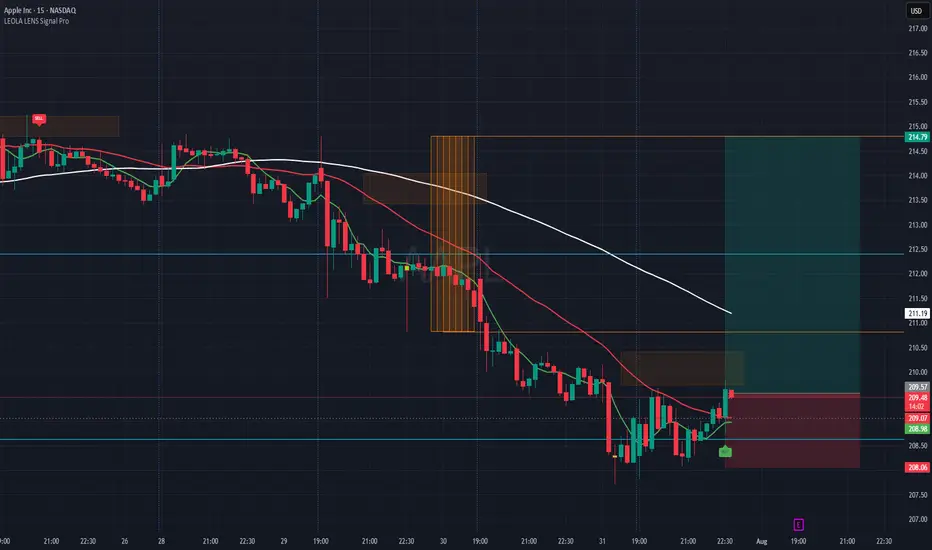
AAPL-Reaction Setup Lower Structure Zone-Eyes LongThis chart captures a structure-aware buy setup on Apple Inc. (AAPL), using Leola Lens SignalPro with momentum overlays and risk visualization.
What the Chart Shows:
🟢 A new BUY label appeared after price tapped a previously marked liquidity zone.
📉 Prior bearish momentum exhausted near 208.50–208.90 area — forming a potential base.
🟥 Overhead resistance is clearly defined, aligning with a recent rejection block and moving average confluence.
✅ A well-defined Risk:Reward setup is plotted — aiming for continuation toward 214.79, with risk below 208.06.
Key Levels to Monitor:
🔺 Break and hold above 210.50 could shift bias toward bullish continuation.
⚠️ Failure to hold above 209.00 could invalidate the current intraday structure.
This view is for educational purposes only — illustrating how price reacts around structure, liquidity, and confirmation signals.
Nifty - Elliot Waves - Short term Long TradePreempting this as and Ending Diagonal in C of Y. If today's low holds - we get a strong trade up till min 24900. Next targets would be 25050, 25250.
Good RR!
