Tata consumer-A strong flag breakout in this FMCG stock!Tata consumer has given good breakout after a decent flag consolidation.
Stock can fly towards ATH and also make a new ATH soon. Keep in watchlist.
Amazing risk reward at CMP and relatively safe stock for long term.
Continuation

NAZARA - Weekly chart - Continuation breakoutThe analysis is done on Weekly TF hence price may take few weeks to few months in order to reach the targets. Trade setup is explained in image itself. This is a continuation breakout chart.
The above analysis is purely for educational purpose. Traders must do their own study & follow risk management before entering into any trade
Checkout my other ideas to understand how one can earn from stock markets with simple trade setups. Feel Free to comment below this or connect with me for any query or suggestion regarding this stock or Price Action Analysis.

BOSCH | CONTINUATION TRADE Disclaimer: This is NOT a trading recommendation. Please do your own analysis before entering positions
REASONS TO BUY:
1. Stock in an Uptrend with 100 EMA acting as Support
2. A downward trendline breakout with Higher Highs & Higher Lows
3. A double bottom on the 100EMA before breaking out
4. CMP near the support line for retest.
Entry: 19183
SL: 18480
Target: 20840
RR 2.3

BankNifty - 21 June 2023Detailed Analysis has been posted in my YouTube channel.
Do follow and subscribe if you like the analysis .
I expect the market to be Bullish tomorrow.
Trade or invest according to your analysis. This is just my view.
<----- 3MRT Trading ----->

KTK bank Stage analysis - Stage 2 breakoutKTK bank Stage analysis - Stage 2 breakout.
Entry - 155-162
SL - 144.8
Note : Only for learning, trade at your own risk.

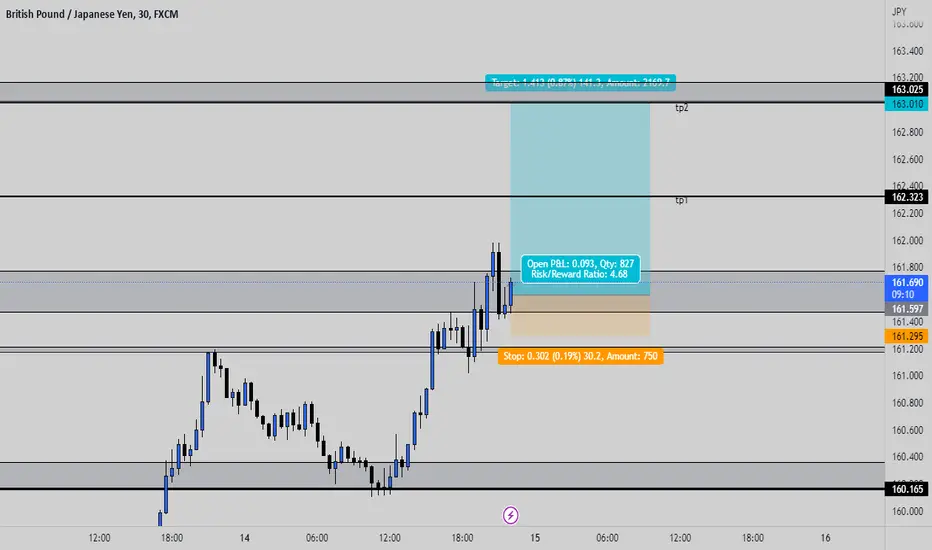
GBP JPY BUY setupI am buy on gbp jpy possible continuation bullish move. Breaked previous resistance 161.600 and closed above direction. Multiple rejection 161.200 major level expecting continuation.

Wonderla Holidays stage 2 continuation breakout chart.Wonderla Holidays stage 2 continuation breakout chart.
Entry 365-370
Stop loss 332
Position size - 10% of the trading capital.
Note : Only for learning, trade at your own risk.

USOILUSOIL
Chart Pattern - Symmetrical Triangle
Chart Pattern Type - Continuation Pattern
Time frame - 15 min
Taking support from lower trend line.
This chart is for educational purpose only. No trades are recommended

ITC chart analysis for swing trading ITC chart analysis for swing trading (15 min timeframe)
Entry & exits are given on chart.
only for learning, trade at your own risk.

HEROMOTOCO - SWING TRADE ANALYSISNSE:HEROMOTOCO
The auto sector have been outperforming in such a bearish market.
Most of the auto stocks have broken out of different resistance
one of them is heromotoco it has raised well and now consolidating near
previous swing high and forming a continuation pattern if it crosses 2810 then
A new 2nd bull leg is expected.
all levels has been mentioned on chart
DM me for more detail
happy trading!

#GBP AUD # SELL IDEA..Hey M, I am looking to sell GBPAUD below 1.76000 and expecting continuation to the 1.75000 based on fundamental and technical confluence price broke major resistance and tuned to rejection to support and supply creation to continuation of bearish momentum with head and shoulder confirmation thanks.

#ETHUSD # SELL PLAN Eth usd 1118 to 908 .... bear run continuation to the downside . Over all bearish market major break market structure and supply coming above . falling major demand levels.. thanks..

#AUD USD SELL TARGET HIT 1:4MY forecast on aud usd straight to my target 1:4 risk reward done.. market reacted the supply and support resistance and break below for continuation... -

#AUD USD SELL PLAN Iam looking to sell aud usd below 0.69042 and expecting to target 0.68200 .. continuation to the down trend reacted from the major resistance .. thanks

#GBPJPY# LOOKING BUYIam looking to buy GJ above 165.300 possible upside continuation and expecting to an target above 168.200 waiting for confirmation.... thanks...

#AUD NZD TARGET HIT 3.5R Perfect forecast done on AUD NZD buy setup on last day. follow me to get my next entry ..hope i can give u daily forecast base on each sessions. thanks.

#AUD NZD # LOOKING BUYIam looking buy on AUD NZD above 1.10900 expecting an retracement and continuation to the upside. thanks.

#EUR USD SELL PLAN Looking to sell EUR USD below 1.04800 and expecting a bull run above 1.04800 waiting for confirmation. thanks.

#CAD CHF 1:3 RR DONE Esterday took a buy on cad chf and saved 1:2 and partial got breakeven. just got an breakout on previous resistance on london open. expecting the continuation of breakout. thanks.

#LOOKING BUY ON CADCHFpossible buy cad chf above 0.77200 and targeting to 0.77900 continuation to the upside thanks.

# USD JPY LOOKING BUYIam looking for buy on usd jpy possible buy above 134.000 waiting for retest and valid rejection. thanks .

Bharti Airtel Likely to Breakout & Outperform Levels as mentioned on the chart
Plan of Action
Buy Bharti Airtel CMP 729.80 Stop 695 Target 825-885
Positional Stock Buy: Bharti Airtel CMP 729.80 Stop 695 Target 825-885
Wish You Happy & safe trading
Views are for ‘’EDUCATIONAL PURPOSE ONLY’’ trade at your own risk.
"Always Respect Risk"
Happy Trading
Jai Hind
