CANBK 1 Month Time Frame 📊 Live Price Snapshot
Current market price: ~₹155 – ₹156 range on NSE.
🔁 1‑Month Key Support & Resistance Levels (based on recent pivot & price data)
📈 Resistance Levels (Upside)
₹156 – ₹157 — Immediate resistance (Pivot + recent highs).
₹157.4 – ₹158.8 — Next resistance zone near recent 52‑week high.
₹160 + — Further upside beyond range expansion (short‑term breakout level).
👉 As long as price remains above ₹156–₹157, short‑term bias stays positive.
📉 Support Levels (Downside)
₹153 – ₹154 — Near short‑term support / pivot collision zone.
₹151.5 – ₹152 — Key short‑term support from Fibonacci/MA area.
₹149 – ₹150 — Deeper support if stocks correct further.
💡 A break below ₹151 could signal mild pullback pressure; staying above ₹154–₹156 keeps the short‑term uptrend intact.
📊 Moving Averages & Trend Signals (1‑Month Context)
Daily & weekly SMAs/EMAs show bullish bias with price above most key moving averages.
RSI (~57) in bullish to neutral territory — not overbought, so room for continuation.
MACD and other momentum readings support mild bullish momentum.
🗒️ What This Means for Traders
✔️ Bullish bias near current levels as long as above the 1st support zone (~₹153–₹154).
✔️ Watch out for pivot breaks:
‑ Below ₹151 for a short‑term pullback,
‑ Above ₹158 for upside continuation.
✔️ Confirm with volume and intraday momentum before major positional decisions.
Course

Profit with Options: Strategies, Principles, Practical Insights1. Understanding Options and Their Profit Potential
An option is a financial derivative that gives the buyer the right, but not the obligation, to buy or sell an underlying asset at a specific price (strike price) before or on a specified date (expiry).
Call options allow profits when the price of the underlying asset rises.
Put options allow profits when the price of the underlying asset falls.
Options profit potential comes from leverage. A relatively small investment (premium) can control a large value of the underlying asset. This leverage amplifies gains but also increases risk, making knowledge and planning essential.
2. Profit with Options in Bullish Markets
In bullish market conditions, traders expect prices to rise. Options offer multiple ways to profit from this expectation:
Buying Call Options: Profits increase as the underlying price rises above the strike price plus premium paid.
Bull Call Spreads: Buying a call at a lower strike and selling a call at a higher strike reduces cost and risk while capping profit.
Selling Put Options: Traders earn premium income if the asset stays above the strike price.
These strategies allow traders to benefit from upward movement with controlled risk compared to buying stocks outright.
3. Profit with Options in Bearish Markets
Options are equally effective in bearish conditions:
Buying Put Options: Profits grow as the underlying price falls below the strike price.
Bear Put Spreads: Lower cost strategies that limit both risk and reward.
Selling Call Options: Generates income if prices remain below the strike price.
This ability to profit in falling markets makes options especially attractive during economic slowdowns or market corrections.
4. Profit with Options in Sideways Markets
One of the biggest advantages of options is the ability to profit even when markets do not move significantly:
Option Selling Strategies: Selling calls or puts benefits from time decay (theta).
Iron Condors and Straddles: Designed to profit when prices remain within a defined range.
Calendar Spreads: Profit from differences in time decay between short-term and long-term options.
In range-bound markets, option sellers often have an edge due to the natural erosion of option value over time.
5. Role of Time Decay and Volatility
Two critical factors determine option profitability:
Time Decay (Theta): Options lose value as expiry approaches. Sellers benefit from this, while buyers must overcome it through strong price movement.
Volatility (Vega): Rising volatility increases option premiums, benefiting buyers. Falling volatility benefits sellers.
Understanding when to buy options (low volatility) and when to sell options (high volatility) significantly improves profit consistency.
6. Risk Management in Options Trading
While options offer high profit potential, risk management is crucial:
Always define maximum loss before entering a trade.
Use spreads instead of naked positions to limit downside.
Avoid over-leveraging capital in a single trade.
Maintain a proper risk-to-reward ratio, ideally risking less to gain more.
Professional option traders focus more on capital protection than aggressive profit chasing.
7. Profit with Options through Hedging
Options are widely used as insurance for portfolios:
Protective Puts safeguard long-term investments from sudden market crashes.
Covered Calls generate additional income on stock holdings.
Though hedging may reduce short-term profit, it stabilizes long-term returns and protects capital during market uncertainty.
8. Importance of Strategy Selection
There is no single best option strategy. Profitability depends on:
Market direction (bullish, bearish, neutral).
Volatility levels.
Time horizon.
Successful traders match strategies to market conditions rather than forcing trades. Discipline and patience often determine long-term success.
9. Psychology and Discipline in Options Profit
Options trading demands emotional control:
Avoid revenge trading after losses.
Stick to predefined rules and strategies.
Accept that losses are part of the process.
Consistent profits come from process-driven trading, not impulsive decisions.
10. Long-Term Perspective on Option Profits
Options are not a get-rich-quick tool. Sustainable profits come from:
Continuous learning and practice.
Back-testing strategies.
Adapting to changing market dynamics.
Traders who treat options as a professional skill rather than speculation tend to achieve long-term profitability.
Conclusion
Profit with options is achievable across all market conditions when approached with knowledge, discipline, and proper risk management. Options provide flexibility unmatched by other instruments, allowing traders to design strategies tailored to their market outlook and risk appetite. By understanding option mechanics, leveraging time decay and volatility, applying disciplined strategies, and managing risk effectively, traders can convert options into a consistent and powerful profit-generating tool in the financial markets.

Risk Management in Trading: How to Avoid Big Trading LossesUnderstanding Risk in Trading
Risk in trading refers to the possibility of losing part or all of your invested capital due to adverse market movements. Every trade carries uncertainty because markets are influenced by countless factors such as economic data, global events, institutional activity, and market psychology. A trader who ignores this uncertainty often overexposes themselves, leading to large and sometimes irreversible losses. Recognizing that risk is unavoidable is the first step toward controlling it.
Capital Preservation Comes First
The primary goal of risk management is capital preservation. If you lose a large portion of your trading capital, it becomes mathematically harder to recover. For example, a 50% loss requires a 100% gain just to break even. This is why professional traders prioritize protecting their capital over chasing profits. Staying in the game is more important than making quick money.
Position Sizing: The Core of Risk Control
One of the most effective tools in risk management is proper position sizing. Position sizing determines how much capital you allocate to a single trade. A common rule followed by disciplined traders is risking only 1–2% of total trading capital on any single trade. This means that even if several trades fail consecutively, the overall damage to the account remains manageable. Proper position sizing ensures that emotions remain under control and trading decisions stay rational.
Use of Stop-Loss Orders
Stop-loss orders are essential for avoiding big losses. A stop-loss defines the maximum loss you are willing to accept on a trade before entering it. Without a stop-loss, traders often fall into the trap of holding losing positions, hoping the market will reverse. This behavior can turn small losses into devastating ones. A predefined stop-loss enforces discipline and removes emotional decision-making during volatile market conditions.
Risk-Reward Ratio Matters
A favorable risk-reward ratio is a key principle of long-term profitability. This ratio compares the potential loss of a trade to its potential gain. For example, risking ₹1 to make ₹2 gives a 1:2 risk-reward ratio. Even if you are right only 40–50% of the time, a good risk-reward structure can keep you profitable. Traders who accept large risks for small rewards often face consistent losses despite a high win rate.
Avoid Overtrading
Overtrading is one of the most common causes of large trading losses. It occurs when traders take too many trades due to boredom, revenge trading after losses, or the fear of missing out (FOMO). Each trade carries risk, and excessive trading increases exposure unnecessarily. A well-defined trading plan with strict entry criteria helps reduce overtrading and improves overall performance.
Diversification and Market Selection
Putting all your capital into one asset, one sector, or one type of trade increases risk significantly. Diversification helps spread risk across different instruments or strategies. While diversification does not eliminate losses, it reduces the impact of a single adverse event. At the same time, traders should avoid over-diversification, which can dilute focus and lead to poor execution.
Emotional Discipline and Psychology
Emotions such as fear, greed, hope, and frustration are major contributors to big trading losses. Fear can cause premature exits, while greed can lead to oversized positions. Revenge trading after a loss often results in even bigger losses. Strong risk management rules act as a psychological safety net, helping traders stay calm and disciplined regardless of market conditions.
Leverage: A Double-Edged Sword
Leverage allows traders to control larger positions with smaller capital, but it also magnifies losses. Many traders blow their accounts by misusing leverage. High leverage combined with poor risk management can wipe out an account in minutes. Sensible use of leverage, aligned with strict stop-losses and position sizing, is essential to avoid catastrophic losses.
Adapting to Market Conditions
Markets are dynamic, and risk levels change with volatility. During high-volatility periods such as major news events or earnings announcements, price swings can be unpredictable. Reducing position size or staying out of the market during such times is a smart risk management decision. Flexibility and adaptability are crucial traits of successful traders.
Keep a Trading Journal
A trading journal is a powerful tool for improving risk management. By recording entry reasons, position size, stop-loss levels, emotions, and outcomes, traders can identify patterns that lead to losses. Over time, this self-analysis helps refine strategies, eliminate costly mistakes, and strengthen discipline.
Consistency Over Perfection
Many traders aim for perfect entries and high win rates, but consistency is far more important. A trader who follows risk management rules consistently will outperform a trader who occasionally makes big gains but suffers massive losses. Small, controlled losses are part of the trading process and should be accepted without emotional distress.
Long-Term Perspective
Risk management encourages a long-term mindset. Instead of focusing on daily profits or losses, traders should evaluate performance over a series of trades. This approach reduces emotional pressure and promotes logical decision-making. Successful trading is a marathon, not a sprint.
Conclusion
Avoiding big trading losses is not about predicting the market with absolute accuracy; it is about managing risk intelligently. Proper position sizing, disciplined use of stop-losses, favorable risk-reward ratios, emotional control, and capital preservation form the foundation of effective risk management. Traders who respect risk survive market downturns, learn from mistakes, and compound their capital steadily over time. In trading, protecting what you have is the first step toward achieving what you want.

Discipline Wins: The Foundation of Consistent Profits for TraderUnderstanding Discipline in Trading
Discipline in trading means the ability to follow a predefined plan regardless of emotions, market noise, or short-term outcomes. It involves executing trades according to rules, managing risk consistently, and accepting losses as a normal part of the process. A disciplined trader does not trade based on excitement, fear, greed, or social influence. Instead, every decision is intentional, measured, and aligned with long-term objectives.
Most traders fail not because their strategy is bad, but because they lack the discipline to execute it properly. They enter early, exit late, increase position size impulsively, or abandon their system after a few losses. Discipline keeps the trader aligned with probability, patience, and process.
Discipline vs. Strategy: Why Discipline Matters More
A common misconception is that success comes from finding the best strategy. In reality, an average strategy executed with strong discipline often outperforms an excellent strategy executed without discipline. Even the most profitable trading systems experience drawdowns. Without discipline, traders interfere with the system during losing phases, destroying its long-term edge.
Discipline ensures consistency in execution. Markets operate on probabilities, not certainties. Only disciplined repetition allows the statistical edge of a strategy to play out over time. Without discipline, randomness dominates results.
Emotional Control: The Core of Discipline
Trading is a psychological game disguised as a financial one. Fear and greed are the two dominant emotions that disrupt discipline. Fear causes traders to exit winning trades too early or avoid valid setups. Greed pushes traders to overtrade, overleverage, or hold positions beyond their logical exit points.
Discipline acts as a shield against emotional decision-making. When traders follow rules instead of emotions, they reduce impulsive behavior. Emotional control does not mean eliminating emotions; it means not acting on them. A disciplined trader feels fear and excitement but still follows the plan.
Risk Management: Discipline in Action
Risk management is where discipline becomes tangible. Consistent traders define their risk before entering a trade and never violate it. This includes setting stop losses, position sizing correctly, and limiting overall exposure.
A disciplined trader understands that capital preservation is more important than profit maximization. One undisciplined trade with excessive risk can wipe out weeks or months of steady gains. By respecting risk limits every time, traders ensure longevity in the market.
Discipline in risk management also means accepting small losses without hesitation. Traders who refuse to take losses often turn small mistakes into catastrophic ones. Discipline turns losses into controlled business expenses rather than emotional failures.
Discipline Creates Consistency, Not Perfection
Consistency in trading does not mean winning every trade. It means producing repeatable behavior and stable performance over time. Discipline ensures that the trader shows up every day with the same mindset, the same rules, and the same respect for the process.
Markets are unpredictable in the short term, but disciplined actions produce predictable results over the long term. This is why professional traders focus more on daily execution quality than on daily profit and loss.
Avoiding Overtrading Through Discipline
Overtrading is one of the biggest account killers. Many traders feel the need to be constantly active, believing that more trades equal more profits. Discipline teaches patience—waiting only for high-quality setups that match predefined criteria.
A disciplined trader understands that not trading is also a trading decision. Sitting out during unclear market conditions protects capital and mental energy. Fewer, well-planned trades often outperform frequent impulsive ones.
Discipline Builds Trust in Yourself
When traders follow their rules consistently, they begin to trust their own process. This self-trust is critical for long-term success. Without it, traders constantly second-guess themselves, jump between strategies, and remain emotionally unstable.
Discipline creates confidence not from winning trades, but from knowing that every action taken was correct according to the plan. Even losing trades feel manageable when they are the result of disciplined execution.
Discipline and Long-Term Thinking
Short-term thinking destroys traders. Focusing on daily profits leads to emotional decisions and unnecessary pressure. Discipline shifts focus toward long-term growth, equity curves, and performance metrics.
Consistent traders treat trading as a business, not a lottery. They measure success in months and years, not hours and days. Discipline aligns actions with long-term sustainability rather than short-term excitement.
Developing Trading Discipline
Discipline is not a talent; it is a skill developed through structure and repetition. Creating a written trading plan, maintaining a trading journal, setting daily rules, and reviewing performance regularly all contribute to stronger discipline.
Routine is a powerful tool. Trading the same markets, at the same time, with the same rules reduces randomness and emotional stress. Discipline grows when actions become habitual rather than reactive.
Discipline Wins in Every Market Condition
Markets change—trending, ranging, volatile, or quiet—but discipline remains constant. Strategies may need adjustment, but disciplined behavior never goes out of style. Traders who rely on discipline adapt calmly, while undisciplined traders panic and overreact.
In volatile markets, discipline prevents emotional blowups. In slow markets, it prevents boredom-driven trades. In winning streaks, it prevents overconfidence. In losing streaks, it prevents revenge trading.
Conclusion: Discipline Is the Real Edge
At its core, discipline is the true competitive advantage in trading. It allows traders to survive uncertainty, manage risk, control emotions, and execute consistently. While indicators, tools, and strategies can be learned by anyone, discipline must be earned through effort and self-awareness.
Consistent profits do not come from predicting the market, but from mastering oneself. Traders who embrace discipline accept that success is built one well-executed decision at a time. In the long run, discipline always wins—because markets reward those who respect process over impulse.

Understanding Market Structure Through Traded VolumeVolume Profile Analysis is a powerful market analysis technique that focuses not on time, but on price and volume interaction. Unlike traditional volume indicators that show how much volume was traded during a specific time period, volume profile reveals where trading activity was concentrated across different price levels. This makes it an essential tool for traders and investors who want to understand market structure, identify high-probability trade zones, and align themselves with institutional activity.
At its core, volume profile answers one crucial question: At which prices did the market accept value, and at which prices did it reject value? Understanding this distinction helps traders make better decisions about entries, exits, and risk management.
1. What Is Volume Profile?
Volume Profile is an advanced charting tool that displays a horizontal histogram on the price axis. This histogram shows the amount of volume traded at each price level over a selected period. Instead of vertical bars representing volume over time, volume profile shifts the focus horizontally, offering a clearer picture of price acceptance and rejection.
This tool is widely used by professional traders, proprietary desks, and institutions because it reflects real participation, not just price movement. Markets can move rapidly with low volume, but such moves are often unreliable. Volume profile helps traders identify where strong participation occurred and where moves lack conviction.
2. Key Components of Volume Profile
Volume profile is built around a few critical concepts that every trader must understand:
Point of Control (POC)
The POC is the price level where the highest volume was traded during the selected period. It represents the fairest price where buyers and sellers agreed most. Markets tend to gravitate toward the POC because it reflects balance and consensus.
Value Area (VA)
The value area is the price range where approximately 70% of total traded volume occurred. It is divided into:
Value Area High (VAH)
Value Area Low (VAL)
Prices inside the value area represent acceptance, while prices outside it indicate rejection or imbalance.
High Volume Nodes (HVN)
HVNs are price levels with heavy trading activity. They act as strong support or resistance zones because many positions are built there.
Low Volume Nodes (LVN)
LVNs are price levels with little trading activity. Price moves quickly through these areas, making them ideal for breakouts or fast directional moves.
3. Why Volume Profile Is Important
Volume profile gives traders a three-dimensional view of the market. While price shows direction and indicators show momentum, volume profile shows market intent.
Its importance lies in:
Identifying institutional accumulation and distribution
Filtering false breakouts
Understanding true support and resistance
Improving trade timing and accuracy
Enhancing risk-reward ratios
Markets are driven by large participants. Volume profile helps retail traders align with these larger forces instead of trading blindly based on indicators.
4. Market Phases Through Volume Profile
Volume profile clearly reveals different market phases:
Balanced Market (Range-Bound)
In balanced conditions, the profile is wide and bell-shaped. The POC remains stable, and price oscillates within the value area. Range trading strategies work best here.
Imbalanced Market (Trending)
In trending conditions, the profile shifts upward or downward, forming elongated shapes. The POC migrates in the direction of the trend, confirming strength.
Transition Phase
When price moves outside the value area and builds volume at new levels, the market transitions into a new balance. This phase often offers the best trading opportunities.
5. Using Volume Profile for Support and Resistance
Traditional support and resistance lines are subjective. Volume profile offers objective levels based on actual traded volume.
HVNs act as strong support/resistance zones.
VAH and VAL often behave like dynamic resistance and support.
POC works as a magnet price, pulling price back during consolidation.
These levels are more reliable than trendlines because they reflect real market participation.
6. Breakout and Rejection Analysis
Volume profile is highly effective in distinguishing real breakouts from fake ones.
A breakout above VAH with strong volume acceptance indicates trend continuation.
A move above VAH followed by quick rejection back into the value area signals a false breakout.
LVNs above or below value areas often become breakout targets.
This ability to read acceptance versus rejection makes volume profile invaluable for intraday, swing, and positional traders.
7. Entry and Exit Strategy Using Volume Profile
Traders can use volume profile to refine entries and exits:
Entries
Buy near VAL in an uptrend
Sell near VAH in a downtrend
Enter breakouts from LVNs with confirmation
Exits
Partial profits near POC or HVNs
Full exits near opposite value area boundaries
Trail stops beyond low-volume zones
This structured approach improves consistency and reduces emotional trading.
8. Volume Profile Across Timeframes
Volume profile works across all timeframes:
Intraday traders use session volume profiles
Swing traders use weekly or monthly profiles
Investors analyze long-term composite profiles
Higher timeframe volume levels always carry more weight and should be respected even when trading lower timeframes.
9. Combining Volume Profile with Other Tools
Volume profile is most effective when combined with:
Price action
Market structure
VWAP
Trend analysis
Candlestick patterns
It should not be used in isolation. Instead, it acts as a context tool, helping traders understand where trades make sense and where they do not.
10. Common Mistakes in Volume Profile Analysis
Many traders misuse volume profile by:
Ignoring market context
Overloading charts with multiple profiles
Trading every LVN without confirmation
Treating POC as a guaranteed reversal level
Discipline and proper interpretation are essential to extract its full potential.
11. Psychological Edge of Volume Profile
Volume profile enhances trading psychology by:
Providing clear reference levels
Reducing guesswork
Increasing confidence in trade decisions
Encouraging patience and discipline
When traders understand where value lies, they stop chasing price and start trading with logic.
12. Conclusion
Volume Profile Analysis is one of the most insightful tools for understanding market behavior. By focusing on where volume is traded rather than when, it reveals the true structure of the market. It helps traders identify value, spot institutional activity, and distinguish between genuine moves and false signals.
For traders seeking consistency, clarity, and a deeper understanding of price action, volume profile is not just an indicator—it is a framework for thinking about markets. Mastery of volume profile can significantly elevate trading performance when combined with sound risk management and disciplined execution.

Part 3 Introduction to Institutional TradingIncome Through Option Selling
Short straddles, strangles, and spreads are used to make weekly or monthly income.
This is one of the most stable use cases of options.
Option selling works because:
Time decay benefits the seller
Most price action remains range-bound
Sellers use probability-based models
Institutions have been doing this for decades. Today, retail traders also follow similar approaches on indices.

Part 1 Master Candle Stick Patterns Risks in Option Trading
Options require deep understanding. Some risks include:
A. Time Decay (Theta)
Option value reduces every day.
B. Volatility Crush
Premium falls rapidly when volatility decreases (common after events).
C. Low Liquidity
Wider bid–ask spreads can increase trading cost.
D. Large Losses for Sellers
Shorting options without hedges can be very risky.
E. Emotional Trading
High leverage leads to overtrading.

Part 10 Trade Like Institutiona Protective Put & Married Put
Protective Put
Hold stock
Buy put
Acts like insurance.
Married Put
Buy stock + Buy put simultaneously
Useful in high-risk environments.

Policy Matters in Trading DevelopmentBuilding a Stable, Transparent, and Growth-Oriented Market Ecosystem
Trading development does not happen in isolation. It is deeply influenced by government policies, regulatory frameworks, monetary decisions, and institutional rules that shape how markets function. Policies act as the backbone of trading ecosystems by ensuring fairness, transparency, stability, and long-term growth. Without strong and adaptive policies, trading markets can become vulnerable to manipulation, excessive volatility, and systemic risks. The following discussion explains in detail why policy matters are crucial in trading development and how they impact different dimensions of financial markets.
1. Role of Policy in Market Stability
One of the primary objectives of trading-related policies is maintaining market stability. Financial markets are sensitive to economic shocks, speculative excesses, and global events. Regulatory policies such as circuit breakers, margin requirements, and position limits help prevent panic-driven crashes and extreme volatility. These mechanisms protect both retail and institutional investors from sudden market breakdowns and ensure orderly trading conditions.
Stable markets encourage long-term participation, attract foreign investors, and build confidence in the financial system. Without such policies, markets can experience frequent bubbles and crashes, undermining economic growth.
2. Ensuring Fairness and Transparency
Fair trading practices are the foundation of healthy market development. Policies related to disclosure norms, insider trading restrictions, and market surveillance ensure that all participants operate on a level playing field. Transparent rules require companies to disclose financial results, material events, and governance practices, enabling traders to make informed decisions.
Strong transparency policies reduce information asymmetry, where only a few participants have access to critical information. This builds trust, especially among retail traders, and increases overall market participation.
3. Investor Protection and Confidence
Investor protection policies are essential for sustainable trading development. Regulations governing broker conduct, client fund segregation, grievance redressal mechanisms, and compensation funds protect investors from fraud and misconduct.
When traders feel protected, they are more willing to participate actively in markets. Investor confidence leads to higher liquidity, better price discovery, and deeper markets. In contrast, weak protection policies often result in capital flight and reduced participation.
4. Impact of Monetary Policy on Trading
Monetary policy decisions—such as interest rate changes, liquidity measures, and inflation control—directly influence trading behavior. Lower interest rates generally push investors toward equities and risk assets, while higher rates may shift capital toward fixed-income instruments.
Central bank policies affect currency markets, bond yields, commodity prices, and equity valuations. Traders closely monitor policy statements and economic projections to anticipate market movements. Thus, monetary policy plays a crucial role in shaping trading strategies and asset allocation decisions.
5. Fiscal Policy and Market Development
Fiscal policies, including taxation, government spending, and subsidies, also significantly affect trading development. Changes in capital gains tax, securities transaction tax, or corporate tax rates can alter trading volumes and investment preferences.
Pro-growth fiscal policies often boost corporate earnings expectations, leading to bullish market sentiment. Conversely, restrictive fiscal measures may dampen market activity. Well-designed fiscal policies balance revenue generation with market competitiveness.
6. Regulatory Frameworks and Market Integrity
Strong regulatory institutions are vital for maintaining market integrity. Regulations covering market manipulation, algorithmic trading, derivatives, and high-frequency trading ensure that innovation does not compromise fairness.
As markets evolve with technology, policies must adapt to new trading instruments and platforms. Robust regulatory frameworks help manage risks associated with leverage, complex derivatives, and automated trading systems.
7. Encouraging Innovation and Technological Growth
Policy support is critical for encouraging innovation in trading infrastructure. Regulations that allow electronic trading platforms, fintech participation, and digital settlement systems enhance efficiency and reduce transaction costs.
At the same time, policies must address cybersecurity risks, data privacy, and operational resilience. A balanced policy approach fosters innovation while safeguarding market stability.
8. Role of Policies in Market Liquidity
Liquidity is the lifeblood of trading markets. Policies related to market-making, short-selling, and institutional participation influence liquidity levels. Allowing controlled short-selling, for example, improves price discovery and reduces bid-ask spreads.
Well-designed liquidity policies ensure smooth execution of trades, reduce volatility, and make markets more attractive to global investors.
9. Global Trade and Cross-Border Policies
In an interconnected world, trading development is influenced by international policies and agreements. Foreign investment regulations, capital flow controls, and trade agreements affect cross-border trading activity.
Harmonized global policies improve market access and integration, while protectionist measures can restrict capital flows and increase uncertainty. Traders must account for geopolitical and policy risks in their strategies.
10. Risk Management and Systemic Stability
Policies related to risk management play a crucial role in preventing systemic crises. Capital adequacy norms, stress testing, and exposure limits help financial institutions manage risks effectively.
These policies ensure that failures of individual participants do not escalate into broader market crises. Strong risk management frameworks protect the overall trading ecosystem and the real economy.
11. Development of Derivatives and Advanced Markets
The growth of derivatives markets depends heavily on regulatory clarity. Policies defining contract specifications, margin norms, and settlement mechanisms are essential for safe derivatives trading.
Well-regulated derivatives markets allow traders to hedge risks, improve price discovery, and manage volatility. Poorly regulated derivatives, however, can amplify risks and lead to financial instability.
12. Long-Term Economic Growth and Capital Formation
Trading markets play a vital role in capital formation and economic development. Policies that support efficient capital markets enable companies to raise funds for expansion, innovation, and job creation.
By aligning trading policies with broader economic goals, governments can ensure that financial markets contribute positively to national development rather than becoming purely speculative arenas.
13. Education, Awareness, and Policy Support
Policies promoting financial literacy and trader education are increasingly important. Educated traders make better decisions, reduce herd behavior, and contribute to market stability.
Regulatory bodies often support awareness programs, research initiatives, and training to improve market understanding. This strengthens the overall trading ecosystem.
Conclusion
Policy matters are central to trading development because they shape the environment in which markets operate. Effective policies ensure stability, fairness, transparency, and investor protection while encouraging innovation and growth. Monetary and fiscal policies influence market behavior, regulatory frameworks maintain integrity, and global policies affect cross-border participation.
In a rapidly evolving financial landscape, adaptive and well-balanced policies are essential for sustainable trading development. When policies align with economic objectives and market realities, they create resilient trading systems that support long-term growth, confidence, and prosperity.

Part 3 Learn Institutional Trading How Option Trading Works
When a trader buys a call option, they expect the price of the underlying asset to rise above the strike price before expiration. If the price rises significantly, the trader can either exercise the option or sell it in the market for a profit. Similarly, buying a put option reflects a bearish view, where the trader expects prices to fall.
Option sellers, on the other hand, earn income through the premium received. However, selling options involves higher risk, as losses can be substantial if the market moves sharply against the position.

Pair Trading and Statistical ArbitrageMarket-Neutral Strategies for Consistent Alpha
Pair trading and statistical arbitrage are advanced trading strategies rooted in quantitative analysis, probability, and mean reversion. Unlike directional trading, which depends on predicting whether markets will rise or fall, these strategies focus on relative price movements between securities. Their core strength lies in being market-neutral, meaning profits can be generated in both bullish and bearish market conditions if executed with discipline and robust statistical models.
Understanding Pair Trading
Pair trading is one of the simplest and most widely used forms of statistical arbitrage. It involves identifying two highly correlated or economically related instruments—such as stocks from the same sector, index constituents, or companies with similar business models—and trading the price divergence between them.
The basic logic is straightforward:
When two related assets historically move together, any temporary divergence from their normal relationship is assumed to be temporary.
The trader simultaneously buys the underperforming asset and sells the outperforming asset.
When prices revert to their historical relationship, the trader exits both positions, capturing the spread profit.
For example, if two banking stocks that typically trade in tandem suddenly diverge due to short-term news or market inefficiency, pair trading seeks to exploit that mispricing rather than predicting overall market direction.
Core Principles Behind Pair Trading
The effectiveness of pair trading depends on several statistical and economic assumptions:
Correlation and Cointegration
While correlation measures how two assets move together, cointegration goes a step further by ensuring that their price relationship remains stable over time. Successful pair trading strategies rely more on cointegration than simple correlation.
Mean Reversion
Pair trading assumes that deviations from the historical price spread are temporary. The spread eventually reverts to its mean due to market forces, arbitrage, or fundamental alignment.
Simultaneous Long and Short Positions
By holding both long and short positions, the trader minimizes exposure to broader market movements, interest rate changes, or macroeconomic shocks.
What Is Statistical Arbitrage?
Statistical arbitrage is a broader, more sophisticated extension of pair trading. While pair trading usually focuses on two securities, statistical arbitrage may involve dozens, hundreds, or even thousands of instruments. It relies heavily on quantitative models, historical data analysis, and automated execution.
Statistical arbitrage strategies search for probabilistic mispricings rather than guaranteed arbitrage opportunities. These mispricings are identified using statistical techniques such as:
Regression analysis
Z-scores
Principal component analysis (PCA)
Machine learning models
Time-series forecasting
The objective is to exploit small pricing inefficiencies repeatedly, generating consistent returns over time.
How Statistical Arbitrage Works in Practice
A statistical arbitrage system typically follows a structured workflow:
Data Collection and Cleaning
Large volumes of historical price, volume, and sometimes fundamental data are gathered and standardized.
Model Construction
Quantitative models are developed to identify relationships, predict expected returns, and estimate deviations from equilibrium.
Signal Generation
Trading signals are generated when prices move beyond statistically significant thresholds, such as when a Z-score exceeds ±2.
Risk Management and Position Sizing
Positions are sized dynamically to maintain portfolio neutrality and control volatility.
Automated Execution
Because inefficiencies can be short-lived, trades are often executed algorithmically to minimize slippage and latency.
Key Differences Between Pair Trading and Statistical Arbitrage
While closely related, the two approaches differ in scope and complexity:
Pair Trading focuses on two assets and is easier to understand and implement.
Statistical Arbitrage operates at the portfolio level and may involve multiple asset classes.
Pair trading can be discretionary or semi-systematic, whereas statistical arbitrage is usually fully systematic and model-driven.
Statistical arbitrage often requires advanced computing power, robust backtesting, and continuous model refinement.
Despite these differences, both strategies share the same philosophical foundation: exploiting market inefficiencies through statistical evidence rather than speculation.
Advantages of Market-Neutral Strategies
Pair trading and statistical arbitrage offer several compelling advantages:
Reduced Market Risk
Since positions are hedged, overall market direction has limited impact on returns.
Consistency Across Market Cycles
These strategies can perform in volatile, range-bound, or trending markets.
Diversification Benefits
They complement traditional directional strategies and reduce portfolio volatility.
Objective Decision-Making
Trades are based on data and statistical thresholds, minimizing emotional bias.
Risks and Challenges
Despite their appeal, these strategies are not risk-free:
Model Risk: Historical relationships may break down due to structural changes, regulation, or company-specific events.
Execution Risk: Slippage, transaction costs, and liquidity constraints can erode profits.
Crowding Risk: Popular pairs and models may become overcrowded, reducing effectiveness.
Tail Risk: Extreme market events can cause correlations to collapse, leading to unexpected losses.
Successful practitioners continuously monitor performance and adapt models to evolving market conditions.
Risk Management in Pair Trading and Statistical Arbitrage
Effective risk management is critical. Common techniques include:
Stop-loss limits on spread deviations
Time-based exits if convergence fails
Diversification across multiple pairs or strategies
Dynamic rebalancing and volatility targeting
Position sizing based on statistical confidence rather than fixed capital allocation further enhances stability.
Role of Technology and Automation
Modern statistical arbitrage is inseparable from technology. High-quality data feeds, backtesting frameworks, and automated execution systems are essential. Machine learning and artificial intelligence are increasingly used to detect nonlinear relationships and adapt to changing market regimes.
However, complexity does not guarantee success. Simpler, well-tested models with disciplined execution often outperform overly complex systems.
Conclusion
Pair trading and statistical arbitrage represent a powerful class of quantitative, market-neutral strategies designed to profit from relative mispricing rather than market direction. Pair trading offers a focused, intuitive entry point, while statistical arbitrage scales the concept into a diversified, model-driven approach suitable for professional and institutional traders.
When supported by strong statistical validation, disciplined risk management, and continuous monitoring, these strategies can deliver consistent alpha across market cycles. In an increasingly efficient and competitive trading environment, pair trading and statistical arbitrage remain essential tools for traders seeking precision, objectivity, and long-term sustainability in the financial markets.

Understanding Market Phases to Anticipate the FutureOutlook Cycle Secrets
In the world of investing, trading, and economic decision-making, success is rarely driven by luck alone. It is shaped by the ability to understand where the economy and markets stand in a broader cycle and how that position influences future outcomes. The concept of the outlook cycle refers to the recurring phases through which economies, industries, and financial markets move over time. These cycles are not random; they are influenced by human behavior, policy decisions, capital flows, innovation, and external shocks. Unlocking the “secrets” of the outlook cycle allows investors, businesses, and policymakers to make informed, forward-looking decisions rather than reacting emotionally to headlines.
What Is an Outlook Cycle?
An outlook cycle represents the collective expectations about the future—growth, inflation, profits, employment, and stability—and how those expectations evolve over time. Markets are inherently forward-looking. Prices today often reflect what participants believe will happen six months, one year, or even several years ahead. As expectations rise or fall, they drive asset prices, capital allocation, and risk appetite.
Typically, outlook cycles align with broader economic cycles and can be divided into four main phases: recovery, expansion, slowdown, and contraction. Each phase carries distinct characteristics in terms of sentiment, liquidity, policy stance, and asset performance. Understanding these phases is the foundation of mastering outlook cycle dynamics.
Phase One: Recovery – The Birth of Optimism
The recovery phase begins after a downturn or crisis. Economic data is still weak, unemployment may be high, and corporate earnings are often depressed. However, the outlook starts to improve because the pace of deterioration slows. This is a crucial secret of the outlook cycle: markets often bottom out when conditions look the worst, not when they look good.
During recovery, central banks usually maintain accommodative policies such as low interest rates and liquidity support. Governments may introduce stimulus measures to revive growth. Investor sentiment remains cautious, but early movers begin positioning for future improvement. Historically, equities and risk assets perform strongly in this phase because valuations are low and expectations are modest.
The key insight here is that improving expectations matter more than absolute conditions. Those who wait for “clear confirmation” often miss the most powerful part of the cycle.
Phase Two: Expansion – Confidence Takes Control
Expansion is the most comfortable and visible phase of the outlook cycle. Economic growth becomes broad-based, corporate earnings rise, employment improves, and consumer confidence strengthens. Credit flows freely, business investment increases, and innovation accelerates.
Market sentiment during expansion is optimistic. Risk appetite is high, and capital rotates into equities, commodities, and growth-oriented sectors. Media narratives reinforce positive outlooks, often highlighting long-term growth stories and structural transformations.
However, one of the hidden secrets of the outlook cycle is that the seeds of future slowdown are often planted during expansion. Excessive leverage, asset bubbles, rising costs, and overconfidence can quietly build beneath the surface. While expansion can last for years, it is also the phase where discipline becomes most important.
Phase Three: Slowdown – The Turning Point
The slowdown phase is subtle and often misunderstood. Growth does not collapse immediately; instead, it decelerates. Inflationary pressures may rise, prompting central banks to tighten monetary policy. Interest rates increase, liquidity conditions tighten, and borrowing becomes more expensive.
Corporate margins may start to compress as costs rise faster than revenues. Leading indicators—such as purchasing manager indices, yield curves, and credit spreads—begin to signal stress even while headline economic data still looks healthy.
The critical secret in this phase is recognizing that markets respond to the rate of change, not the level. Even strong growth can lead to weak market performance if expectations peak and begin to decline. Defensive sectors, quality assets, and cash preservation strategies become increasingly important during this stage.
Phase Four: Contraction – Fear and Opportunity
Contraction is marked by falling economic output, declining profits, rising unemployment, and reduced consumer spending. Sentiment turns pessimistic, risk appetite collapses, and capital seeks safety. This phase often follows a policy mistake, financial imbalance, or external shock such as geopolitical conflict or a global crisis.
While contraction is emotionally difficult, it holds some of the most powerful opportunities for long-term investors. Valuations reset, inefficient businesses are cleared out, and new cycles begin to form. Policy responses—rate cuts, stimulus packages, and reforms—lay the groundwork for the next recovery.
The ultimate outlook cycle secret is this: every contraction contains the blueprint for the next expansion. Those who can detach emotionally and focus on long-term fundamentals are best positioned to benefit.
The Role of Psychology in Outlook Cycles
Human psychology plays a central role in shaping outlook cycles. Fear and greed amplify market movements, often pushing prices far beyond intrinsic value in both directions. During expansions, optimism can become complacency. During contractions, fear can turn into despair.
Understanding behavioral biases—such as herd mentality, confirmation bias, and loss aversion—helps decode why outlook cycles tend to overshoot. Markets do not simply reflect economic reality; they reflect collective belief systems about the future.
Using Outlook Cycles as a Strategic Tool
Mastering outlook cycle secrets is not about predicting exact tops or bottoms. It is about positioning intelligently across phases. Traders may focus on short-term momentum shifts, while long-term investors align portfolios with the dominant phase of the cycle.
Diversification, risk management, and flexibility are essential. As cycles evolve, so should strategies. Static thinking is one of the biggest enemies of success in cyclical markets.
Conclusion: Thinking Ahead of the Crowd
The outlook cycle is a powerful framework for understanding how economies and markets evolve over time. By focusing on expectations, sentiment, policy direction, and the rate of change rather than headlines alone, one can gain a meaningful edge.
The real secret lies in thinking independently and ahead of the crowd—buying when optimism is scarce, exercising caution when confidence is excessive, and always remembering that cycles are inevitable. Those who respect the rhythm of the outlook cycle are better equipped not only to protect capital but also to grow it consistently across changing market environments.

Two Powerful Approaches to Understanding Financial MarketsTechnical Analysis vs Fundamental Analysis
In the world of trading and investing, decision-making is driven by analysis. Among the many methods available, technical analysis and fundamental analysis stand out as the two most widely used and debated approaches. Both aim to identify profitable opportunities in financial markets, yet they differ significantly in philosophy, tools, time horizon, and interpretation of market behavior. Understanding the strengths, limitations, and appropriate use of each method is essential for traders and investors seeking consistency and clarity in their strategies.
Understanding Technical Analysis
Technical analysis is the study of price movements, volume, and market patterns to forecast future price behavior. It is based on the belief that all available information—economic, political, and psychological—is already reflected in the price. Therefore, instead of focusing on why a price moves, technical analysts focus on how it moves.
At its core, technical analysis relies on charts and indicators. Traders examine historical price data to identify trends, support and resistance levels, chart patterns, and momentum signals. Common tools include moving averages, Relative Strength Index (RSI), MACD, Bollinger Bands, Fibonacci retracements, and candlestick patterns.
One of the foundational principles of technical analysis is that price trends tend to repeat due to human psychology. Fear, greed, hope, and panic create recognizable patterns over time. For example, breakouts, pullbacks, and reversals often occur in similar ways across different markets and time frames.
Technical analysis is especially popular among short-term traders, such as intraday traders, scalpers, and swing traders. These participants need precise entry and exit points, which technical tools provide. Since technical analysis can be applied to any tradable instrument—stocks, forex, commodities, cryptocurrencies, or indices—it is highly versatile.
However, technical analysis has limitations. Indicators are often derived from past prices, which means they can lag in fast-moving markets. False breakouts and whipsaws can lead to losses if risk management is poor. Additionally, technical analysis does not directly account for major fundamental events such as earnings surprises, policy changes, or geopolitical shocks.
Understanding Fundamental Analysis
Fundamental analysis focuses on evaluating the intrinsic value of an asset by examining economic, financial, and qualitative factors. The goal is to determine whether an asset is undervalued, fairly valued, or overvalued compared to its current market price.
In stock markets, fundamental analysis involves studying a company’s financial statements, including revenue, profit, cash flow, debt, and margins. Key metrics such as earnings per share (EPS), price-to-earnings (P/E) ratio, return on equity (ROE), and growth rates play a crucial role. Beyond numbers, analysts also assess management quality, competitive advantage, industry position, and long-term business sustainability.
In other markets, such as forex or commodities, fundamental analysis revolves around macroeconomic indicators. Interest rates, inflation, GDP growth, trade balances, central bank policies, and global supply-demand dynamics are central to valuation.
Fundamental analysis is most commonly used by long-term investors and positional traders. These market participants believe that, over time, prices will converge toward intrinsic value. For example, an investor may buy shares of a fundamentally strong company during temporary market weakness and hold them for years.
The strength of fundamental analysis lies in its ability to identify long-term wealth creation opportunities. It helps investors stay aligned with economic reality and business performance rather than short-term market noise.
However, fundamental analysis also has drawbacks. Markets can remain irrational longer than expected, meaning undervalued assets may stay undervalued for extended periods. Fundamental data is often released quarterly or monthly, making it less useful for short-term timing. Additionally, interpreting fundamentals requires assumptions about future growth, which may not always materialize.
Key Differences Between Technical and Fundamental Analysis
The most important difference between the two approaches lies in their focus. Technical analysis focuses on price behavior and market action, while fundamental analysis focuses on underlying value and financial strength.
Another major distinction is time horizon. Technical analysis is generally used for short- to medium-term trades, whereas fundamental analysis is better suited for medium- to long-term investments.
The data used also differs. Technical analysts rely on charts, indicators, and price history, while fundamental analysts study financial statements, economic reports, and industry trends.
In terms of decision-making, technical analysis emphasizes timing—when to enter and exit—while fundamental analysis emphasizes selection—what to buy or sell.
Which Is Better: Technical or Fundamental Analysis?
The debate over which approach is superior has existed for decades, but the reality is that neither is universally better. Their effectiveness depends on the trader’s goals, personality, and market conditions.
Short-term traders often prefer technical analysis because price movements and momentum matter more than long-term value in the near term. Long-term investors tend to rely on fundamental analysis because business performance and economic growth drive returns over time.
Many successful market participants adopt a hybrid approach, combining both methods. For example, an investor may use fundamental analysis to identify strong companies and then apply technical analysis to time entries and exits. This combination helps align value with market timing, reducing risk and improving consistency.
Conclusion
Technical analysis and fundamental analysis represent two different lenses through which financial markets can be understood. Technical analysis interprets market behavior through price and patterns, making it ideal for timing and short-term strategies. Fundamental analysis evaluates intrinsic value and economic strength, making it essential for long-term investment decisions.
Rather than viewing them as opposing philosophies, traders and investors should see them as complementary tools. Mastering both provides a deeper, more balanced understanding of markets, enabling better decisions across different market phases. In a complex and ever-changing financial world, the ability to adapt and integrate multiple perspectives is often the true edge.

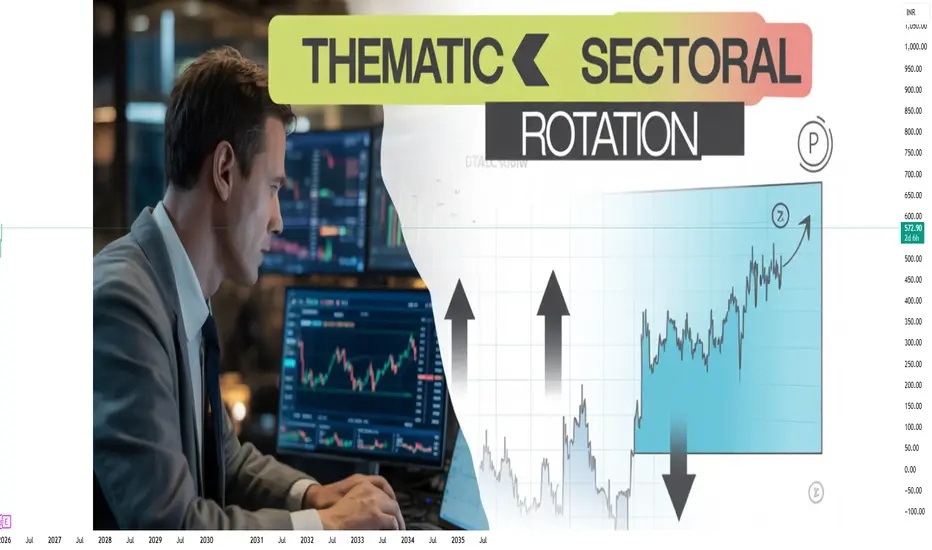
Thematic and Sectoral Rotation TradingRiding Market Cycles with Strategic Precision
The financial markets do not move in a straight line. They evolve through cycles driven by economic growth, interest rates, inflation, government policies, technological innovation, and investor psychology. Within these cycles, leadership constantly shifts from one sector to another and from one powerful theme to the next. Thematic and sectoral rotation trading is a strategy that seeks to identify these shifts early and allocate capital to the areas of the market most likely to outperform at a given phase of the cycle. Instead of focusing on individual stock stories alone, this approach looks at the bigger picture, aligning trades with macroeconomic trends and structural changes in the economy.
Understanding Sectoral Rotation Trading
Sectoral rotation trading is based on the idea that different sectors perform better at different stages of the economic cycle. The economy typically moves through phases such as recovery, expansion, peak, slowdown, and recession. Each phase creates a favorable environment for specific industries.
For example, during an economic recovery, sectors like banking, real estate, automobiles, and capital goods often lead because credit growth picks up and consumer demand improves. In the expansion phase, IT services, consumer discretionary, and industrials may outperform as corporate profits grow. During periods of high inflation or uncertainty, defensive sectors such as FMCG, pharmaceuticals, and utilities tend to attract investor interest because of stable earnings. Sectoral rotation traders study these patterns and shift capital accordingly, aiming to stay invested in market leaders rather than laggards.
This approach reduces the risk of being stuck in underperforming sectors during unfavorable cycles. Instead of predicting which single stock will do well, traders focus on which sector has the wind at its back.
What is Thematic Trading?
Thematic trading goes a step beyond sectoral rotation. While sectors are broad classifications like banking, IT, or energy, themes are cross-sectoral narratives driven by long-term structural changes. A single theme can impact multiple industries simultaneously.
Examples of themes include digital transformation, renewable energy, electric vehicles, infrastructure development, defense manufacturing, China-plus-one supply chain shift, financial inclusion, and consumption growth in emerging markets. These themes often play out over several years rather than months. Thematic traders aim to identify these powerful narratives early and invest in companies that are direct or indirect beneficiaries.
Unlike sectoral rotation, which is more closely linked to economic cycles, thematic trading is driven by structural shifts that may continue even during economic slowdowns. For instance, digitization and automation can continue regardless of short-term GDP fluctuations.
The Role of Macroeconomics and Policy
Both thematic and sectoral rotation trading rely heavily on macroeconomic analysis. Interest rates, inflation, fiscal spending, monetary policy, and global economic trends act as triggers for rotation. In the Indian market, government policies play a particularly important role. Budget allocations, production-linked incentive (PLI) schemes, infrastructure spending, and reforms in banking or energy can create strong sectoral and thematic tailwinds.
For example, a rising interest rate environment may hurt rate-sensitive sectors like real estate but benefit banks through improved net interest margins. Similarly, a government push toward renewable energy can create a multi-year theme benefiting solar, wind, power equipment, and green financing companies. Traders who understand these macro-policy linkages gain a significant edge.
Time Horizon and Trading Style
Sectoral rotation trading is usually medium-term in nature, ranging from a few weeks to several months. Traders actively rebalance portfolios as leadership changes. Thematic trading, on the other hand, often suits positional or long-term investors who are willing to stay invested for years while tolerating short-term volatility.
However, both strategies can be adapted for trading if supported by technical analysis. Many traders combine top-down analysis (macro and sector/theme identification) with bottom-up analysis (stock selection and technical timing). This hybrid approach helps in entering themes and sectors at optimal points rather than chasing momentum blindly.
Tools Used in Rotation Trading
Successful thematic and sectoral rotation traders use a combination of tools:
Relative strength analysis to compare sector performance against benchmark indices
Sector indices and ETFs to track broad sector movements
Economic indicators such as PMI, inflation data, interest rates, and GDP growth
Technical indicators like moving averages, trendlines, and momentum oscillators
Earnings trends and valuations to avoid overpaying for popular themes
Relative strength is especially critical. A sector may be fundamentally strong, but if it is underperforming the broader market, capital is likely flowing elsewhere. Rotation trading is ultimately about capital flow analysis.
Advantages of Thematic and Sectoral Rotation Trading
One of the biggest advantages of this approach is alignment with market leadership. Markets reward sectors and themes where institutional money flows. By positioning in these areas, traders increase the probability of outperforming the benchmark.
Another advantage is diversification with direction. Instead of spreading capital randomly across stocks, traders diversify across high-conviction sectors or themes, reducing unsystematic risk while maintaining focus. This strategy also helps traders avoid emotional attachment to stocks and encourages a dynamic, adaptive mindset.
Risks and Challenges
Despite its advantages, thematic and sectoral rotation trading is not without risks. Themes can become overcrowded, leading to sharp corrections once expectations peak. Sectoral leadership can also change abruptly due to unexpected macro events such as geopolitical tensions, policy reversals, or global financial shocks.
Timing is another major challenge. Entering a theme too early can lead to long periods of underperformance, while entering too late can expose traders to sharp drawdowns. This is why discipline, risk management, and continuous review are essential.
The Indian Market Perspective
In India, thematic and sectoral rotation trading has gained popularity due to strong retail participation and clear policy-driven narratives. Sectors like PSU banks, infrastructure, defense, renewables, and manufacturing have shown how powerful rotations can be when aligned with economic and political trends. Indian markets are particularly sensitive to liquidity conditions and foreign institutional investor flows, making rotation strategies highly relevant.
Conclusion
Thematic and sectoral rotation trading is a sophisticated yet practical approach that bridges macroeconomic understanding with market execution. It encourages traders and investors to think beyond individual stocks and focus on where growth, capital, and narratives are converging. When executed with proper research, timing, and risk management, this strategy can help market participants stay ahead of cycles, capture leadership trends, and build sustainable performance over time. In a world of ever-changing markets, the ability to rotate intelligently is not just a skill—it is a necessity.
Part 12 Trading Master Class Call Option Explained
A Call Option gives the buyer the right to buy the underlying asset at a fixed price (strike price) before or on expiry.
Example:
If NIFTY is trading at 22,000 and you buy a 22,200 Call Option, you expect the market to move up.
If NIFTY goes to 22,400 → You profit
If NIFTY stays below 22,200 → Option may expire worthless
Maximum loss = Premium paid
Profit potential = Unlimited
Call options are generally used when traders are bullish on the market.

Risk Management & Money Management1. Understanding Risk Management in Trading
Risk management is the practice of identifying, assessing, and controlling the amount of loss you are willing to tolerate in a trade. It answers a simple question:
👉 “How much can I afford to lose if this trade goes wrong?”
Professional traders know that losing trades are unavoidable. What matters is how big those losses are.
1.1 Key Elements of Risk Management
1. Position Sizing
Position sizing means deciding how many shares/lots/contracts to trade based on your account balance and risk tolerance.
Most traders risk 1% to 2% per trade.
Example:
If your capital = ₹1,00,000
Risk per trade = 1% = ₹1,000
If SL difference is ₹5, quantity = ₹1,000 ÷ 5 = 200 shares.
This ensures no single trade damages your account.
2. Stop-Loss Placement
A stop-loss is a predefined price where you exit automatically if the trade goes against you.
Stop-loss keeps emotions out of the decision.
Three ways to set SL:
Technical SL – based on chart levels (support/resistance, trendline, swing highs).
Volatility SL – using ATR to adapt SL to market conditions.
Money-based SL – based on a fixed rupee or percentage loss.
A trade without SL is gambling.
3. Risk-to-Reward Ratio (RRR / R:R)
The RRR tells how much you stand to gain versus how much you risk.
General rule: Take trades only with RRR ≥ 1:2.
Examples:
You risk ₹1,000 → try to make ₹2,000.
You risk 10 points → target 20 points.
Even with a 40% win rate, a 1:2 RRR can make you profitable.
4. Avoiding Over-Leveraging
Leverage increases buying power—but also increases risk.
Beginners blow up accounts due to excessive leverage in futures/options.
Risk management says:
✔ Use leverage only when you understand risk
✔ Never use full margin
✔ Reduce position size during high volatility events (Fed meet, RBI policy, Budget, elections)
5. Diversification
Do not put all capital into one trade or one sector.
If you trade equities: diversify across sectors.
If you trade F&O: avoid multiple trades highly correlated with each other.
Example:
Bank Nifty long + HDFC Bank long → same directional risk.
6. Probability & Expectancy
Great traders think in probabilities, not predictions.
Expectancy = (Win% × Avg Win) – (Loss% × Avg Loss)
If expectancy is positive, long-term profitability is possible even with fewer winning trades.
2. Understanding Money Management in Trading
Money management is broader than risk management.
It focuses on:
👉 “How do I grow my account safely, steadily, and sustainably?”
Money management includes capital allocation, compounding, profit withdrawal strategy, and exposure limits. It is the long-term engine that helps traders survive for years.
2.1 Key Elements of Money Management
1. Capital Allocation
Avoid using all capital for trading.
Recommended:
Active Capital: 50% (for trading)
Buffer Capital: 30% (emergency, margin calls, drawdowns)
Long-term Investments: 20%
This protects you from unexpected drawdowns or market crashes.
2. Exposure Control
Exposure refers to how much of your capital is at risk across all open trades.
Examples:
Equity traders should avoid more than 20–30% exposure to a single sector.
Derivative traders must avoid multiple positions in the same direction.
For small accounts, 1–2 open trades at a time are ideal.
3. Scaling In & Scaling Out
Scaling techniques help manage profits better.
Scaling In:
Enter partially and add if the trade goes in your favour.
Example: 50% quantity at breakout → 50% on retest.
Scaling Out:
Book partial profits to secure gains.
Example: Book 50% at target 1 → trail SL → exit remaining at target 2.
Scaling reduces overall risk.
4. Compounding Strategy
Money management encourages growth through compounding.
Avoid jumping position sizes drastically.
Increase sizes only after:
✔ Consistent profitability for 20–30 trades
✔ Stable win rate (50–60%)
✔ Maximum drawdown below 10%
Slow compounding beats emotional overtrading.
5. Profit Withdrawal Strategy
Traders should withdraw part of their profits monthly.
Example:
70% reinvest
30% withdraw as real income
This protects you from reinvesting everything and losing it later.
6. Maximum Drawdown Control
Drawdown is the decrease from the peak equity curve.
A good trader keeps drawdown below 10–20%.
If drawdown exceeds limit:
✔ Reduce position size
✔ Stop trading for 1–2 days
✔ Re-evaluate strategy & psychology
This prevents account blow-ups.
3. Psychological Role in Risk & Money Management
Emotions can destroy even a perfect trading system.
Poor discipline leads to revenge trading, overtrading, removing stop losses, and taking oversized positions.
To stay disciplined:
Follow your trading plan
Accept losses as business expense
Do not chase profits
Maintain a trading journal
Review every trade weekly
Consistency comes from discipline—not predictions.
4. Practical Framework for Risk & Money Management
Here’s a step-by-step real-world plan:
Step 1: Define risk per trade
Risk 1% of capital per trade.
₹1,00,000 capital → ₹1,000 max risk.
Step 2: Decide stop-loss level
Use technical or volatility-based SL.
Example: SL = ₹10 away.
Step 3: Calculate position size
Position size = Risk ÷ SL
= 1000 ÷ 10
= 100 shares
Step 4: Set risk–reward
Aim for 1:2.
Target = 20 points.
Step 5: Avoid correlated trades
Do not buy Reliance + BPCL + IOC (same sector risk).
Step 6: Track overall exposure
Keep exposure under 25–30%.
Step 7: Handle profits wisely
Withdraw monthly profits.
Do not increase lot size until consistent.
Step 8: Manage drawdowns
If account falls 10–15%, reduce size by 50%.
Do not increase until account recovers.
5. Why Risk & Money Management Determine Long-Term Success
Most traders lose money not because they lack strategy, but because:
❌ They risk too much
❌ No SL or wide SL
❌ Overtrade after losses
❌ Use 10x–25x leverage blindly
❌ Increase lot size emotionally
❌ Chase market noise
Winning traders do the opposite:
✔ They limit losses
✔ Protect capital
✔ Aim for high RRR
✔ Stay patient
✔ Grow capital slowly
✔ Follow system like a business
Trading success is 10% strategy, 20% psychology, and 70% risk & money management.
Final Words
Risk Management keeps you alive,
Money Management helps you grow.
Together, they form the backbone of professional trading. The markets reward traders who think long term, manage risk smartly, and treat trading as a business—not a gamble. If you master these two pillars, even an average strategy can become consistently profitable.

Futures & Options (F&O) Trading1. What Are Derivatives?
A derivative is a contract whose value “derives” from an underlying asset such as:
Stocks
Indices (Nifty, Bank Nifty)
Commodities (Gold, Crude Oil)
Currencies (USD/INR)
Derivatives allow traders to take positions on the future price of an asset without owning it. The main types of derivatives are Futures and Options.
2. Futures Trading
2.1 What Is a Futures Contract?
A Future is a legally binding agreement to buy or sell an asset at a predetermined price on a future date.
Example:
A Nifty Futures contract expiring in January obligates you to buy or sell Nifty at an agreed price on the expiry date.
2.2 Key Features of Futures
Obligation
Both parties must fulfill the contract on expiry (unless squared off).
Standardized Contracts
Exchanges predetermine lot sizes, expiry dates, and contract specifications.
Mark-to-Market (MTM)
Daily profits and losses are settled automatically based on price movement.
Margin-Based Trading
You don’t pay full contract value — only ~10–15% margin is required.
High Leverage
Because of margin, returns (and losses) can be amplified.
2.3 How Futures Trading Works
Suppose Bank Nifty is at 49,000.
You buy a Bank Nifty Future at 49,100.
If Bank Nifty rises to 49,500, your profit is:
Lot size × 400 points
(Example: If lot size = 15 → profit = 400 × 15 = ₹6,000)
If Bank Nifty falls to 48,700, you incur a loss.
Thus, futures trading is a pure directional bet.
2.4 Why Traders Use Futures
Speculation on price movement
Hedging existing stock positions
Arbitrage opportunities
High liquidity, especially in index futures
3. Options Trading
Options are more flexible than futures. They provide rights, not obligations.
3.1 What Is an Option?
An Option is a contract that gives the buyer the right, but not the obligation, to buy or sell an asset at a preset price (strike price) before expiry.
There are two types:
Call Option (CE) → Right to buy
Put Option (PE) → Right to sell
Options come in two roles:
Option Buyer (pays premium, limited risk)
Option Seller / Writer (receives premium, unlimited risk)
3.2 Call Options (CE)
A Call Option buyer expects the price to rise.
Example:
You buy Nifty 22000 CE for ₹100 premium.
If Nifty moves above 22000 + 100 = 22100, you start profiting.
If Nifty stays below 22000, your maximum loss = premium paid (₹100 × lot size).
3.3 Put Options (PE)
A Put Option buyer expects the price to fall.
Example:
You buy Bank Nifty 49000 PE for ₹150 premium.
If Bank Nifty drops below 49000 – 150 = 48850, you profit.
Loss is limited to premium paid if the market moves up.
4. Option Greeks (Quick Understanding)
Options pricing is influenced by:
Delta – direction sensitivity
Theta – time decay
Vega – volatility sensitivity
Gamma – acceleration of delta
Rho – interest rate impact (low impact in India)
For beginners:
Buyers lose money due to Theta (time decay).
Sellers earn money from Theta, but face unlimited risk.
5. Expiry, Lot Size, and Margin
Expiry
F&O contracts come with fixed expiry dates:
Weekly expiry – Index options (Nifty, BankNifty, etc.)
Monthly expiry – Stock options & futures
Lot Size
Each contract has a fixed lot size. Example:
Nifty lot = 25
Bank Nifty lot = 15
Reliance lot = 250
Margin
Futures require margin (~10–20% of contract value).
Option buyers pay premium only.
Option sellers need large margin because risk is unlimited.
6. F&O Strategies
6.1 Futures Strategies
Long Future (bullish)
Short Future (bearish)
Hedging (using futures to protect holdings)
6.2 Options Strategies (Beginner to Advanced)
Beginners
Long Call
Long Put
Protective Put (hedging)
Covered Call (safe premium strategy)
Intermediates
Bull Call Spread
Bear Put Spread
Iron Butterfly
Straddle
Strangle
Advanced
Iron Condor
Calendar Spread
Ratio Spreads
Delta-neutral strategies (used by professional traders)
7. Why F&O Trading Is Popular in India
High Leverage → Higher Profit Potential
Low Capital Requirement
Weekly Profits from Index Options
Huge Liquidity in Nifty & Bank Nifty
Perfect Tool for Hedging Stock Portfolio
8. Risks in F&O Trading
F&O provides opportunities, but it also carries high risk, especially for beginners.
8.1 Leverage Risk
Small price movements can cause big losses.
8.2 Time Decay in Options
Option buyers lose money if price doesn’t move quickly.
8.3 Volatility Crush
Premium collapses after major events (election, budget).
8.4 Unlimited Losses for Sellers
Option writers face unlimited losses if market moves sharply.
8.5 Liquidity Risk
Stock options may have low liquidity → high slippage.
8.6 Psychological Pressure
Fast price movements create stress, leading to impulsive decisions.
9. Best Practices for Successful F&O Trading
1. Never Trade Without a Stop-Loss
Controls losses and preserves capital.
2. Position Sizing Is Key
Avoid putting entire capital in one trade.
3. Understand Greeks Before Doing Complex Option Strategies
4. Avoid Over-Leveraging
5. Backtest & Practice on Paper Trades
6. Trade Only Liquid Contracts
Index options are safer than illiquid stock options.
7. Hedge Your Positions
Professional traders always hedge.
8. Keep Emotions in Check
Discipline matters more than strategy.
10. F&O Example for Better Understanding
Let’s say Nifty is at 22,000.
Scenario 1: Long Future
Buy Nifty Future at 22,050
Lot size 25
Market moves to 22,250
Profit = 200 × 25 = ₹5,000
But if market falls to 21,900:
Loss = 150 × 25 = ₹3,750
No limit unless stop-loss applied
Scenario 2: Buy a Call Option (22,100 CE @ ₹80)
Total cost = 80 × 25 = ₹2,000
If Nifty moves to 22,300:
Intrinsic value = 200
Profit = (200 – 80) × 25 = ₹3,000
If Nifty stays below 22,100:
Loss = ₹2,000 (limited)
Scenario 3: Sell a Call Option (22,300 CE @ ₹60)
If Nifty stays below 22,300:
Profit = premium earned = ₹1,500
If Nifty shoots up to 22,800:
Loss = (500 – 60) × 25 = ₹11,000
Loss is unlimited. Hence selling options requires skill & hedging.
11. Who Should Trade F&O?
Suitable for:
Experienced traders
People who understand price action & volatility
Hedgers
Option sellers with adequate capital
Not suitable for:
Beginners with no risk management
People trading emotionally
Traders who cannot monitor markets
12. Conclusion
Futures & Options (F&O) trading is a powerful segment of the market that offers leverage, flexibility, and opportunities for hedging and speculation. Futures provide high leverage and mandatory execution, while options offer rights with limited risk for buyers and premium income for sellers. Successful F&O trading requires understanding of contract specifications, market psychology, volatility, Greeks, and strict risk management.
If traded responsibly, F&O can enhance returns and provide sophisticated strategies. If traded without knowledge or discipline, it can lead to large losses. The key is education, practice, and risk control.
Part 10 Trade Like InstitutionsBear Put Spread – Best for Mild Downtrend with Controlled Risk
Same concept but for bearish conditions.
How it works
Buy a lower strike put.
Sell a farther out-of-the-money put.
When to use
Expect small to moderate fall.
Want low risk and fixed cost.
Risk and reward
Risk: Limited to net debit (premium).
Reward: Limited but predictable.
Example
Buy Bank Nifty 49,000 PE at ₹150
Sell 48,800 PE at ₹70
Net premium = ₹80
Max profit = 200 – 80 = ₹120

PSU & Infrastructure RallyIntroduction
The Indian stock market often moves in cycles—sometimes technology stocks lead, sometimes consumption stocks take the front seat, and sometimes financials dominate the headlines. In recent years, one of the strongest and most eye-catching trends has been the rally in Public Sector Undertakings (PSUs) and Infrastructure stocks.
This rally has surprised many investors. For decades, PSU stocks were treated as “slow movers,” known for dividends but not for sharp price appreciation. Infrastructure companies also had their share of challenges—debt burdens, project delays, and regulatory hurdles. Yet, from 2020 onwards, both these sectors have staged a powerful comeback, creating significant wealth for investors.
In this essay, we will break down the reasons behind the PSU & Infrastructure rally, the role of government policies, investor psychology, macroeconomic conditions, and future outlook. We will also examine challenges, risks, and strategies investors can consider.
1. Understanding PSU & Infrastructure Sectors
1.1 What are PSUs?
Public Sector Undertakings (PSUs) are companies where the Government of India holds a majority stake (usually above 51%). These companies were originally created to control strategic industries, ensure employment, and provide services to the public.
They operate across sectors:
Energy & Oil: ONGC, Oil India, IOC, BPCL, HPCL.
Banking & Financials: SBI, Bank of Baroda, PNB, LIC.
Power & Utilities: NTPC, Power Grid, NHPC, SJVN.
Defence & Engineering: HAL, BEL, BEML, Cochin Shipyard.
Infrastructure-linked: IRCTC, IRFC, RVNL, NBCC.
For a long time, PSU stocks were considered "value traps." Investors believed these companies were controlled by government decisions rather than pure profit motives. But things have started to change.
1.2 What is the Infrastructure Sector?
The infrastructure sector includes companies involved in building and maintaining physical systems like roads, railways, airports, ports, bridges, housing, water supply, and energy projects.
Key players include:
Construction companies: L&T, NCC, KNR Construction.
Railways & Transport: RVNL, IRCON, IRFC.
Power & Energy Infrastructure: NTPC, Adani Transmission, Power Grid.
Cement & Steel (linked to infra growth): UltraTech Cement, JSW Steel.
Infrastructure is often called the backbone of the economy. A country’s GDP growth depends heavily on the quality of its infrastructure.
2. Why Are PSU & Infrastructure Stocks Rallying?
The rally is not a coincidence. Several structural, policy-driven, and global factors are working together. Let’s break them down:
2.1 Government Push on Capital Expenditure (Capex)
One of the biggest drivers is the Indian government’s consistent increase in infrastructure spending.
In Union Budgets (2022–2025), capital expenditure has grown at double-digit rates.
The government has allocated massive funds for roads, highways, railways, and renewable energy.
The National Infrastructure Pipeline (NIP) plans ₹111 lakh crore investment in infrastructure between 2019 and 2025.
Programs like Gati Shakti, Smart Cities Mission, and Bharatmala are boosting construction activity.
This creates a multiplier effect: cement demand rises, construction companies get more projects, railway stocks gain, and PSU banks benefit by financing these projects.
2.2 Revival of PSU Banks
PSU banks, once seen as weak due to Non-Performing Assets (NPAs), have staged a dramatic recovery.
Bad loans have reduced significantly.
Credit growth is at record highs (double-digit growth in 2023–25).
PSU banks are reporting all-time high profits.
With financial health improving, investors’ confidence in PSUs has returned.
Since banks are the backbone of financing infrastructure projects, their revival further fuels the rally.
2.3 Defence & Strategic Importance
Global geopolitical tensions have increased defence spending worldwide. India, too, is focusing on self-reliance in defence (Atmanirbhar Bharat).
Companies like HAL, BEL, Mazagon Dock, Cochin Shipyard have seen massive order inflows.
Defence PSUs are reporting strong earnings and full order books for the next decade.
The export market is also opening up—India is now exporting defence equipment to friendly nations.
This has turned defence PSUs into multi-baggers in recent years.
2.4 Disinvestment & Privatisation Story
For years, the government has been trying to monetise and privatise PSU assets.
Strategic sales like Air India have boosted sentiment.
LIC IPO brought renewed attention to PSU space.
The market believes future disinvestments (BPCL, Shipping Corporation, etc.) can unlock hidden value.
This narrative has created speculative interest, which supports price rallies.
2.5 Dividend Yield Attraction
Many PSU companies offer very high dividend yields (4–8%), much higher than bank deposits.
In times of global uncertainty, foreign investors look for safe, stable income—PSUs fit this profile. When combined with growth in earnings, dividend-paying PSUs become doubly attractive.
2.6 Railways & Infra Boom
Railway-linked stocks like RVNL, IRCON, IRFC, RailTel have been some of the biggest gainers.
Indian Railways is undergoing modernization at an unprecedented scale.
Projects like Vande Bharat trains, electrification, freight corridors, and station redevelopment are attracting massive investments.
These companies are reporting record order books.
This has triggered a railways mini-rally within the broader infrastructure rally.
2.7 Global Factors
Global trends are also playing a role:
China+1 Strategy: Many global companies are diversifying away from China, boosting demand for Indian infrastructure.
Commodity Cycle: Steel, cement, and energy cycles support infra companies’ growth.
Geopolitical Risks: Investors view India as a safe growth story compared to volatile markets.
3. Investor Psychology Behind the Rally
The PSU & Infrastructure rally is not just about fundamentals—it’s also about changing perceptions.
Earlier: Investors believed PSUs = inefficient + slow-moving.
Now: Investors see them as undervalued, dividend-paying, and backed by government growth plans.
Retail investors, especially in India, have driven momentum. With railway and defence PSUs showing 10x to 20x returns in a few years, fear of missing out (FOMO) has pulled in more buyers.
4. Risks & Challenges in PSU & Infra Rally
No rally is risk-free. Investors must remain aware of challenges:
Government Interference – PSU companies may prioritize social objectives over profits.
Cyclical Nature – Infra and PSU rallies depend heavily on government spending; if budgets tighten, growth may slow.
Execution Delays – Infra projects face land acquisition, legal, and environmental delays.
Global Slowdown – If global demand weakens, exports and commodity-linked infra stocks may suffer.
Valuation Concerns – Many PSU stocks have already rallied 200–500%. At some point, valuations may look stretched.
5. Future Outlook
Despite risks, the outlook for PSU & Infrastructure remains structurally positive:
India aims to become a $5 trillion economy—this is impossible without strong infra.
The government’s focus on Make in India, Atmanirbhar Bharat, and Defence exports supports PSU companies.
Digital infrastructure (5G rollout, Smart Cities) creates new opportunities.
Renewable energy push (solar, wind, hydro) benefits power PSUs like NTPC, NHPC.
In short, this is not just a short-term rally—it is a structural growth story with long-term potential.
6. How Investors Can Approach This Rally
For investors, the key is to approach with strategy and caution:
Focus on Leaders – Instead of chasing every PSU, stick to strong companies with robust fundamentals (SBI, NTPC, BEL, HAL, RVNL, L&T).
Look for Long-Term Themes – Defence, railways, power transmission, renewable energy are structural stories.
Dividend + Growth Combo – PSUs with both high dividend yields and growth potential are safer bets.
Avoid Overvaluation – Don’t enter after massive rallies; wait for corrections.
Diversify – Mix infra PSUs with private players (like L&T, Adani Ports) to reduce risk.
7. Case Studies of Recent Winners
7.1 Hindustan Aeronautics Ltd (HAL)
Once ignored, HAL is now a defence giant with export opportunities.
Stock has given 10x returns in 5 years.
7.2 Rail Vikas Nigam Ltd (RVNL)
Benefited from railway modernization.
Stock surged over 20x from 2020–2025.
7.3 SBI & Other PSU Banks
Recovered from NPAs.
Posting record profits, stock prices doubled/tripled.
7.4 NTPC & Power Grid
Benefiting from India’s massive renewable energy targets.
Stable dividend + growth.
These examples show why the rally has captured public attention.
8. Conclusion
The PSU & Infrastructure Rally is one of the most defining themes in the Indian stock market in recent years. What began as a quiet recovery in undervalued PSU banks and infra companies has turned into a full-blown rally fueled by:
Government capex push,
Defence modernization,
Railway expansion,
Revival of PSU banks,
Strong dividend yields,
Disinvestment hopes.
The rally has redefined investor sentiment towards PSUs, turning them from neglected assets into market favorites.
That said, investors must remain mindful of risks—government policies, project delays, or global slowdowns can temporarily derail the momentum.
But structurally, the story remains strong: India’s journey to a $5 trillion economy cannot happen without PSU & infrastructure growth. For long-term investors, this space offers both stability and growth potential—a rare combination.
Quick Trade Setup in EURCAD It is forming quick trade setup in eurusd forming ABC flat pattern if it breakout then target entry and exit should be given below -
Trade Details -
Entry - 1.47169
Target - 1.47719
Stoploss - 1.46926
when your trade goes in your favour, please keep you stoploss trailing
