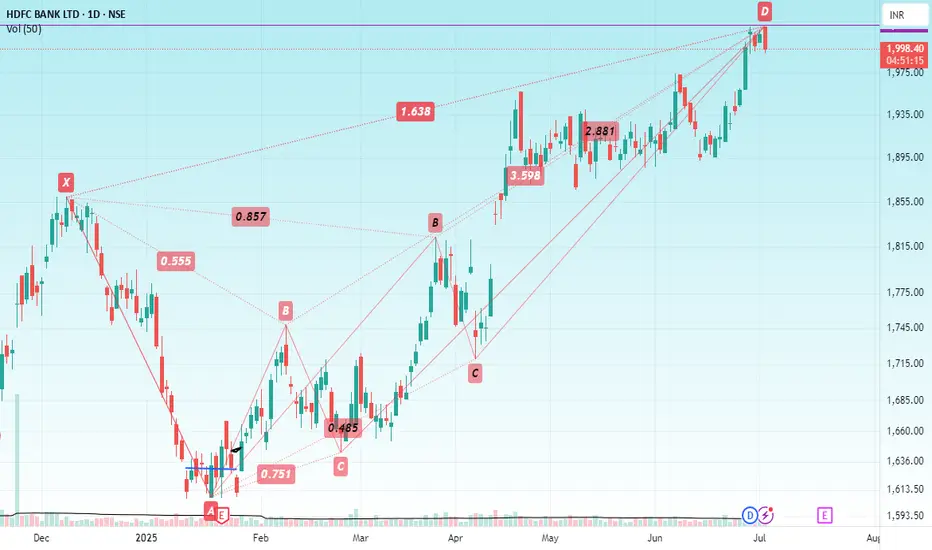
HDFC BANKHello & welcome to this analysis
It has made double bearish Harmonic patterns at the same PRZ level - Crab & Deep Crab in the daily time frame with so far today's candle being an Open = High in daily time frame.
A retracement till 1950 - 1875 could be possible as long as the stock does not cross 2050.
A heavyweight in both Nifty & Bank Nifty, it could halt the uptrend of both the indexes either till it does not complete its pullback or the patterns get negated.
All the best
Crabpatterns
ICICI BANKHello & welcome to this analysis
A bearish Harmonic Crab pattern has been activated in the daily time frame suggesting downside levels till 1350-1300 probable if it starts sustaining below 1390 which is a line of support as of now.
Its made a gap down today, any pullback till the gap area could witness another round of selling.
The pattern negates above 1465

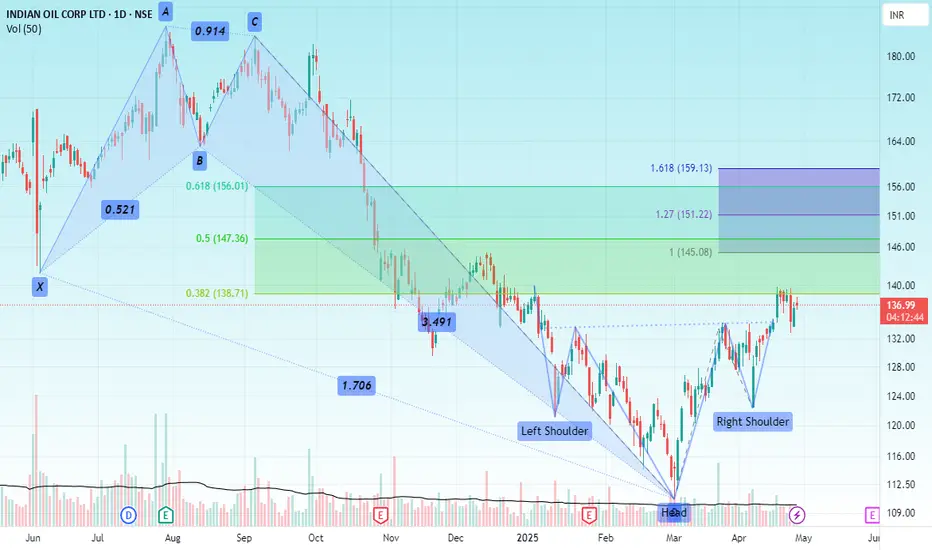
IOCHello & welcome to this analysis
A deep 6 months correction lead to the formation of a Bullish Harmonic Crab pattern in March 2025 post which during accumulation (consolidation) phase formed an Inverse Head & Shoulder.
A 38% retracement of the bullish harmonic pattern has been done and now its completing a pullback of the IHS breakout by retesting the neckline.
Potential upside levels are 145 and 160 for both the IHS & Bullish Harmonic Crab
All the best
Dollar IndexHello and welcome to this analysis
With FED all set to start the rate cut cycle from today's FOMC meet, DXY is expected to enter the potential reversal zone (PRZ) of not one but two bullish Harmonic patterns, namely, bullish AB=CD and bullish Crab, likely forming a triple bottom in the weekly time frame.
The PRZ is between 100 - 99.60 while the patterns would be considered invalid below 99.50, for a possible bounce (if not reversal) till 103.
When will it enter the PRZ by? Will depend totally on hawkish/dovish, FED Chairman Jeremy Powell is in his statement today.
Regards

ANGEL ONE 2600 ?As per harmonic we can calculate there is high chances of breaking all time high in this stock, we can see double bottom in this particular stock. In upcoming das we can see 2600 in this particular stock, lets accumulate this stock

NIFTYHello & Welcome to this analysis
GIFT NIFTY 4 hourly chart in the PRZ of two bullish Harmonic Patterns - Alt Bat and Crab.
The Alt Bat gets negated below 19200 while the Crab gets negated below 19150.
Sustaining above 19350 the probability of a rally/bounce would be high.
Regards

#AARTIIND LongAARTI INDUSTRIES creating a wonderful opportunity for a LRHR trade setup with only one down leg pending. Considerable buying range is 450-440 with a stoploss of 425. The Double zig-zag corrective waves is in its final leg supported by a classic Gartley harmonic pattern and also a classic crab in DTF.

lichsng gartley seems failed, crab in progressharmonic pattern
lichsng
no reversal yet from gartley prz
below x point has strong probability for crab prz placed at d point

NIFTY 50 DECEMBER 2022 VIEW red zone are PRZ zone where it will act as resistance and green zone is support zone
Thanks

ASIAN PAINTS PRICE ACTION ANALYSIS. Asian Paints has crossed 3163 levels with high volumes after breaking the demand zone 2. For a better risk-reward ratio, we can wait for a pullback until 3163, which is expected to act as good support.
Place your stop loss level below the demand zone 2.
The XABCD bearish crab pattern sets a 1.618 fib extension level as a profit booking level for longs. Book your profits here and wait for the price action for a new position.
All the levels and information is mentioned on the chart as well.
Happy trading :)
This is just for educational purposes. Trade responsibly with proper financial advice.

Berger Paint good short candidate.Berger Paints Spot CMP :- 735
Bearish Crab Pattern formation :-
PRZ zone :- 726-738 levels.
SLZ zone :- 760 levels
1.618 XA :- 726 level
2.618 BC :- 738
Elliot Wave Study :- Currently counter is trading in impulse wave 3 of impulse phase.. At the moment wave 3 have extension of 2% of wave 1 which is around 745 levels.. if wave 4 unfolds from this levels retracement till levels of 660-620 possible.
Chart Pattern :- Rising parallel channel , Currently counter is trading around resistance trend line of rising channel pattern,, if unable to sustain around this levels and fall to mid line and lower support line of channel.
RSI :- Price is making higher high and RSI is making lower high, bearish divergence..
Good short candidate.....

