XRP/USDT Potential Reversal Zone — “Bottom Tested, Bullish!📉 Chart Analysis Summary
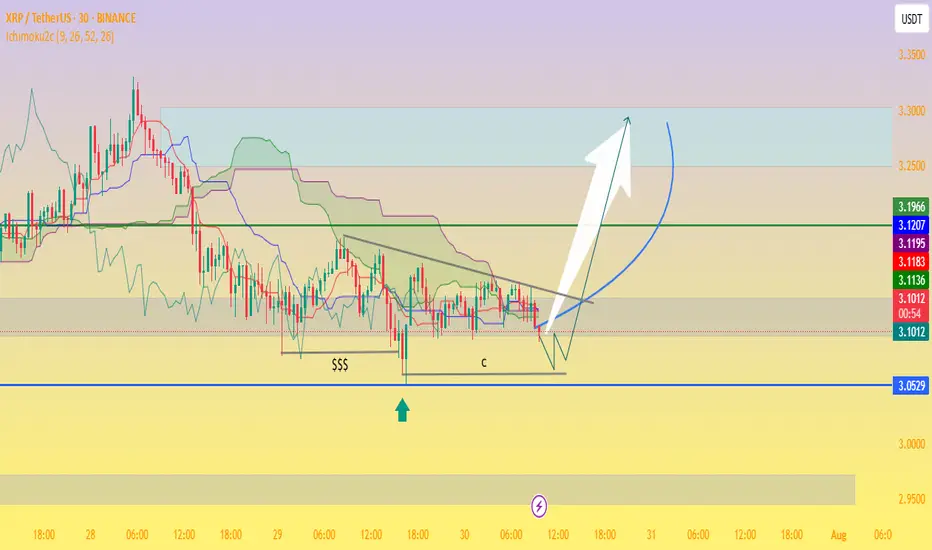
The divided chart indicates XRP trading between a critical support zone near $3.05–$3.09 and overhead resistance around $3.19–$3.23, forming what could be a bullish pennant or descending wedge setup on the 30-minute timeframe:
Support Zone (~$3.05–$3.09):
Price retested this level multiple times (labeled as “$$$” and “c”), clearly identifying a demand zone.
Ichimoku cloud support lies nearby, adding technical relevance to the floor.
Resistance Trendline & Green Line (~$3.19–$3.23):
A descending trendline is visible, showing lower highs and building compression.
A breakout above this resistance zone is necessary to signal bullish continuation.
Projected Path:
The schematic arrow suggests a bounce off support, followed by consolidation, and then a breakout above resistance, targeting the $3.25–$3.30+ zone and potentially higher.
🔍 Context from Recent Market Commentary
Support Holding Above $3.11–$3.15: Analysts highlight strong support around $3.11–$3.15, where institutional and retail interest appears concentrated
TradingView
+13
TradingView
+13
CoinCentral
+13
.
Resistance & Consolidation at $3.30: While XRP briefly surpassed $3.30, it encountered rejection and remains rangebound. A confirmed break beyond this level could validate the bullish carry-forward
CryptoPotato
CoinDesk
.
Wave-Elliott Bull Case: Various Elliott Wave scenarios forecast targets as high as $5.25, $6.85, or even $10–$15 should Wave 5 materialize, though this depends on market strength and momentum
CoinCentral
.
✅ Trading Outlook
Bullish Scenario:
Bounce off $3.05–$3.15 support.
Break above $3.23–$3.30 resistance.
Potential upside targets:
Near term: $3.30–$3.40.
Medium term: $4.64 or $5–$6, with strong case for $6.85 if momentum and on-chain demand strengthen
CryptoPotato
+15
TECHi
+15
CoinGape
+15
.
Bearish Scenario:
Failure to hold $3.05–$3.11 risk retest toward $2.95 or lower zones ($2.30–$2.70)
TECHi
.
🧭 What to Watch
Key Level Role
$3.05–$3.11 Critical support/demand zone
$3.19–$3.23 Short‑term resistance/framing compression
~$3.30+ Confirm bullish breakout — key trigger for Wave 5 and higher targets
🧠 Overall Take
This chart is painting a classic consolidation near strong support with a visible descending upper boundary. If XRP holds the ~$3.05 zone and breaks above $3.23–$3.30 with conviction, it could initiate a bull move toward $3.40–$4.00, and potentially even $5–$6+ depending on volume and momentum.
However, breaks below $3.11 may open deeper downside risk. For many traders, this is a simple risk-reward setup: entry near the lower channel with a stop under $3.05 and initial profit targets at $3.30–$3.40.
Crpytocurrency
QUICKUSDT - FALSE BREAKOUT OF RESISTANCESymbol - QUICKUSDT
CMP - 0.0290
QUICKUSDT is currently exhibiting a counter-trend move toward the resistance level within the range of 0.0295, A false breakdown of this key level has occurred amidst the prevailing downtrend.
The cryptocurrency market is undergoing a period of significant challenges. While Bitcoin is testing new lows around 77K, altcoins are continuing their downward trajectory in search of additional support levels. Notably, QUICKUSDT stands out by testing a strong resistance/liquidity zone between 0.0284 and 0.0295, where a false breakout is forming.
However, in the morning session, Bitcoin shows signs of strengthening after a substantial decline, potentially exerting upward pressure on the broader market. As such, prior to any further decline, there may be another attempt to retest the 0.0295 level or update the false breakout tail around 0.0300 (0.7 Fibonacci retracement)
Key resistance levels: 0.0285, 0.0295, 0.0300
Key support levels: 0.0243, 0.0211
Should the next resistance retest result in a false breakdown with price consolidation below 0.0295, QUICK coin could continue its decline in the short to medium term.

Crypto Total Market Cap: Ready for expansion to $5 Trillion!⚡️Price Analysis:
1️⃣ Trendline Support.
2️⃣ The overall structure is Bullish.
3️⃣ Price showing bounce from EMAs
4️⃣ BO & RT done of the previous ATH level.
✨ Key Observations:
➡️ Expecting price to push higher to form a higher high.
➡️ Currently, RRR is very attractive
➡️ Good momentum post 3 trillion mark can be seen
⚠️ Disclaimer: This is NOT a buy/sell recommendation. This post is meant for learning purposes only. Views are personal. Please do your due diligence before investing. Also, Crytos are highly volatile assets; act accordingly & manage your risk always.⚠️
💬 What's your view on cryptocurrencies? ✌️
🔥Happy Trading!✅🚀

bitcoin trader ready for next rundear crypto lover plase not and ad alreat for next trade thid is a perfact entry for next

XRP RIPPLE HUGE MOVE IS COMING NOW LETS TRY TO PREDICT ITRIPPLE AND ICHIMOKU CLOUD CONFUCUENCE TRADE I.E CROSS OVER TO THE UPSIDE AFTER A STRONG DOWNTREND IS ALMOST 100% SURE TO GIVE YOU HUGE MOVES SCROLL THE CHART TO SEE ,NOW WE ARE IN A STRONG DOWTREND FOR A WHILE AND THE CLOUD IS RED TOO FOR A SIGN TO BUY THE XRP WE HAVE TO CLOSE ABOVE THE CLOUD IN A CANDLESTICK CHART SO WE CAN GO IN THE TRAD E NOW LETS PLAY THE PAITENCE GAME

