Cryptocurrency and Blockchain TradingIntroduction
Cryptocurrency and blockchain trading represent a transformative evolution in global financial markets. Unlike traditional fiat currencies governed by central banks and financial institutions, cryptocurrencies operate on decentralized networks built on blockchain technology. This paradigm shift has created unique opportunities and challenges for traders, investors, and institutions worldwide.
At its core, cryptocurrency trading involves buying, selling, and exchanging digital assets, often with the goal of making profits from price fluctuations. Blockchain technology, the underlying framework for cryptocurrencies, ensures transparency, security, and decentralization, enabling peer-to-peer transactions without intermediaries.
This article explores the principles, mechanisms, strategies, and risks involved in cryptocurrency and blockchain trading, offering a detailed guide for beginners, intermediate, and advanced market participants.
Understanding Cryptocurrencies
Definition and Characteristics
A cryptocurrency is a digital or virtual currency that uses cryptography for security and operates on a decentralized ledger called a blockchain. The defining characteristics include:
Decentralization: No single entity controls the network. Decisions are made through consensus mechanisms.
Security: Cryptographic algorithms secure transactions and wallets, making fraud extremely difficult.
Transparency: Blockchain ensures that all transactions are visible to participants, enhancing trust.
Limited Supply: Many cryptocurrencies, like Bitcoin, have a capped supply, creating scarcity that can influence value.
Programmability: Smart contracts enable programmable transactions, automatically executing when predefined conditions are met.
Popular Cryptocurrencies
Bitcoin (BTC): The first and most valuable cryptocurrency, often regarded as digital gold.
Ethereum (ETH): Known for its smart contract capabilities and decentralized applications (dApps).
Ripple (XRP): Focused on cross-border payments and banking solutions.
Litecoin (LTC): A faster, lighter alternative to Bitcoin for peer-to-peer transactions.
Binance Coin (BNB): Initially used for exchange fee reductions on Binance, now powering multiple DeFi applications.
Blockchain Technology: The Backbone
How Blockchain Works
A blockchain is a distributed digital ledger that records transactions across multiple computers. Key components include:
Blocks: Data structures that store transaction records.
Chains: Blocks are linked sequentially, forming a chain. Each block contains a cryptographic hash of the previous block, ensuring integrity.
Nodes: Computers participating in the network that validate and store blockchain data.
Consensus Mechanisms: Protocols like Proof of Work (PoW) and Proof of Stake (PoS) ensure agreement on the blockchain's state.
Benefits for Trading
Security: Immutable records prevent fraud and manipulation.
Transparency: Publicly accessible ledgers allow traders to verify transactions.
Efficiency: Automated smart contracts reduce reliance on intermediaries.
Global Reach: Cryptocurrencies are borderless, allowing participation across nations.
Cryptocurrency Trading Explained
Cryptocurrency trading differs from traditional markets due to high volatility, continuous operation (24/7 trading), and unique technical dynamics.
Types of Cryptocurrency Trading
Spot Trading
Spot trading involves buying and selling cryptocurrencies for immediate settlement. Traders profit from price differences in the short term or long term. Exchanges like Binance, Coinbase, and Kraken facilitate spot trading.
Margin Trading
Margin trading allows traders to borrow funds to increase their market exposure. This amplifies both potential profits and losses. For example, using 10x leverage, a $1,000 investment controls $10,000 worth of crypto.
Futures Trading
Futures contracts are agreements to buy or sell cryptocurrency at a predetermined price on a future date. Platforms like BitMEX, Binance Futures, and Bybit provide derivatives markets. Futures trading enables speculation on price movements without owning the underlying asset.
Options Trading
Options give traders the right, but not the obligation, to buy or sell cryptocurrency at a set price within a specific period. This allows hedging and risk management strategies.
Algorithmic and Automated Trading
Bots and trading algorithms execute orders based on predefined strategies, such as arbitrage, trend-following, or market-making, enabling high-frequency trading and consistent execution.
Market Participants
Cryptocurrency trading involves diverse participants, each influencing market behavior differently:
Retail Traders: Individual investors seeking profit from short-term or long-term price movements.
Institutional Investors: Hedge funds, asset managers, and corporations investing in crypto assets, influencing liquidity and stability.
Market Makers: Entities providing liquidity by continuously buying and selling assets, reducing bid-ask spreads.
Speculators: Traders aiming to profit from volatility without necessarily believing in the long-term value of the asset.
Arbitrageurs: Traders exploiting price differences across exchanges for risk-free profit.
Key Factors Influencing Cryptocurrency Prices
Market Sentiment: News, social media, and influencer activity can dramatically affect prices.
Regulation: Government policies, legal status, and taxation of cryptocurrencies impact market confidence.
Technology Upgrades: Network updates, forks, and innovations influence asset value.
Liquidity and Market Depth: Higher liquidity reduces volatility, whereas low liquidity can amplify price swings.
Global Economic Factors: Inflation, fiat currency performance, and geopolitical events indirectly affect crypto markets.
Technical Analysis in Cryptocurrency Trading
Common Tools
Candlestick Patterns: Identify trends and reversals through patterns like doji, hammer, or engulfing candles.
Moving Averages (MA): Track average prices to determine trend direction. Popular types include SMA (Simple Moving Average) and EMA (Exponential Moving Average).
Relative Strength Index (RSI): Measures overbought or oversold conditions.
MACD (Moving Average Convergence Divergence): Identifies trend changes and momentum.
Fibonacci Retracements: Used to predict support and resistance levels.
Trading Strategies
Day Trading: Entering and exiting positions within a single day to profit from intraday volatility.
Swing Trading: Holding assets for days or weeks to capitalize on medium-term trends.
Scalping: Rapid, high-volume trades exploiting small price movements.
HODLing: Long-term holding based on belief in the asset’s future potential.
Fundamental Analysis
Fundamental analysis evaluates a cryptocurrency’s intrinsic value based on qualitative and quantitative factors:
Whitepapers: Documents detailing a project’s goals, technology, and tokenomics.
Development Team: Experienced and reputable developers increase project credibility.
Community Support: Active communities on forums, social media, and GitHub indicate long-term viability.
Partnerships and Adoption: Integration into businesses and financial systems enhances value.
Supply Mechanisms: Token supply, staking incentives, and burning mechanisms influence scarcity.
Risk Management in Cryptocurrency Trading
Due to extreme volatility, risk management is crucial:
Position Sizing: Limit exposure based on account size and risk tolerance.
Stop-Loss Orders: Automatically close positions to prevent excessive losses.
Diversification: Spread investments across multiple assets to reduce concentration risk.
Leverage Caution: High leverage can magnify losses; traders should use it judiciously.
Security Practices: Use hardware wallets, two-factor authentication (2FA), and secure exchanges.
Regulatory and Legal Considerations
Cryptocurrency trading regulations vary globally:
United States: Regulated by SEC, CFTC, and FinCEN, focusing on securities compliance and anti-money laundering.
European Union: Markets are gradually regulated under MiCA (Markets in Crypto-Assets Regulation).
Asia: Countries like Japan and Singapore have clear licensing frameworks, while India’s stance fluctuates.
Other Regions: Some nations ban crypto entirely, while others encourage innovation.
Traders must stay informed to comply with taxation, reporting, and legal requirements.
Emerging Trends
Decentralized Finance (DeFi): Peer-to-peer financial systems offering lending, borrowing, and staking opportunities.
Non-Fungible Tokens (NFTs): Unique digital assets creating new investment classes and liquidity opportunities.
Institutional Adoption: Companies adding crypto to balance sheets or offering trading platforms.
Layer-2 Scaling Solutions: Enhancements like Ethereum’s Polygon reduce fees and increase transaction speed.
AI-Driven Trading: Advanced algorithms analyzing market sentiment and predictive trends.
Challenges in Cryptocurrency Trading
Volatility: Rapid price swings can lead to significant losses.
Security Risks: Exchange hacks, phishing, and wallet theft remain major concerns.
Regulatory Uncertainty: Changing laws can disrupt markets and affect liquidity.
Liquidity Constraints: Low trading volume in certain coins can cause slippage.
Emotional Trading: Fear and greed often lead to irrational decisions.
Conclusion
Cryptocurrency and blockchain trading is a dynamic and rapidly evolving domain combining technology, finance, and human behavior. While it offers opportunities for significant profit, it carries substantial risk. Successful trading requires a blend of technical analysis, fundamental research, risk management, and regulatory awareness.
As blockchain adoption grows and institutional participation increases, cryptocurrency markets are likely to mature, offering more stability, innovative instruments, and integration into the broader financial ecosystem.
Traders who stay informed, disciplined, and adaptable are best positioned to navigate this revolutionary landscape. With proper education, robust strategy, and caution, cryptocurrency trading can transform from a speculative gamble into a structured, potentially rewarding endeavor.
Cryptocurrency
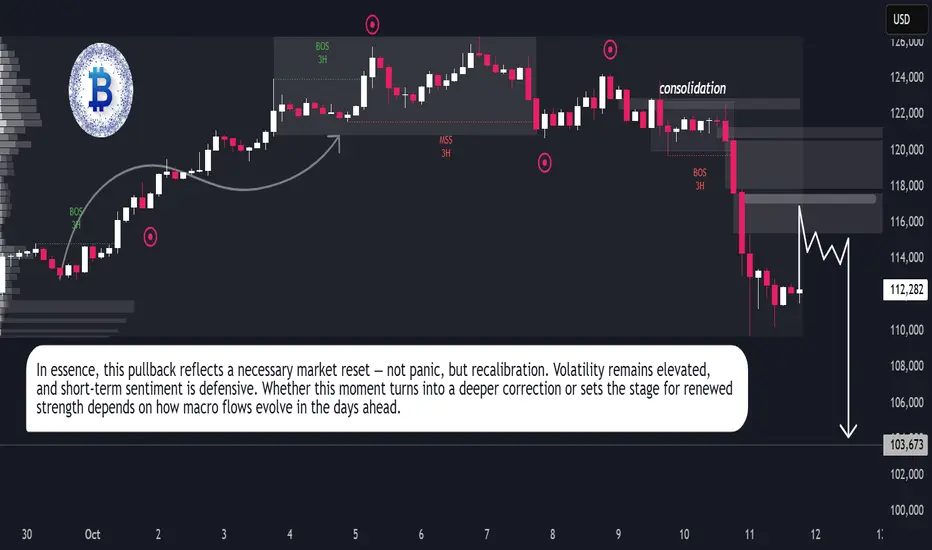
Bitcoin Faces Sudden Shakeout After Weeks of CalmBitcoin Volatility Returns as Market Momentum Resets
Hello Traders,
The Bitcoin market experienced a sudden burst of volatility in the recent session, ending a period of relative calm. On the 4H timeframe (Binance), intense selling pressure drove prices from near $117,000 down to roughly $109,000 before stabilizing around the $112K region. The swift decline marked a clear shift in short-term momentum, showing that buyers are beginning to lose dominance as broader market sentiment cools.
This pullback unfolded against a backdrop of renewed global uncertainty. A series of trade-related policy headlines reignited risk aversion, while continued strength in the U.S. dollar added additional stress to crypto markets. Institutional flows briefly reversed, signaling reduced confidence in near-term upside potential. The result was a wave of forced liquidations, magnified by leverage, as traders rushed to adjust exposure during the drop.
Despite the intensity of the move, market conditions remain structurally healthy. On-chain data shows that long-term holders are largely unmoved, suggesting this phase is more of a short-term repricing than a major cycle reversal. Derivative markets, however, have cooled significantly — open interest has thinned, and funding rates have normalized, indicating a temporary reset in speculative participation.
In the coming days, Bitcoin’s behavior will likely depend on liquidity dynamics rather than new macro data. With upcoming U.S. economic reports delayed and the dollar holding firm, volatility may persist as traders respond to headlines and reposition ahead of the next policy developments.
For now, the market appears to be in a state of balance after rapid liquidation. Whether this forms a new accumulation base or precedes deeper correction will depend on how quickly momentum returns. The broader sentiment remains cautious but stable — a waiting phase, as the market tests its conviction once more.
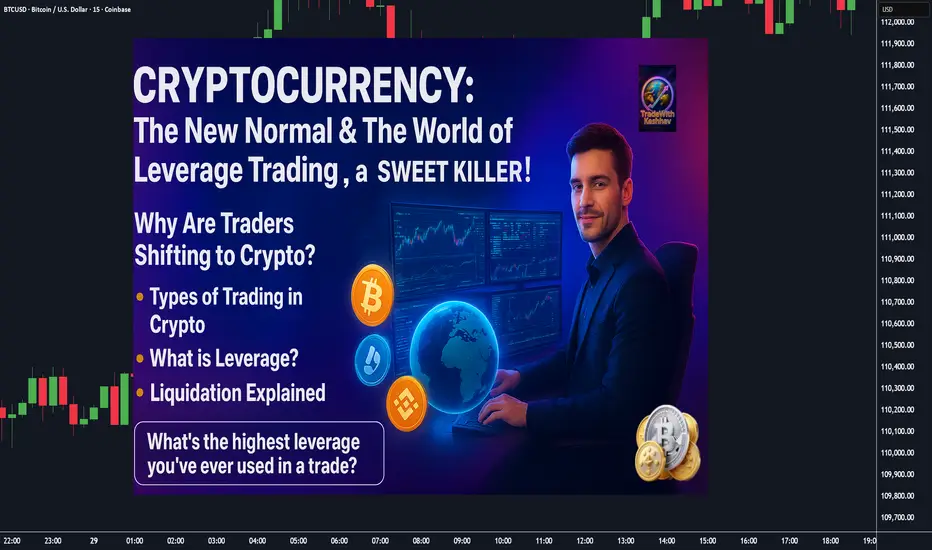
Cryptocurrency : The New Normal & The World of Leverage Trading.📌 Cryptocurrency: The New Normal & The World of Leverage Trading ⚔️ ( A Sweet Killer! )
🌍 Why Are Traders Shifting to Crypto? COINBASE:BTCUSD BITSTAMP:ETHUSD COINBASE:SOLUSD
✔️ Lower capital required compared to stocks
✔️ Fewer gaps (24/7 market = no overnight gap-up/down shockers)
✔️ High leverage opportunities (control bigger trades with smaller margin)
✔️ Global accessibility (Binance, Bybit, OKX, CoinDCX, Mudrex etc.)
📊 Types of Trading in Crypto
💠 **Spot Trading** → In India, 30% tax on capital gains ( check according to your country ).
💠 **Options & Futures** → Taxed as *Business Income* ( like F&O in stocks ). No flat 30% rule.
⚡ What is Leverage?
👉 Leverage means using *small capital* to control a *large trade size* , because the exchange lends you money.
Think of it like **margin trading** in stocks — but much more aggressive.
🔹 Example 1 : Normal Trade style ( No Leverage )
suppose you have 💰 Capital = ₹10,000
Bought BTC at Price = ₹10,000,000
* You can buy 0.001 BTC ( 10000 ➗ 10,000,000 ).
* If BTC rises 10% → Profit = ₹1,000 (+10%)
* If BTC falls 10% → Loss = ₹1,000 (-10%)
👉 Risk & reward move in proportion to your capital.
🔹 Example 2 : Leverage Trade style ( 10x Leverage )
suppose you have 💰 Capital = ₹10,000
opted Leverage = 10x
New Trade Size ( margin ) = ₹1,00,000 ( you can now utilize this margin amount for trading )
* You can buy 0.01 BTC ( 10000 ➗ 10,000,000 ).
* If BTC rises 10% → Profit = ₹10,000 (+100% return)
* If BTC falls 10% → Loss = FULL ₹10,000 ( Liquidation 🚨 )
👉 A 10% move = your account will be blown.
🔹 Example 3:
suppose you have 💰 Capital = ₹10,000
opted Leverage = 50x (Extreme ⚠️)
New Trade Size ( margin ) = ₹5,00,000 ( you can now utilize this margin amount for trading )
* You can buy 0.05 BTC ( 50000 ➗ 10,000,000 ).
* If BTC rises just 2% → Profit = ₹10,000 (+100% return)
* If BTC falls just 2% → FULL ₹10,000 loss ( Liquidation 🚨 )
* If BTC rises just 10% → Profit = ₹50,000 (+500% return)
* If BTC falls just 10% → FULL ₹10,000 loss ( Liquidation 🚨 )
👉 Tiny moves in high volatile asset class = jackpot or wipeout/blown.
⚔️ Key Takeaways :
1️⃣ Leverage multiplies profits 💸 but also multiplies losses too💀 ( a sweet killer! )
2️⃣ Crypto is *highly volatile* (10–20% daily moves are common) → High leverage is extremely risky, if not managed well.
3️⃣ Beginners should **never use more than 2x–3x leverage**
👉 In simple words: **Leverage is a double-edged sword ⚔️**
Used wisely → You’re a king 👑
Used recklessly → You’re broke 🥀
🚘 Liquidation Explained ( ex: Car Analogy )
Imagine you pay ₹10,000 to rent a car worth ₹1,00,000. (That’s 10x leverage).
* The car is in your hands, but ₹90,000 still belongs to the owner of car (exchange).
* If the damage goes beyond your ₹10,000 margin → the owner takes back the car immediately.
👉 That’s liquidation: when your loss = your margin.
🔹 Case 1: Normal Trade style ( No Leverage )
Margin = ₹10,000 → Buy BTC.
If BTC drops 10% → Loss = ₹1,000.
You still have ₹9,000 left.
✅ No liquidation. Just a normal loss.
🔹 Case 2: 10x Leverage Trade style
Margin = ₹10,000
New Trade Size ( margin ) = ₹1,00,000
* BTC rises 10% → Profit = ₹10,000 (+100%)
* BTC falls 10% → Margin wiped = Liquidation 🚨
🔹 Case 3: 20x Leverage Trade style
Margin = ₹10,000
New Trade Size = ₹2,00,000 ( margin )
* BTC rises 5% → Profit = ₹10,000 (+100% return)
* BTC falls 5% → Margin wiped = Liquidation 🚨
👉 Just 5% against you = Account gone.
🔹 Case 4: 50x Leverage Trade style (High-Risk Zone ⚠️)
Margin = ₹10,000
New Trade Size = ₹5,00,000 ( margin )
* BTC rises 2% → Profit = ₹10,000 (+100% return)
* BTC falls 2% → FULL ₹10,000 loss = Liquidation 🚨
👉 Just 2% against you = Blown account = Game over.
🎯 Final Word
Leverage = Power ⚡
But in crypto’s volatile world, it’s also a **trap for the impatient**.
* Smart traders use small leverage.
* Impulsive traders burn out with high leverage.
💬 Question for you: What’s the **highest leverage** you’ve ever used in a trade? Drop it below 👇 (Be honest—we’ve all been tempted!)
If this Idea gave you a value information then please, Boost it, share your thoughts in comments, and follow for more practical trading!
Happy Trading & Investing!
@TradeWithKeshhav and team
BTC/USDT Outlook – Volatility Rises After Sharp DeclineBTC/USDT Market Report
Bitcoin recently faced heavy selling pressure, pushing the market into a sharp decline. This drop reflects a shift in sentiment where earlier stability has been replaced by increased volatility and downside momentum.
Price action shows signs of exhaustion after the fall, suggesting the possibility of a short-term rebound attempt. However, broader behavior still reflects uncertainty, with buyers needing stronger participation to shift momentum back in their favor.
If downward pressure continues, deeper corrections could emerge before any meaningful recovery. In the near term, traders should expect sharp swings as the market tries to stabilize.

BTC Price Action: Bulls vs BearsBTC Price Action: Bulls vs Bears
Bitcoin has shown a gradual recovery after a prolonged corrective phase, with market structure leaning toward a constructive buildup. Fundamentally, sentiment is influenced by global macro conditions—investors are watching U.S. monetary policy signals, while stable demand from institutions and long-term holders continues to provide a supportive backdrop. On-chain activity remains steady, with balanced exchange inflows and outflows suggesting no extreme directional pressure in the near term.
From a technical perspective, the market has shifted momentum from bearish flows into a developing bullish sequence. The recent break of structure on the 4H timeframe highlights strengthening upside intent, though price is still moving within a broader accumulation phase. Current flows suggest the possibility of a short-term dip for liquidity before continuation to higher levels, aligning with the overall constructive weekly outlook.

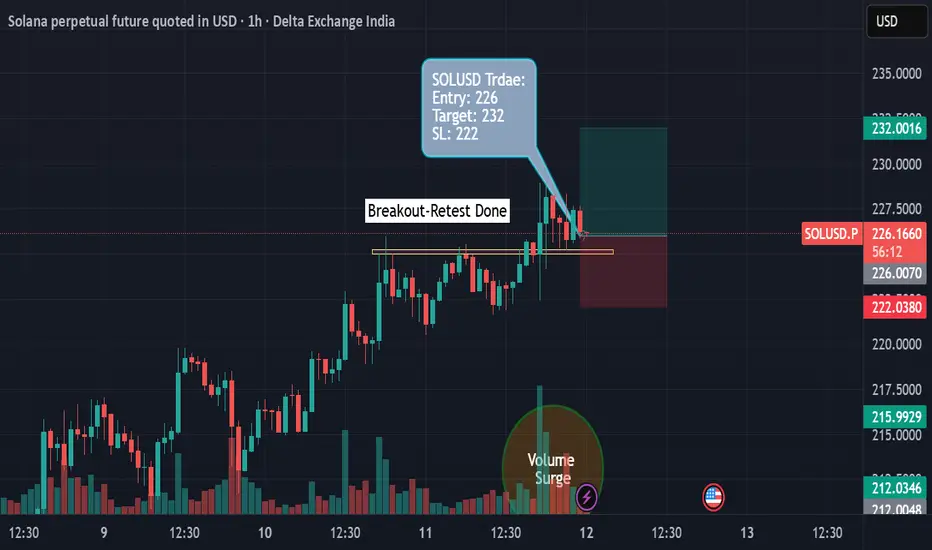
Solana (1H Chart) - Breakout-Retest Long TradeThis is a long trade setup for Solana perpetual futures based on a breakout and retest structure, placed on the 1-hour chart.
Trade Overview
• The chart shows price consolidating near a horizontal resistance zone (yellow line), followed by a breakout above this level and a subsequent retest.
• The entry is taken after confirmation of support at the breakout zone, aiming for a move toward the upper target.
Entry, Target, and Stop-Loss
• Entry: Around 226 USD, following a successful retest of the yellow breakout level.
• Target: 232 USD, marked in green at the upper end of the chart’s risk-reward box.
• Stop-Loss: 222 USD, just below the retest zone, minimizing risk if price reverses.
Trade Logic and Reasoning
• The trade capitalizes on a classic breakout-retest pattern, where price first breaks resistance and then tests it as new support.
• Increasing volume near the breakout supports bullish momentum.
• Risk management is prominent, with a clear stop-loss set below the retest area.
Risk/Reward Profile
This setup offers a favorable risk-to-reward ratio, as visualized by the green/red shaded box indicating potential gain versus loss for the position.
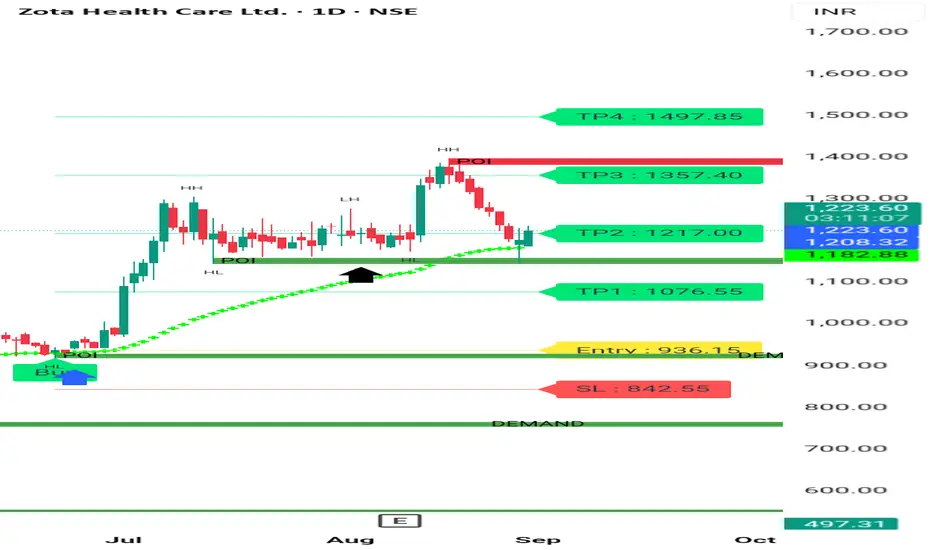
ZOTA HEALTHCARE BULLISH CHART Zota healthcare is good Growth company. It's a good buy at cmp for swing trading of 5%-6% profit. It's taking Reversal after Retracement. U can look into this. Thanks .
Consult your financial advisor before making any position in stock market.
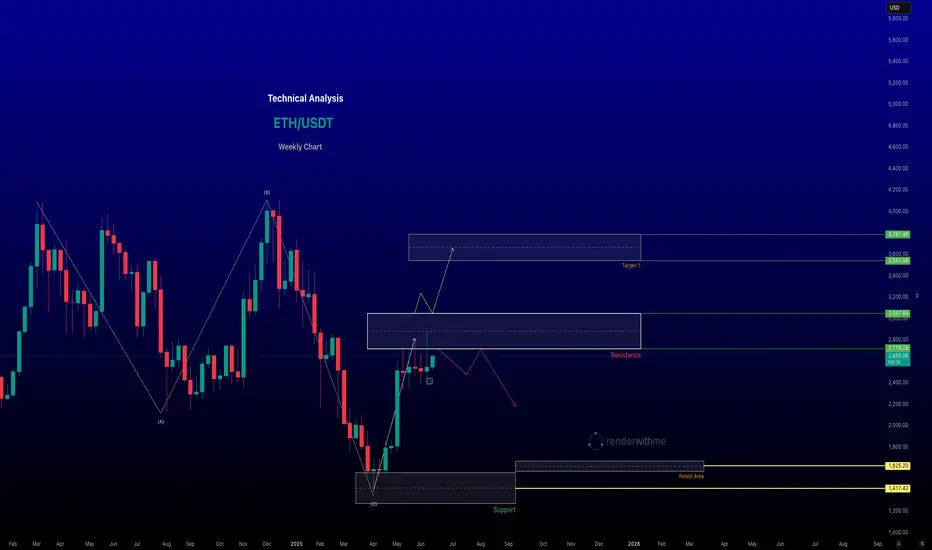
Breakout in ETHEREUMA Big Breakout has happened in Ethereum in weekly time frame.
The Coin shoul be holded for months to achieve its final target.
As price has reached all time high which is its first target.
Rest two targets are 7400 and 7700.
No SL should be placed as the coin should be acquired on holding basis.
Note: This analysis is for Educational Purpose Only. Please invest after consulting a professional financial advisor.

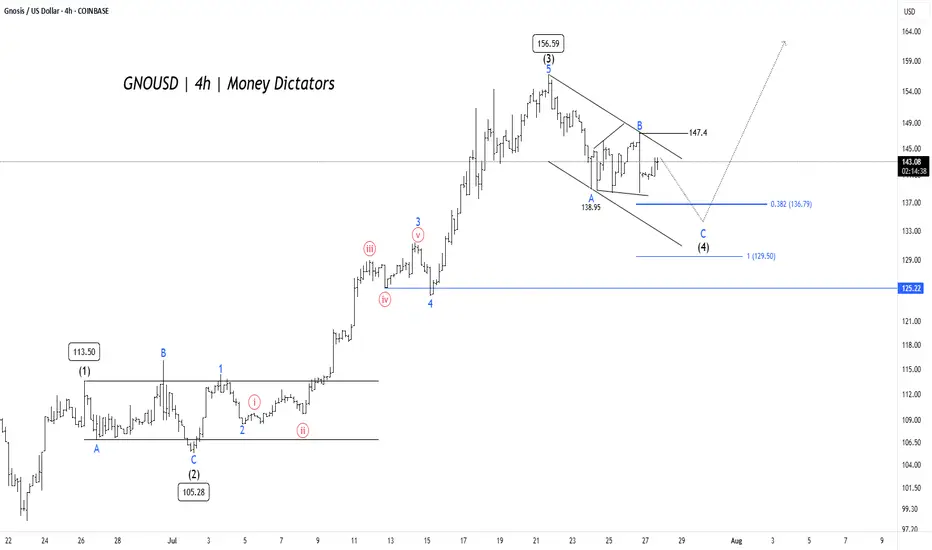
GNO/USD Price Action Aligns for Final Wave 5 PushGNO/USD pair is unfolding a clean Elliott Wave impulse pattern on the 4-hour chart. The rally began with Wave (1) reaching 113.50, followed by a corrective Wave (2) that bottomed near 105.28. This set the stage for a powerful Wave (3) that surged to 156.59 , aligning well with Elliott Wave theory where Wave 3 is typically the strongest and steepest leg in the sequence.
Wave (4) is now in progress, taking the form of an A-B-C correction inside a descending channel. Interim support was found at 138.95 during Wave A, and Wave C could extend toward the 0.382 Fibonacci retracement level at 136.79 or the deeper support zone near 129.5. These levels are crucial, as they often mark the end of a corrective phase and the beginning of the next impulse. A confirmed breakout above 147.4 would signal the start of Wave (5) and the return of bullish momentum.
Short-term targets have the potential to reach 135 – 128 , while 125.22 remains the invalidation level for this bullish setup. After the completion of Wave (4), traders can look for long opportunities targeting 147 – 154 – 172 . As long as the structure holds and price respects key supports, the outlook remains favorable for a fresh push higher in Wave (5).
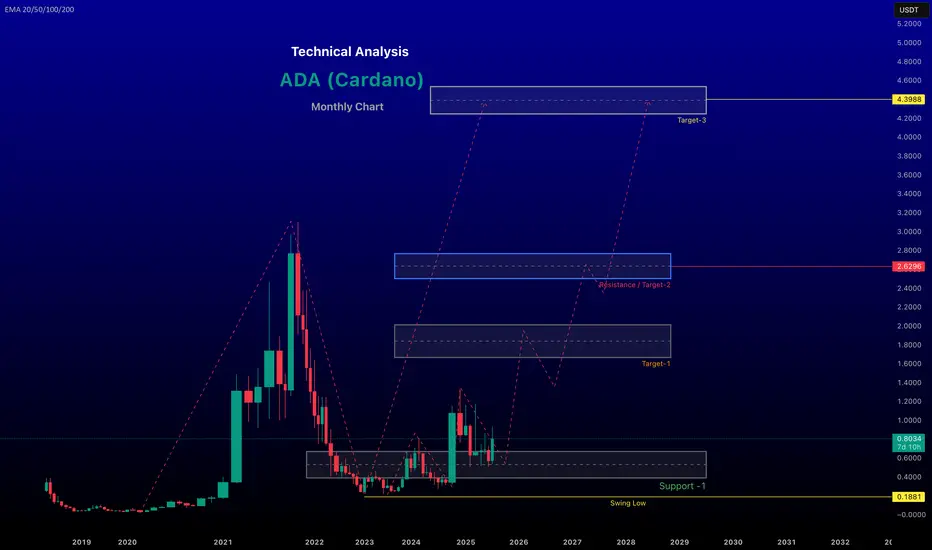
renderwithme | ADA Technical Analysis Technical Analysis
Recent technical analyses from web sources and X posts suggest a bullish outlook for ADA in the short to medium term, with specific price levels and patterns noted:Price Trends and Breakouts:As of July 24, 2025, ADA has broken out of a long-term downtrend and is retesting the breakout zone around $0.78. If this support holds, analysts predict a potential rally toward $1.20 or higher.
Earlier analyses (November 2024) indicated ADA was at a critical juncture, with a potential breakout to $1.25 if resistance was cleared, or consolidation into a triangle pattern if rejected.
A macro analysis from February 2025 highlights ADA maintaining a bullish structure above key invalidation levels, supported by its strong community and historical price action, suggesting a strong bullish continuation.
On a 4-hour timeframe, an ascending triangle breakout was observed around $0.777, with targets at $0.83 and $0.86, supported by higher lows and increased volume
for longer time frame target given in the chart
~~ Disclaimer ~~
This analysis is based on recent technical data and market sentiment from web sources. It is for informational \ educational purposes only and not financial advice. Trading involves high risks, and past performance does not guarantee future results. Always conduct your own research or consult a SEBI-registered advisor before trading.
# Boost and comment will be highly appreciated.
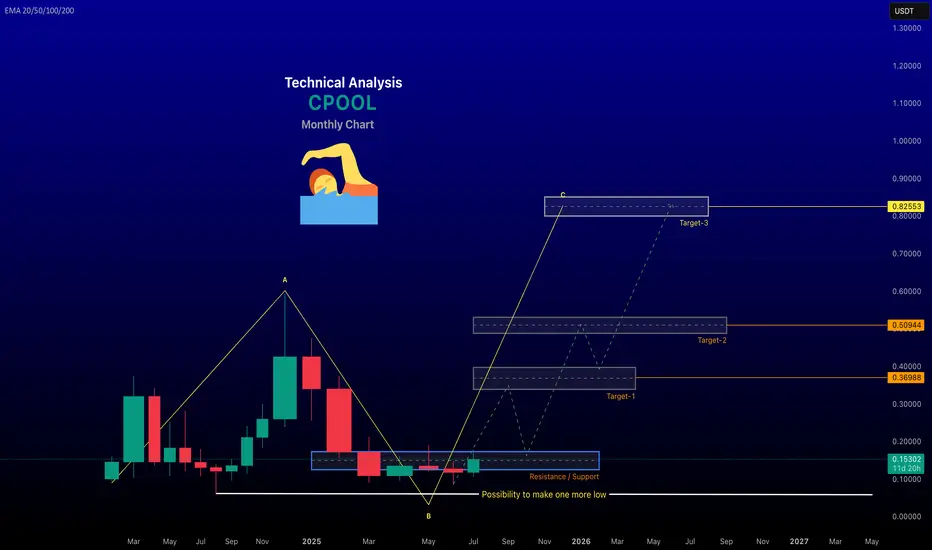
renderwithme || Clearpool (CPOOL) Cryptocurrency Analysis#Overview of Clearpool
(CPOOL)Clearpool is a decentralized capital markets ecosystem that enables institutional borrowers to access uncollateralized liquidity through a DeFi protocol. The CPOOL token is the utility and governance token for the platform, used for voting on borrower whitelisting, staking, and earning rewards. Liquidity providers earn yields enhanced by CPOOL rewards, and the protocol aims to bridge traditional finance with DeFi, targeting the $120 trillion capital markets.
Current Price and Market Data (as of July 20, 2025)Price: $0.1571 USD, down 4.16% in the last 24 hours.
24-Hour Trading Volume: $7,632,433 USD.
Market Cap: $123,303,081 USD, ranking #320 globally.
Circulating Supply: 784,836,183 CPOOL out of a total supply of 1,000,000,000 tokens.
All-Time High: $2.56 (down 95.55% from peak).
Recent Sentiment: Posts on X indicate bullish sentiment, with technical analysis reports showing a 61.54% bullish rating on a 4-hour timeframe on KuCoin.
Technical AnalysisShort-Term Trends: Recent X posts highlight a strong bullish trend on a 1-hour and 4-hour timeframe, suggesting traders may favor long positions. Technical indicators like Moving Averages, RSI, MACD, and others show "Strong Buy" signals on shorter timeframes (5 minutes to 5 hours) but a "Strong Sell" on weekly charts, indicating potential volatility or correction over longer periods.
Risk Assessment: InvestorsObserver rates CPOOL as a medium to high-risk investment due to price volatility relative to trading volume and market cap. Price movements can be significant with limited trading activity, suggesting susceptibility to manipulation or sharp swings.
Key Levels: A clean breakout has been noted, but specific support and resistance levels are not detailed in the provided data. Traders should monitor real-time charts on platforms like TradingView for pivot points and moving averages.
Fundamental AnalysisUse Case: CPOOL’s role in governance and staking gives it utility within the Clearpool ecosystem. The protocol’s focus on uncollateralized lending is unique, appealing to institutions seeking DeFi solutions without traditional collateral requirements. The buyback program, where protocol revenue is used to purchase CPOOL, aims to sustain reward pools and potentially support price stability.
Market Position: Clearpool’s integration of real-world asset (RWA) tokenization positions it in a growing DeFi niche, potentially reducing costs compared to traditional finance. However, its #320 ranking suggests it’s a mid-tier project with room for growth or risk of being overshadowed by larger protocols.
#Price Predictions:
Forecasts for 2025 vary widely:
Optimistic projections: $0.2068–$0.3204 (WalletInvestor, PricePrediction.net).
Pessimistic projections: $0.5024–$0.8255
Contradictory outlooks reflect uncertainty, driven by market sentiment, crypto market trends, and protocol developments. Investors should conduct their own research (DYOR) due to these discrepancies.
Investment ConsiderationsOpportunities: Bullish sentiment, institutional adoption potential, and the buyback program could drive price growth if DeFi and RWA tokenization gain traction.
Risks: High volatility, a significant drop from the all-time high, and a medium/high-risk rating suggest caution. The crypto market’s sensitivity to regulatory, financial, and political events adds uncertainty.
Recommendation: CPOOL may suit short- to medium-term traders comfortable with high risk, given the bullish technical signals. Long-term investors should assess Clearpool’s ability to scale institutional adoption and monitor broader DeFi trends. Always use stop-loss orders and diversify to manage risk.
How to Analyze and Predict CPOOL PriceTechnical Analysis: Use tools like TradingView to track indicators (RSI, MACD, Moving Averages) and identify support/resistance levels. Monitor volume for breakout confirmation.
Fundamental Analysis: Stay updated on Clearpool’s partnerships, borrower onboarding, and protocol revenue for buyback impact. Follow X for community sentiment and news.
Risk Management: Given the high-risk rating, limit exposure and use risk management strategies like position sizing and stop-losses.
External Factors: Monitor broader crypto market trends, regulatory developments, and DeFi adoption rates, as these heavily influence CPOOL’s price.
~~ Disclaimer ~~
This analysis is based on recent technical data and market sentiment from web sources. It is for informational \ educational purposes only and not financial advice. Trading involves high risks, and past performance does not guarantee future results. Always conduct your own research or consult a SEBI-registered advisor before trading.
# Boost and comment will be highly appreciated.
$XRP just broke its all-time high: $3.66CRYPTOCAP:XRP just broke its all-time high: $3.66 — and this is just the beginning?
After years of waiting, XRP finally explodes past $2 and hits $3.66 this bull run. It’s not just a win for XRP holders — it’s a lesson in patience, conviction, and catching early setups before the hype.
Why it matters now:
🔹 While everyone’s chasing the latest meme coin, XRP silently did a clean 7x from $0.50.
🔹 Regulatory clarity is improving — XRP’s bullish narrative is finally unfolding.
🔹 Market rotation is real: old giants like XRP are moving again, and this signals strength in Layer 1 comeback plays.
Quick breakdown:
📌 First signal at $0.50 → 7x
📌 Second entry below $2 → already 2x
📌 Current price: $3.66 (ATH)
📌 Many ignored it, some mocked it — but price tells the truth.
Patience beats hype. Quality setups > chasing pumps.
Save-worthy takeaway:
If you ever feel FOMO, remember this:
The best trades aren’t loud. They’re early, quiet… and require conviction.
What’s your biggest “I told you so” moment in this bull run?👇
Let’s hear your favorite early calls — drop them in the replies!

Ethereum Technical Analysis for the Week of June 16-June 231. Price Overview
Current Price: As of June 16, 2025, Ethereum's price is approximately $2,610.36 USD, with a 24-hour trading volume of $16.83 billion USD. It is up 2.59% in the last 24 hours.
Market Cap: Ethereum holds the #2 rank with a live market cap of $315.13 billion USD. Circulating supply is 120.72 million ETH.
Recent Performance:
Over the last 7 days, ETH has risen by 20%, showing strong upward momentum.
In the past month, ETH increased by 16.61%, adding an average of $624.97 to its value.
ETH has underperformed compared to Bitcoin in 2025 but shows signs of recovery with institutional interest growing.
# Support and Resistance Levels:
Support: Key support is around $2,160–$2,020
Resistance: Immediate resistance lies between $2,739–$2,850. A breakout above $2,800–$3,000 could target $3,400–$4,100.
-- Disclaimer --
This analysis is based on recent technical data and market sentiment from web sources. It is for informational purposes only and not financial advice. Trading involves high risks, and past performance does not guarantee future results. Always conduct your own research or consult a SEBI-registered advisor before trading.
#Boost and comment will be highly appreciated
Arbitrum Technical Analysis for the year of 2025~~ Arbitrum ( AMEX:ARB ) Technical Analysis ~~
Current Price and Market Context (as of June 11, 2025)
Price: Approximately $0.3649 USD, based on recent data from CoinMarketCap, with a 24-hour trading volume of ~$169.5M.
Market Cap: ~$1.79B, ranking #67 among cryptocurrencies. Circulating supply is 4.9B ARB, with a fully diluted valuation of ~$3.67B if all 10B tokens are in circulation.
Recent Performance:
24 Hours: Up 2.16% to $0.3352 (noted in some sources, though prices vary slightly).
7 Days: Up 1.60%, underperforming the global crypto market (+2.80%).
30 Days: Up 4.54%, showing mild recovery.
1 Year: Down 70.06%, reflecting significant bearish pressure since its all-time high of ~$2.39 (January 2024).
Volatility: Estimated at 3.91% daily, typical for crypto assets
Trend shifted to bullish For Support Resistance and Targets
Chart for your reference
-- Disclaimer --
This analysis is based on recent technical data and market sentiment from web sources. It is for informational purposes only and not financial advice. Trading involves high risks, and past performance does not guarantee future results. Always conduct your own research or consult a SEBI-registered advisor before trading.
#Boost and comment will be highly appreciated

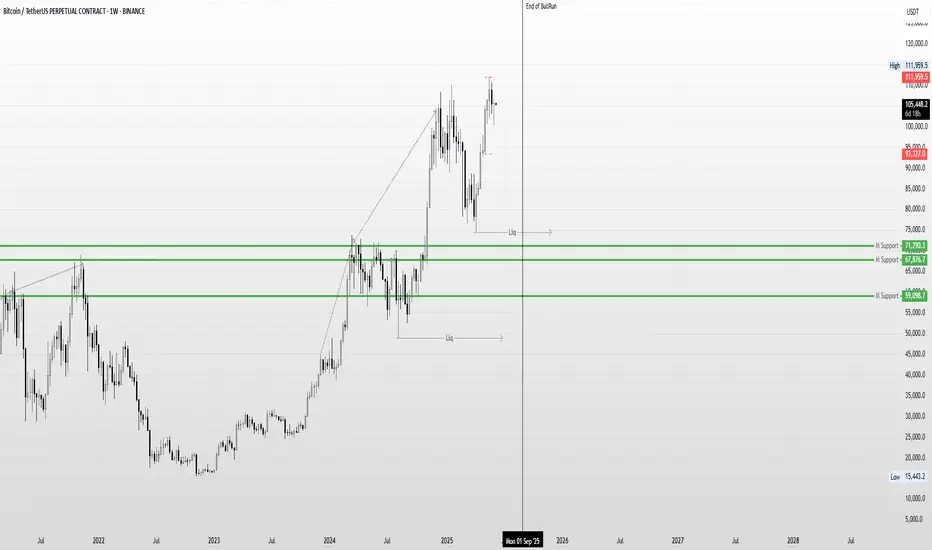
Bitcoin Weekly Analysis: Potential Exhaustion in Price ActionWhile Bitcoin continues to form Higher Highs on the Weekly Time Frame, the overall price action appears to be gradually losing momentum. From my perspective, this could be an early sign of exhaustion, suggesting that the current bullish trend may be nearing its end.
If this weakening momentum continues, there's a possibility that a broader correction or even the beginning of a bear market could unfold post-September. In such a scenario, the market may attempt to hunt significant downside liquidity levels, potentially targeting zones around $74,000 and even as low as $48,000.
Of course, this is purely a personal prediction based on current price structure and market behavior. Only time will reveal how accurate this outlook turns out to be.
Disclaimer :
This content is for informational and educational purposes only and does not constitute financial or investment advice. The views expressed are based on personal analysis and should not be considered as a recommendation to buy, sell, or hold any asset. Cryptocurrency markets are highly volatile, and past performance is not indicative of future results. Always do your own research (DYOR) and consult with a licensed financial advisor before making any investment decisions.
BTCUSD IN SKY !!!!!!!!!!!!When the BTC was at 65k this needs to take a rebound and that is till 18500
Now just bought it and hold your socks
Put Target 100000
Date : 23rd June 2024 !!
BUY ALL CRYPTO NOW !!!!!!!!!

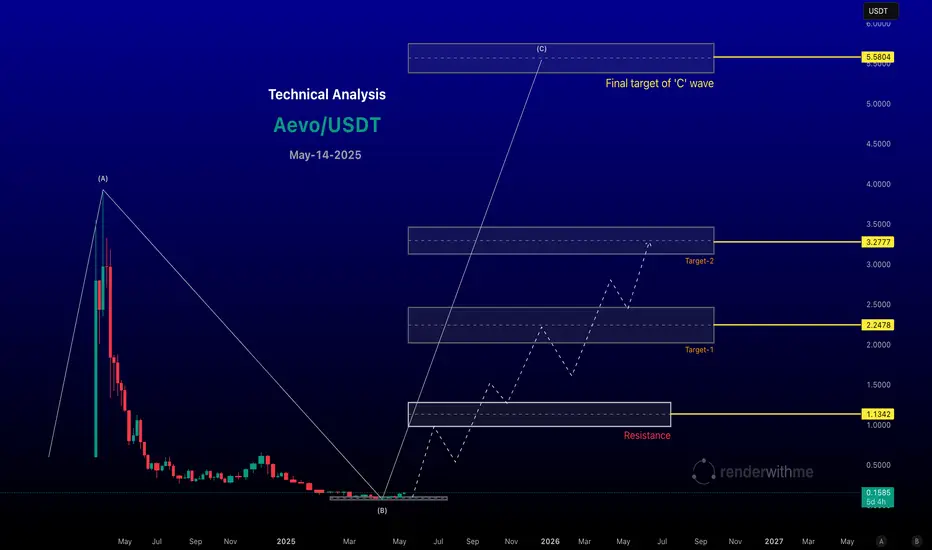
AEVO is a gem in this bull run.
Aevo has experienced significant volatility since its Binance Launchpool listing in March 2024. After a rapid rise to $3.94, it entered a prolonged downtrend, forming lower highs and lows. Recent price action suggests a potential stabilization or relief rally, supported by increased trading volume.
Aevo has experienced significant volatility since its Binance Launchpool listing in March 2024. After a rapid rise to $3.94, it entered a prolonged downtrend, forming lower highs and lows. Recent price action suggests a potential stabilization or relief rally, supported by increased trading volume.
Chart for your reference
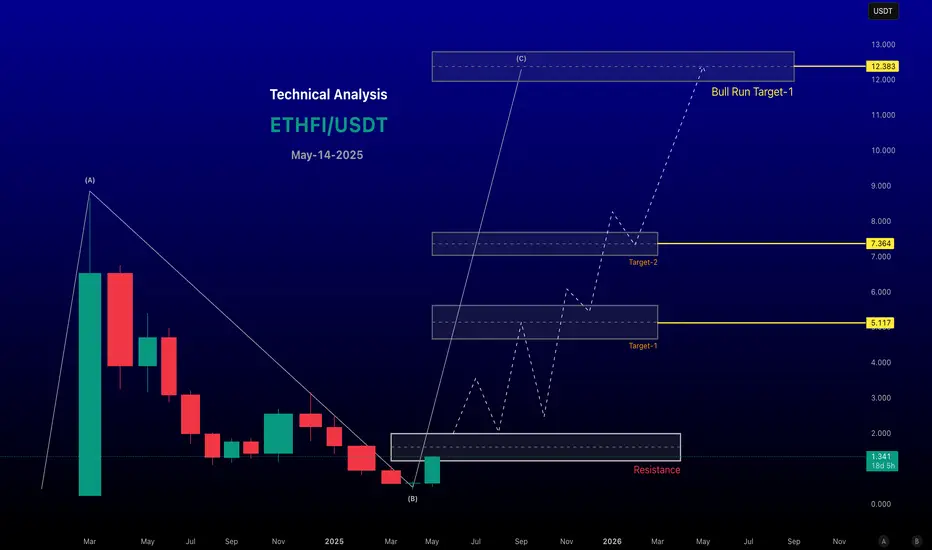
ETHFI/USDT CAN TOUCH $12#ETHFI/USDT Technical Analysis (as of May 14, 2025)
#Current Market Sentiment and Price Action
Price Trend: ETHFI has shown bullish momentum recently indicate a breakout from a descending broadening wedge on the daily timeframe, suggesting potential for a strong bullish 'C' wave if the breakout is sustained.
Recent Performance: A surge of 40.9% in 24 hours was noted, accompanied by a 351.5% increase in trading volume, signalling strong market conviction.
Current Price Levels: Specific price points mentioned include a consolidation around $1.335– at the time of posting with a potential pullback to $0.96 or lower to fill imbalances.
Chart for your reference
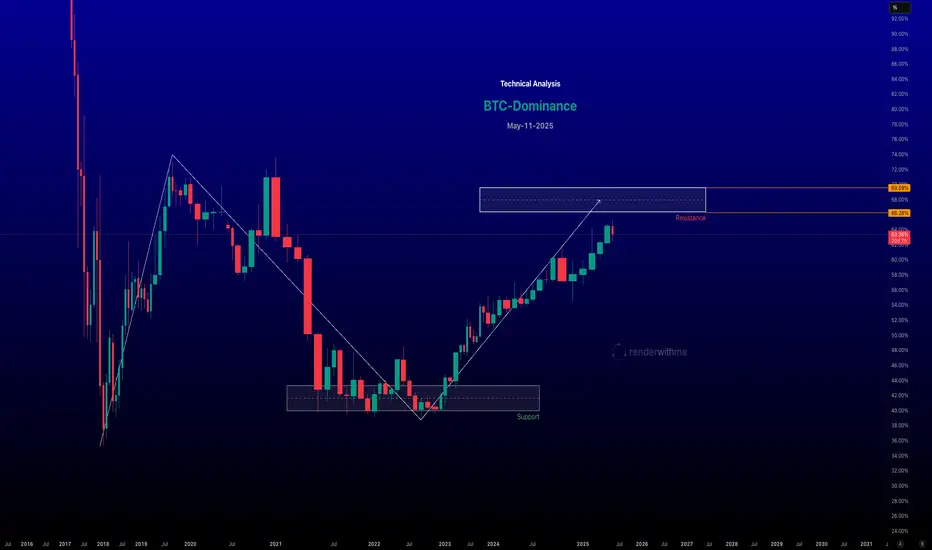
Bitcoin Dominance (BTC.D) waiting for the level to hitBitcoin Dominance (BTC.D) measures Bitcoin’s market capitalisation as a percentage of the total cryptocurrency market cap. It’s a key metric for understanding market sentiment, reflecting whether investors favor Bitcoin (BTC) over alt coins or vice versa. Technical analysis of BTC.D involves studying its chart patterns, indicators, and levels to gauge potential market trends, such as Bitcoin strength or alt coin season.
Chart for your reference
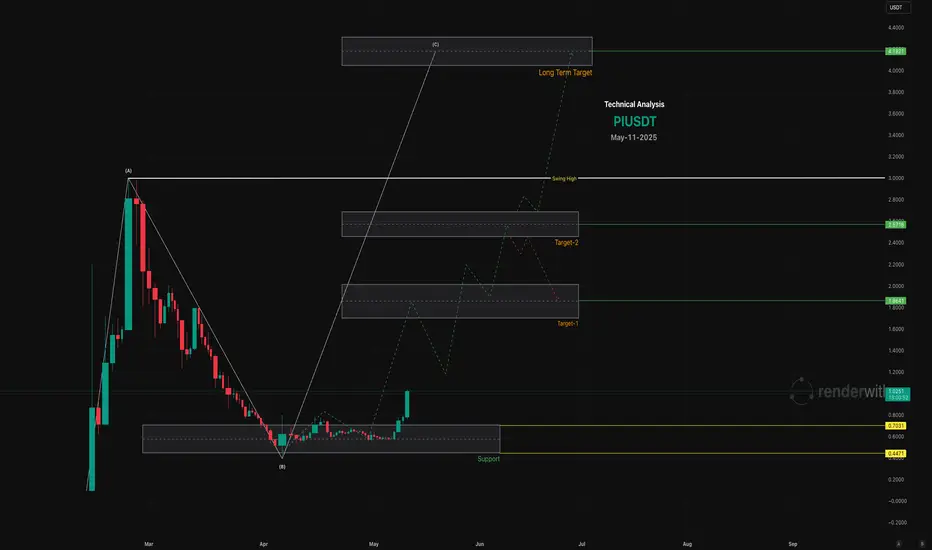
PI Network Can Touch $4 In This Bull Run
Support: Key support levels are at $0.5192, $0.5465, and potentially $0.40 (all-time low) if selling pressure persists.
Resistance: Immediate resistance is at $1.7000, $2.000, A break above $1.70 would signal a strong bullish reversal.
Psychological Levels: $2.00 is a critical psychological barrier, with $2.98 (all-time high from February 2025) as a long-term target.
Chart for your reference
Market Turning Point? Watch 87,533.05 for a Bullish BreakoutThese 3 candle wicks indicate that the bears are no longer in strong control of the market. However, for the market to turn bullish, it is essential to close above the 87,533.05 level on the daily chart. Only after that can the market become bullish in the short term, with potential targets of 96,000 or even 102,682. But sustaining above the 87,533.05 level on a daily basis is crucial.

Is Bitcoin on the Verge of a Massive Breakout?Bitcoin's wave ((4)) has successfully completed a W-X-Y corrective formation. If Bitcoin manages to decisively break above the key resistance level of 88,826, it could trigger a powerful impulsive rally, potentially driving prices toward the next major targets at 95,250 - 99,508 - 109,176.
Additionally, the parallel channel's lower trendline is offering substantial support, preventing further downside movement. A strong breakout above this channel could significantly enhance bullish momentum, increasing the probability of Bitcoin reaching new all-time highs. We will update you soon!

Ethereum Accumulation Alert! 🚀 Ethereum Accumulation Alert! 🔥
Ethereum is entering a potential spring accumulation zone, presenting a solid long-term opportunity.
📉 Buy Zone: $1,900 – $1,550
🎯 Targets: $5,000 / $7,500 / $10,000
🔹 Key Support: $1,550 – Holding above this level keeps the bullish structure intact.
🔹 Breakdown Risk: If ETH loses $1,550, expect further downside toward sub-$1,000, where the next strong entry lies.
📊 Smart money is accumulating—don’t miss the dip!
#Ethereum #CryptoTrading #Accumulation #ETH #NFA #DYOR
