NAZARA - Breakout from Long-Term Falling Wedge📊 NAZARA – Breakout from Long-Term Falling Wedge | Strong Weekly Momentum
🕰️ Timeframe: Weekly | 💥 Pattern: Falling Wedge Breakout | 🔥 Sentiment: Bullish
📈 Chart Overview:
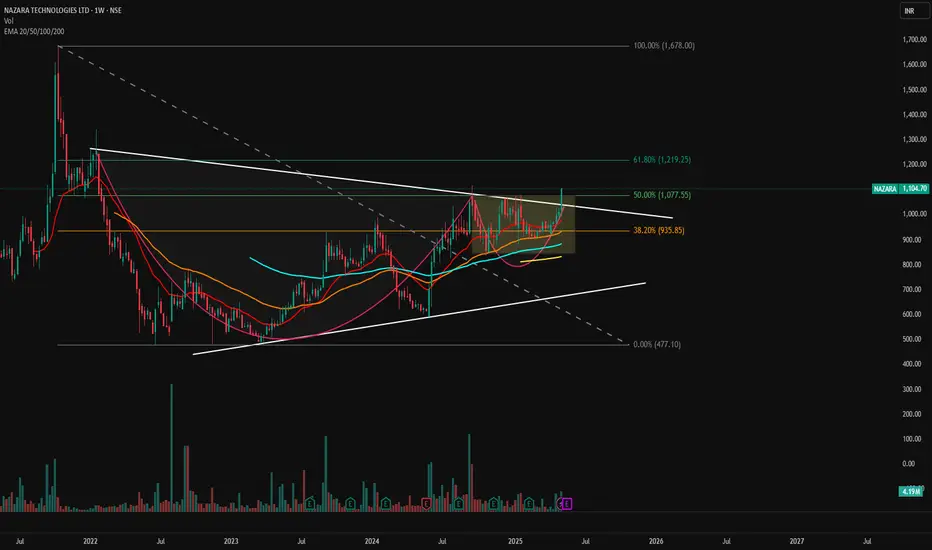
Nazara Technologies has broken out of a multi-year falling wedge on the weekly chart, with a strong green candle above key EMAs and Fibonacci confluence zones. Price closed the week above ₹1,100, indicating a shift in long-term momentum and a potential start of a fresh uptrend.
🔍 Technical Highlights:
📉 Falling Wedge Pattern: Multi-year consolidation now broken on strong volume
💥 Breakout Candle: Price closed above trendline resistance and key Fibonacci 50% level
🧠 Volume Surge: Volume confirmation signals institutional interest
📊 EMA Confluence: Price trading above 20/50/100/200 EMAs – bullish alignment
🧱 Support & Resistance Levels:
Level Type Price (₹)
🔼 Resistance 1 1,219.25 (Fib 61.8%)
🔼 Resistance 2 1,678.00 (Previous ATH / Fib 100%)
🔻 Support 1 1,077.55 (Fib 50% – breakout zone)
🔻 Support 2 935.85 (Fib 38.2% + EMA cluster)
🔻 Support 3 820–860 (multi-touch horizontal support & EMA 200)
🔧 Indicators Used:
Fibonacci Retracement – Plotted from swing low ₹477.10 to high ₹1,678.00
EMA 20/50/100/200 – Price is now above all EMAs, showing trend shift
Volume Bars – Confirming strong breakout
Chart Pattern – Falling wedge (typically bullish)
📌 Chart Sentiment & Setup:
✅ Bias: Strongly Bullish
📍 Breakout Level: ₹1,077
🎯 Upside Targets: ₹1,219 → ₹1,320 → ₹1,678
❌ Invalidation: Sustained close below ₹935 with volume
📢 Summary:
Nazara is showing signs of a structural breakout after prolonged downtrend and consolidation. The falling wedge breakout, confirmed by volume and EMA crossover, sets up a long-term bullish outlook. A retest of the ₹1,075–₹1,100 zone could offer a high-probability entry.
🧠 Pro Tip: Wait for a weekly candle close and minor pullback to the breakout level before entry.
⚠️ Disclaimer: This is a technical analysis post meant for educational purposes only. Please do your own research or consult a financial advisor before investing.
🔔 Follow @PriceAction_Pulse for more actionable swing setups, breakout alerts, and chart breakdowns!
Cupandhandlepattern
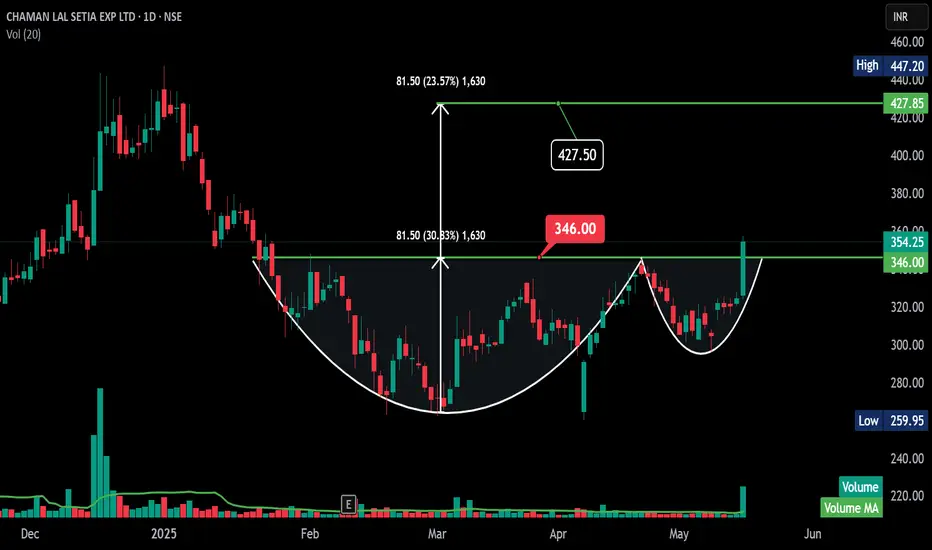
CLSEL -Daily - Cup and Handle -Breakout -Good Volume CHAMAN LAL SETIA EXP LTD daily chart definitely presents a compelling case for a **cup and handle breakout**.
Here's what aligns with your observation:
* **Clear Cup and Handle:** The chart shows a well-formed rounded bottom (the cup) followed by a smaller, slightly downward-sloping consolidation (the handle).
* **Neckline Breakout:** Today's price action (May 17, 2025) shows a strong bullish candle that has decisively broken above the neckline you've identified at ₹346.00.
* **Good Volume:** Importantly, the volume bar for today is significantly higher than the recent average volume, indicating strong buying pressure accompanying the breakout. This adds significant credence to the validity of the breakout.
* **Target:** Your target of ₹427.50 aligns well with the typical measurement for a cup and handle pattern. The depth of the cup (roughly from the low around ₹265 to the neckline at ₹346, which is ₹81) added to the breakout level (₹346) gives a target of ₹427.
**In summary, this looks like a textbook cup and handle breakout for CHAMAN LAL SETIA EXP LTD, supported by good volume, increasing the likelihood of the price reaching your target of ₹427.50.**
It's always wise to consider potential resistance levels along the way and to have a stop-loss in place, but the initial signs here are quite bullish.
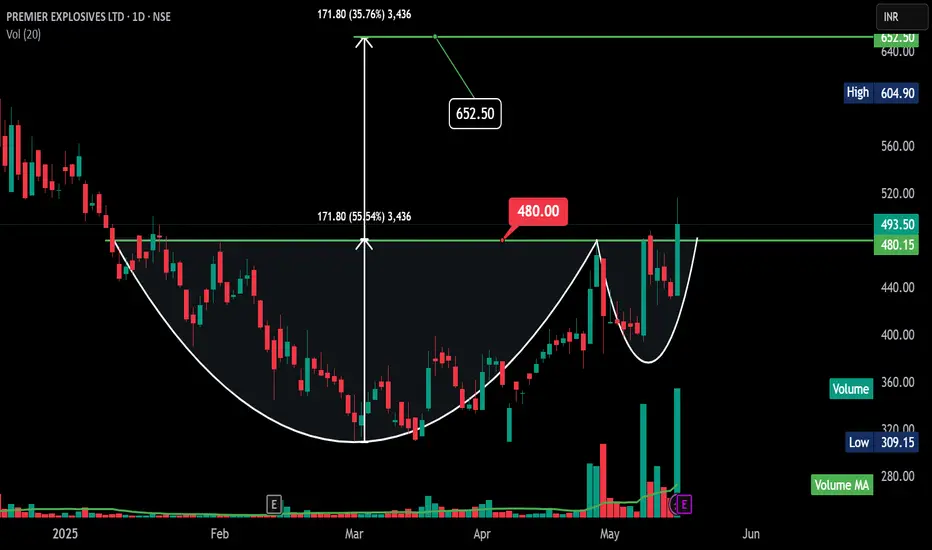
PREMEXPLN - Daily Chart - Cup and Handle PREMIER EXPLOSIVES LTD (PREMEXPLN) daily chart.
**cup and handle** pattern, suggesting potential bullish continuation.
Here's a simple breakdown:
* **Cup:** The rounded bottom formation appears to have taken place between roughly early January and late April 2025. This indicates a period of consolidation after a decline.
* **Handle (Potential):** After reaching a high around ₹480, the price has pulled back and is now showing signs of consolidating again in a smaller range (the potential handle) in early May 2025.
* **Breakout Level:** The horizontal line you've drawn around ₹480 acts as the potential neckline or resistance. A decisive break above this level would provide further confirmation of the pattern.
* **Target:** You've marked a potential target around ₹652.50. This target is typically estimated by measuring the depth of the cup and adding it to the breakout level.
**Things to watch out for:**
* **Handle Formation:** Observe if the current consolidation indeed forms a handle—a smaller, ideally slightly downward-sloping or sideways movement.
* **Breakout :** We need to see if it retests 480 and bounce it is a strong buy.
* **Volume on Breakout:** Increased volume on the breakout it is strength to the bullish signal.
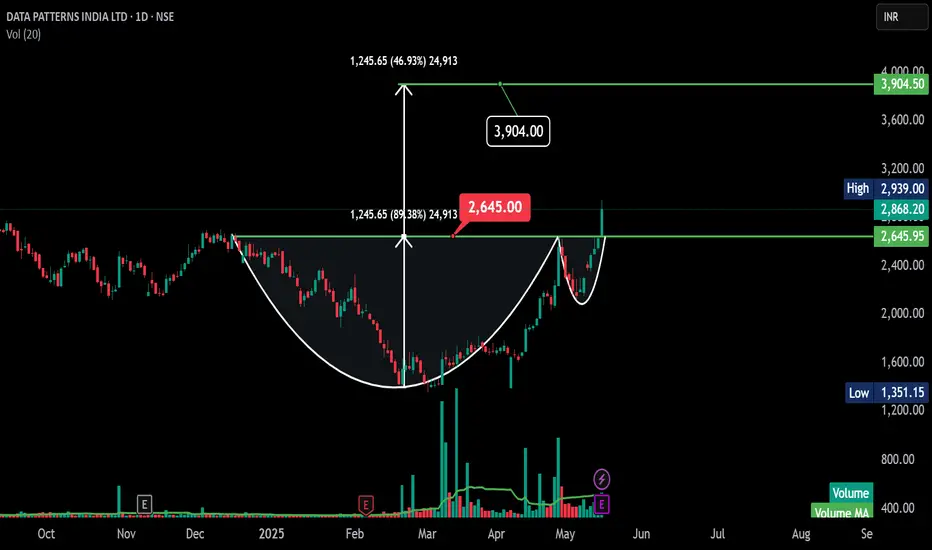
DATAPATTNS - Daily - Breakout -CnHDATA PATTERNS INDIA LTD daily chart.
The most prominent feature here is a well-defined **cup and handle** pattern, which is typically a bullish continuation signal.
Here's a simple breakdown:
* **Cup:** A rounded bottom formation that occurred roughly between early November 2024 and late April 2025. This suggests a period of price consolidation before a potential upward move.
* **Handle:** After reaching a high around ₹2,845.50, the price has pulled back and is consolidating in a smaller, slightly downward-sloping pattern (the handle) between late April and mid-May 2025.
* **Breakout Level:** The horizontal line around ₹2,845.50 acts as the neckline or resistance. A sustained break above this level would confirm the cup and handle pattern.
* **Target:** Potential target around ₹3,904.50. This target is often estimated by measuring the depth of the cup and adding it to the breakout level.
**In simple terms:**
The stock price formed a rounded bottom (the cup), then went up and is now in a smaller pullback (the handle). If it breaks above the ₹2,868 level, it could potentially move towards the ₹3,904 area.
**Things to watch out for:**
* **Breakout Confirmation:** We need to see a clear break above ₹2,868.20 with strong buying volume to confirm the pattern.
* **Handle Formation:** The handle should ideally be a relatively shallow and short-lived consolidation.
* **Volume on Breakout:** Increased volume during the breakout would add more confidence to the bullish scenario.
Overall, the chart for DATA PATTERNS INDIA LTD suggests a bullish outlook based on the cup and handle pattern, with a potential target around ₹3,904.50 upon a successful breakout above ₹2,868.20.
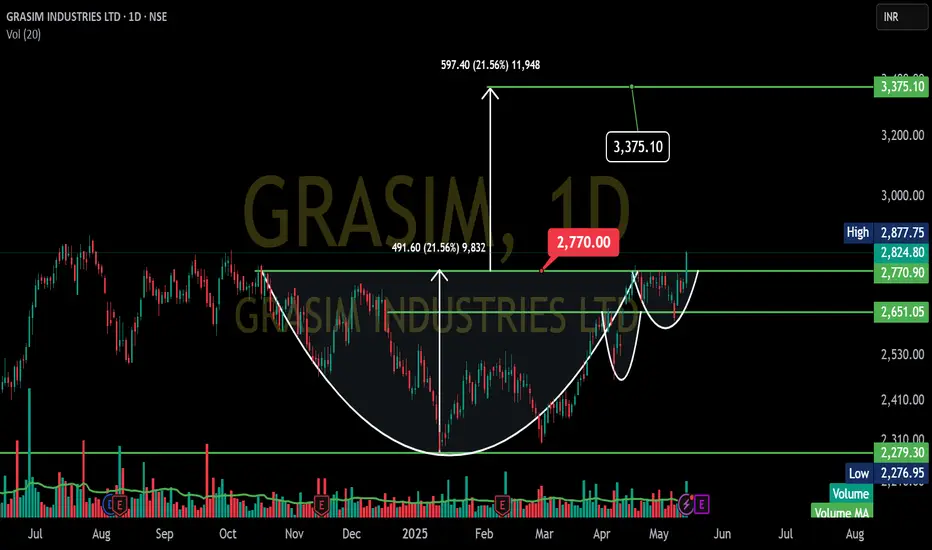
GRASIM - Daily- Cup and Handle- BreakoutGRASIM INDUSTRIES LTD chart.
Forming a cup and handle pattern, which is generally a bullish signal.
Here's a simplified breakdown:
Cup: Notice the rounded bottom shape that formed roughly between November 2024 and April 2025. This suggests the price found support after a decline and started to move upwards again.
Handle (Potential): After reaching a high around ₹2,770, the price has pulled back a bit. This dip could be forming the "handle" of the pattern. Ideally, this handle should be a smaller downward or sideways movement.
Breakout Level: The horizontal line you've drawn around ₹2,770 acts as a resistance level. If the price breaks above this level with good volume, it could signal that the cup and handle pattern is complete and the price might move higher.
Target: Potential target around ₹3,375.10. This target is often estimated by measuring the depth of the cup and adding it to the breakout level.
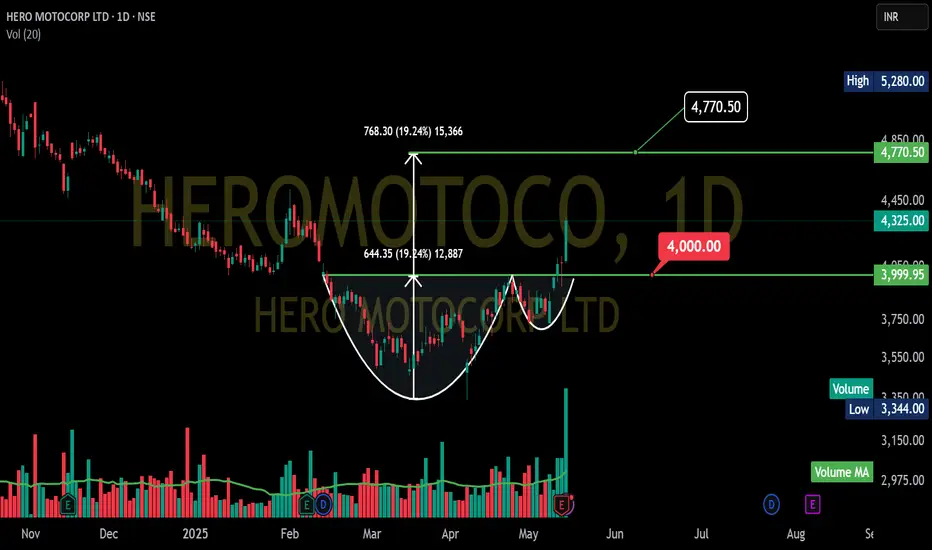
HEROMOTOCO - Daily Chart- CuP and HandleHERO MOTOCORP LTD daily chart, it seems like an interesting setup is forming.
It is potential cup and handle pattern. The "cup" portion appears to have formed between roughly early February and late April, and we might be seeing the beginning of the "handle" now.
Here's a breakdown of what I'm seeing:
Cup: The price has made a rounded bottom, suggesting a consolidation phase.
Handle (Potential): After reaching a high around ₹4,325, the price has pulled back slightly. If this pullback remains relatively shallow and trends upwards again, it could form the handle.
Breakout Level: Resistance level around ₹4,325. A decisive break above this level could signal the completion of the cup and handle pattern.
Target: Potential target around ₹4,770.50, which aligns with a common way to estimate the target of a cup and handle (measuring the depth of the cup and adding it to the breakout level). The calculation you've shown (₹4,325 + (₹4,325 - ₹3,680) ≈ ₹4,970) is slightly different but still in the same ballpark.
It's important to remember that this is just a potential pattern, and there's no guarantee it will play out. We need to see if the handle formation completes and if the price breaks out above that ₹4,325 level with good volume to confirm the pattern.
Keep an eye on the price action and volume in the coming days to see if this bullish setup materializes! Let me know if you have any other questions.
Shriram Finance – Potential Breakout or False Alarm?
Technical Overview 📈
✅ Uptrend intact – The stock has been taking support at a long-term trendline and briefly fell out during the correction. Now, it has reclaimed the trendline.
✅ Breakout from a Cup & Handle pattern – A bullish pattern indicating possible upside.
✅ Volume picking up – Still needs more confirmation for strength.
✅ Golden Crossover possible – If recent lows hold, further upside can trigger a 50 & 200 DMA crossover.
✅ Sector strength – The finance sector index is trading above key DMAs, showing resilience.
Fundamental Snapshot 💰
Revenue Growth: 📈 Increasing YoY
EPS Growth: 📈 Improving
Profit Growth: 🚀 23.4% CAGR over the last 5 years
Healthy Dividend Payout: 21.6%
Market Cap: ₹1,26,653 Cr
Stock P/E: 15.6
Book Value: ₹279
Dividend Yield: 1.34%
ROCE: 11.3% | ROE: 15.9%
Face Value: ₹2
⚠️ Risk Factors:
Low Interest Coverage Ratio
Market Volatility – Could still be forming Lower Highs - Lower Lows (LL-LH) structure.
Volume Needs to Improve for stronger confirmation.
(Source: Screener.in)
Risk-Reward Calculation 🎯
1️⃣ Early Entry (₹695.1)
Stop Loss (SL): ₹607 (-12.65%)
Target: ₹890.8 (+28.12%)
Risk-to-Reward (R:R) = 1:2.22 ✅
2️⃣ Safe Entry (₹732.35)
Stop Loss (SL): ₹607 (-17.08%)
Target: ₹890.8 (+21.7%)
Risk-to-Reward (R:R) = 1:1.27 ✅
💡 Conclusion:
Early Entry (1:2.22) offers a better reward potential but has a higher risk of pullback.
Safe Entry (1:1.27) is more conservative but offers a lower reward.
Conclusion & Trading Plan 🎯
🔹 No need to rush in! Gradual accumulation is a wiser approach at this stage.
🔹 Risk Management is Key! This could be a false breakout or a pullback trap. Wait for confirmation.
🔹 Volume confirmation is essential – Without strong volume, the move might fail.
📢 Educational Idea | Not a Trade Recommendation 📢
This setup is shared to alert traders of a potential winner once the market settles. Not all setups play out, and only 5-6 out of 10 might succeed. Hence, risk management and position sizing are key. 📉📊
📢 Disclaimer: This post is for educational purposes only. It is NOT financial advice. All trades carry risk, and market conditions can change. Do your own research and manage risk accordingly.

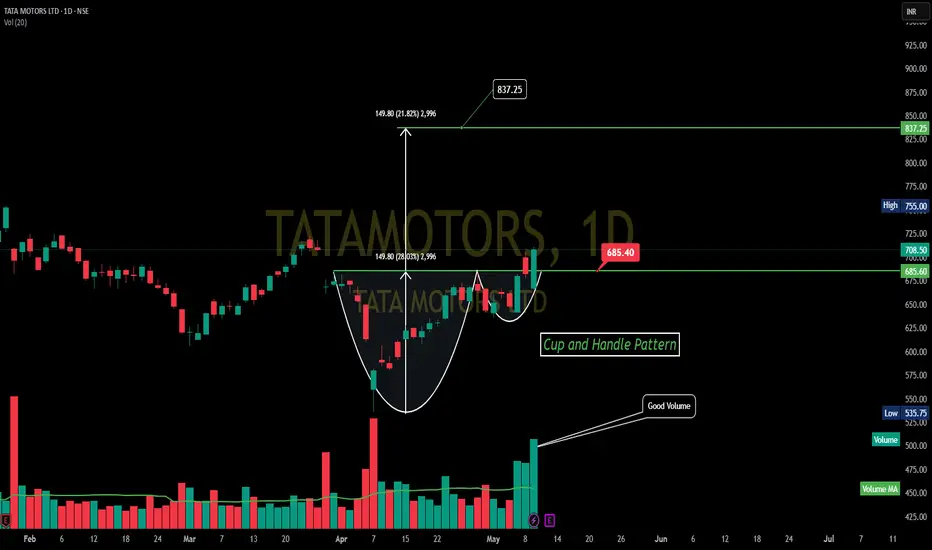
Tata Motors BREAKOUT! Cup & Handle Pattern Tata Motors Ltd (TATAMOTORS) as of May 10th, 2025.
Here's a technical analysis:
Prior Downtrend: The stock was in a downtrend from approximately November 2024 until late March/early April 2025, with the low around 535.75.
Cup and Handle Pattern: A "Cup and Handle" pattern is clearly identified on the chart. This is typically a bullish reversal or continuation pattern.
Cup: Formed from roughly early April 2025 to early May 2025. The bottom of the cup is around the 535.75 low.
Handle: A small, slightly downward-drifting consolidation (the handle) formed in early to mid-May 2025.
Neckline/Breakout Level: The resistance level or neckline of this pattern is around 685.40. The price has broken out above this neckline.
Volume:
The chart annotates "Good Volume" during the formation of the right side of the cup and especially on the breakout from the handle. An increase in volume during a breakout is a positive sign and adds validity to the pattern.
Support and Resistance:
Immediate Support: The breakout level around 685.40 (the neckline) should now act as a key support level.
Major Support: The low of the cup around 535.75 is a more significant support level.
Resistance/Target: The chart indicates a potential target of 837.25. This target is calculated by adding the depth of the cup (approximately 149.80 points) to the breakout level of the neckline.
Recent High: The chart also shows a "High" marked at 886.75, which seems to be a much earlier high (likely before the period shown in detail for the cup and handle) and would act as a longer-term resistance if the price moves significantly beyond the pattern's target.
Interpretation:
The chart for Tata Motors suggests a bullish outlook following the breakout from the Cup and Handle pattern.
The "Good Volume" accompanying the breakout adds strength to this bullish signal.
The stock has successfully surpassed the neckline resistance at 685.40.
The primary target based on this pattern is 837.25.
It's important for the price to hold above the 685.40 support level to maintain the bullish momentum. A fall back below this level could weaken the immediate bullish outlook.
Disclaimer: This technical analysis is for educational purposes only and should not be considered as financial advice. Trading and investing in the stock market involve risks. Always conduct your own thorough research and consult with a qualified financial advisor before making any investment decisions.
Sources and related content
KPRMILL - Daily - Cup and Handle - BreakoutPattern: "Cup and Handle" pattern
Cup/Rounding Bottom: Formed from approximately late 2024/early 2025 to late April 2025, with the low around 755.50.
Handle: A small consolidation (handle) has formed in early May 2025, right at the neckline.
Neckline: The resistance or neckline of this pattern is around 1,083.00 - 1,084.40. The price is currently testing or attempting to break out above this neckline.
Volume: A significant volume spike is visible on the most recent candle, which is attempting the breakout. This is a positive sign.
Target: The depth of the cup (approximately 324.15 points) projected from the neckline gives a potential target of around 1,408.50.
Support: The neckline around 1,083.00 - 1,084.40 will act as support if the breakout is successful. The low of the cup (755.50) is major support.
Resistance: The immediate resistance is the neckline itself. Once cleared, the target of 1,408.50 becomes the next significant resistance.
Interpretation: KPR Mill is at a crucial juncture, attempting to break out from a large bullish pattern. The high volume on the breakout attempt is encouraging. A sustained close above the 1,084.40 level would confirm the breakout and suggest a move towards the 1,408.50 target

Vintage Coffee and Beverages Ltd (VINCOFE) - Daily ChartVintage Coffee and Beverages Ltd (VINCOFE) - Daily Chart
Pattern: A clear "Cup and Handle" pattern is identified.
Cup: Formed roughly between late February 2025 and late April 2025, with the low around 75.00.
Handle: A small consolidation (handle) formed in early May 2025.
Breakout: The price appears to be breaking out or has just broken out above the neckline of the cup and handle pattern, which is around the 103.00 - 103.25 level.
Volume: There's a noticeable increase in volume on the breakout day, which is a positive sign, adding strength to the breakout.
Target: The depth of the cup (approximately 29.70 points) is projected upwards from the breakout point. This gives a potential target of around 134.68.
Support: The breakout level around 103.00 - 103.25 should now act as support. The low of the cup (75.00) is a more significant support.
Resistance: The immediate resistance would be the recent swing highs during the handle formation, and then the projected target of 134.68.
Interpretation: The chart suggests a bullish outlook following the Cup and Handle breakout, supported by good volume. The stock has the potential to move towards the 134.68 target as long as the breakout level holds.

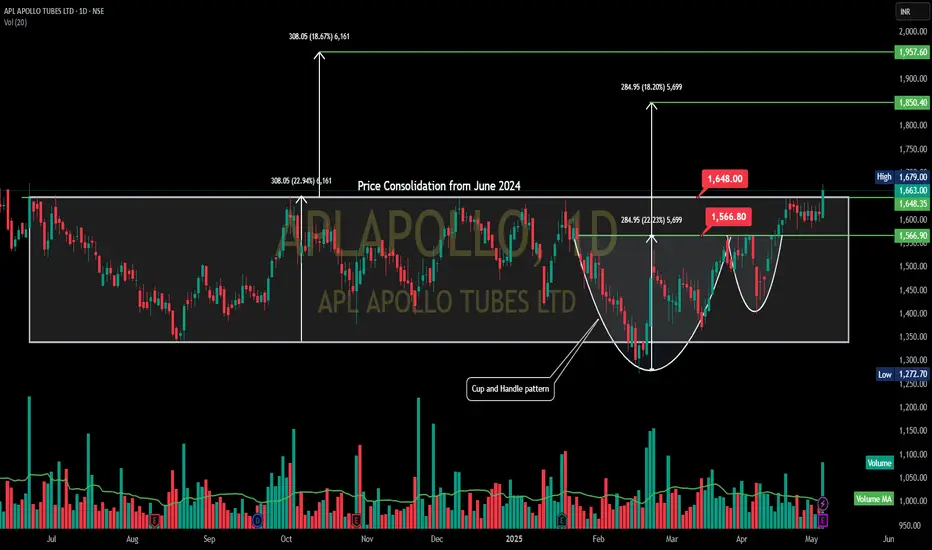
APL APOLLO TUBES LTD - Consilidation- Cup and HandleAPL APOLLO TUBES LTD - Daily Chart
Pattern: The chart shows a period of Price Consolidation from June 2024 within a broad range, roughly between 1,300 and 1,640. Within this larger consolidation, a "Cup and Handle" pattern has formed more recently.
Cup: Formed from approximately mid-February 2025 to mid-April 2025, with the low around 1,272.70.
Handle: A smaller consolidation (handle) formed in late April/early May 2025.
Neckline/Breakout Level: The price is attempting to break out above the neckline of this Cup and Handle, which also coincides with the upper resistance of the broader consolidation range, around 1,640.00 - 1,648.00.
Volume: Volume appears to be increasing on the current breakout attempt from the handle and the larger consolidation.
Target:
The depth of the more recent cup (approximately 284.95 points) projected from the breakout (around 1,586 - which seems to be the C&H neckline) gives a target around 1,850.40.
The height of the larger consolidation (from Oct 2024, approx 308.05 points) projected from the upper boundary breakout (around 1,648) gives a target around 1,957.60. The chart uses both.
Support: The breakout level around 1,640.00 - 1,648.00 is the key immediate support. The low of the cup (1,272.70) is a more significant long-term support.
Resistance: The immediate resistance is the current breakout zone. The projected targets of 1,850.40 and 1,957.60 are the next resistance levels.
Interpretation: APL Apollo is attempting a significant breakout from both a recent Cup and Handle pattern and a longer-term consolidation range. If successful, this could lead to a strong upward move towards the projected targets. The increased volume supports the bullish case. Confirmation above 1,648.00 is key.
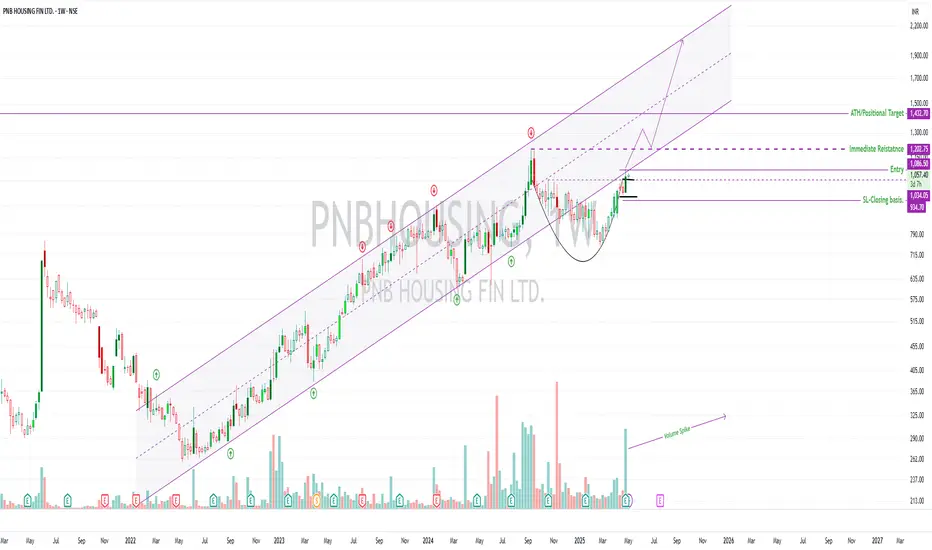
PNB Housing Finance – Weekly Positional Setup🏠 PNB Housing Finance – Weekly Positional Setup
🧭 Strategy: Cup & Handle breakout | 🏦 Sector: Housing Finance / NBFC
🔍 Setup Overview
The stock is trading above key DMAs, indicating strong trend alignment 🔼
Sector momentum is clearly picking up — Housing Finance & NBFCs showing traction 📈
After briefly breaking below its ascending channel, price is now attempting a re-entry — often a bullish sign of reclaiming strength 🔁
A Cup & Handle pattern is forming on the weekly chart — a classical continuation setup 🏺
The first breakout zone was ₹1034.05, which had decent Weekly volume — but caution due to weakness seen in Daily TF 📉
📊 Volume Insight (Why It Matters)
✅ Weekly TF shows volume spike during recent bullish move
⚠️ However, on the Daily TF, red candles had higher volume — suggesting distribution or supply at higher levels
⛔ Avoid low-volume breakouts — these tend to fail or trap early entries
🔑 Wait for a clean Weekly close above ₹1086.50 with volume support(Risk Takers can take the leap now)
🧩 Confluence Factors (Multiple Confirmations = Stronger Setup)
Pattern is forming inside a long-term ascending channel
Reclaiming the channel = bullish structural strength
Sector strength + stock above all key moving averages = powerful context
All this happening in a period where broader market (Nifty 500) is still below 200DMA, making relative strength stand out
⚠️ Macro & Technical Risks
Price could stall or reverse at the positional target near ₹1432.70 (ATH zone)
Geopolitical uncertainty and macroeconomic shifts (rate changes, FII flow) could derail the move
If volume does not accompany breakout, avoid or reduce position
🛡️ Risk Management & Strategy
Use ₹934.70 as SL, based on structure, strictly on closing basis
Total risk: 13.36%, potential reward: 31.85%, giving R:R = 1 : 2.36
Only enter after clear breakout confirmation with volume
This is a positional setup, not a short-term one.
Most important: Position sizing is critical — don’t overcommit on early setups
🎯 Educational Note
Cup & Handle setups are most powerful when supported by:
Multi-timeframe confirmation 📈
Sectoral strength 🏦
Channel/structural context 📐
Volume breakout 📊
Patience is your edge. Enter only when all the pieces align.
Disclaimer: This analysis is for educational and informational purposes only. It does not constitute investment advice or a recommendation to buy or sell any securities. Always conduct your own research and consult with a qualified financial advisor before making any trading decisions. Past performance is not indicative of future results. Trade responsibly.
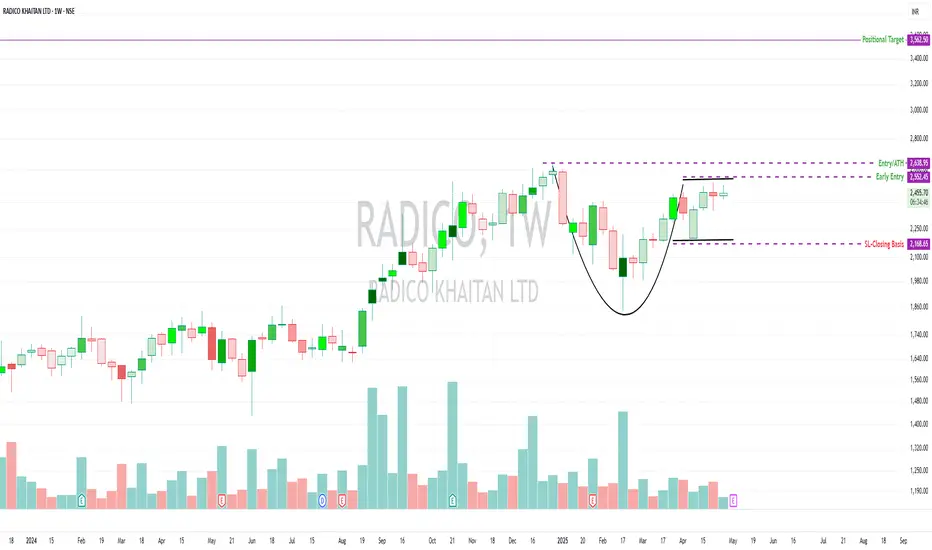
RADICO – Cup Base Forming | Testing Waters, No Diving Yet📈 RADICO – Cup Base Forming | Testing Waters, No Diving Yet
RADICO is forming a classic cup base on the weekly chart, trading above key DMAS with improving structure and RSI strength. A pilot entry to test the strength of the setup — not a full position.
🔍 Technical Overview
🟢 Structure: Well-formed cup attempting a neckline test
⚠️ Volume: Currently drying up — wait for breakout + volume spike
📍 Entry: Early Pilot Entry t at ₹2,552.45
✅ Add only if ATH breaks (₹2,638.95) with a clean weekly candle and volume confirmation
⚖️ Risk Management
❌ SL is deep (~15%) — manage position sizing carefully
💡 Expect shakeouts — volatility remains elevated
🧠 This is a positional pick, not a short-term play
🔄 Risk: Reward planned near 1:2, but no hard target in the current market volatility
⚠️ Macro Context
Nifty 500 is still below its 200 DMA
The market is not fully out of danger
Be nimble, not aggressive
🧠 Final Thoughts
Test the setup, don’t commit fully yet
Let volume confirm — breakout without power = trap risk
Trade as per your style
Risk management isn’t optional — it’s survival
📉 Disclaimer:
This is not investment advice. For educational purposes only. Do your own research and manage capital based on your strategy.
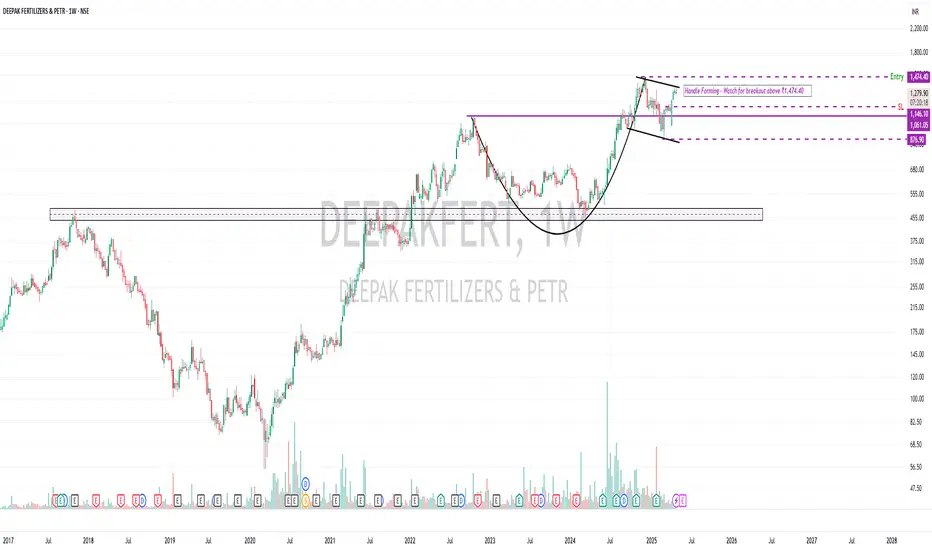
DEEPAKFERT – Classic Cup & Handle Setting Up on the Weekly Chart📈 DEEPAKFERT – Classic Cup & Handle Setting Up on the Weekly Chart
A potential Cup and Handle pattern is forming on the weekly timeframe.
The stock is currently consolidating in the handle zone. A breakout above ₹1,474.5 with a clean candle and strong volume could trigger a positional move.
🔍 Technical Overview
✅ Structure: Weekly Cup & Handle formation in progress
✅ Currently consolidating within the handle
✅ Trading above key DMAs
✅ Volume is still dry – wait for a volume spike to confirm the breakout
✅ Sector showing strength – tailwind in favour
🎯 Levels to Watch
📌 Entry Above ₹1,474.50 (Breakout Confirmation)
🛡️ Stop Loss ₹1,146.10 (22.3%)
🎯 Positional Target To be updated post-breakout (1:2 R:R base)
⚖️ Strategy & Risk Management
SL is deep due to volatile broader market — shakeouts are common
Risk management & position sizing is crucial here
Consider gradual accumulation rather than full entry at once
Trade as per your style — high reward setups also come with structure-based risks
🧠 Final Note:
This is a positional setup, not a short-term sprint.
Let the pattern mature and watch for a decisive breakout with strong volume confirmation.
📉 Disclaimer:
This is not a buy/sell recommendation. For educational purposes only. Do your own research and manage your capital wisely.
Vishal Mega Mart Ltd (VMM) Cup and Handle BO with good volumeThe chart you've provided is a **cup and handle breakout pattern** for *Vishal Mega Mart Ltd (VMM)*, which is a classic bullish continuation pattern in technical analysis.
### Key Observations:
1. **Cup and Handle Formation**:
- The "cup" part of the pattern formed over February to mid-April.
- The "handle" formed shortly after and broke out with a strong bullish candle on April 30.
2. **Breakout Details**:
- Breakout above the resistance zone of **₹113.50–₹117.41**.
- The stock closed at **₹118.48**, up **10%** on high volume—indicating strong buying interest.
3. **Price Target Projection**:
- Depth of the cup is approximately **₹17.56**.
- Projected target from breakout point (₹117.41) is around **₹127.50**, which is also marked on the chart.
4. **Volume Confirmation**:
- Significant volume spike on the breakout day supports the validity of the breakout.
### Summary:
This breakout is a bullish signal, and the target is around **₹127.50**, as long as the price sustains above the **₹113.50** support zone. A retracement to retest this breakout zone is possible, but the pattern remains valid unless it breaks below this support.

TATACONSUM – Cup & Handle Breakout | VCP Formation🔍 Technical Overview:
The stock has broken out of a classic Cup & Handle pattern.
Early bird entry was around ₹1143.45.
Currently trading near the 1-year ATH resistance at ₹1253.85.
A Volume Contraction Pattern (VCP) might be playing out, with visible contractions and tight price action in the handle.
Strong volume spikes seen during recent upmoves—indicating institutional interest.
📊 Price Levels:
📍 Entry Zone: ₹1143.45 – CMP
📍 Resistance to watch: ₹1253.85 – Breakout above this with volume can propel the stock higher.
📉 Stop Loss: ₹993.50 (on closing basis)
✅ Trading well above key DMAs (50, 100, and 200)
🌐 Market Context:
While Nifty is holding above its 50 & 200 DMA, the Nifty 500 index is still below the 200 DMA, indicating broader market caution.
Expect volatility and shakeouts in the near term.
Market breadth is improving but risk management remains crucial.
⚠️ Risk Note: The current setup is promising, but given the broader market's fragile structure, strict SL adherence and position sizing is key.

Godfrey Phillips India Limited - 1D - Breakout
Pattern: A cup and handle formation is visible, suggesting a potential breakout.
• Trendlines: Two white downward trendlines indicate previous resistance levels, with the price recently breaking above them.
• Breakout: The latest price action shows a breakout above resistance around ₹7,107, which could indicate a bullish move.
• Volume: The volume bars at the bottom show increasing volume, confirming the breakout.
Indicators:
• RSI (Relative Strength Index) Indicator (Bottom Panel):
• The red line (72.00) represents the RSI value.
• The yellow-green line (60.61) likely represents a moving average or signal line.
• The RSI above 70 suggests the stock is gaining relative strength and could be in an overbought zone.
Resistance Levels:
1. ₹7,100 - ₹7,150 (Breakout Zone) → The stock has recently broken above this resistance. A successful retest and hold above this level could confirm further upside.
2. ₹7,600 - ₹7,700 → Next key resistance from previous highs (potential target if the breakout sustains).
3. ₹8,000+ (All-Time High Zone) → If momentum continues, this could be a longer-term target.
Support Levels:
1. ₹6,800 - ₹6,850 (Breakout Retest Level) → If the price pulls back, this level should act as strong support.
2. ₹6,400 - ₹6,500 (Psychological & Trendline Support) → Below this is the next strong support from past price action and trendline.
3. ₹6,000 (Major Support Zone) → A breakdown below this could invalidate the bullish trend.

Bajaj Finserv Cup & Handle at Play! Will It Break Out?📌 Setup Overview:
Stock in a 4-year trading range 📊 and currently trading just below this range.
Cup and Handle formation ☕ along with a potential VCP setup (Volatility Contraction Pattern).
No left-side resistance—unlike stocks that fell 40-50%, there are fewer trapped buyers here.
Volume gradually increasing 📈, a necessary condition for a strong breakout.
Finance sector showing strength 💰—index is trading above key DMAs and broke out of a base first.
Stock is trading above key DMAs, adding technical confluence.
🎯 Trade Plan:
✅ Entry: Above ₹1,941 🔼
✅ Immediate Resistance: ₹2,035 (Watch Price Action at this level)
✅ Stop-Loss (SL - Closing Basis): ₹1,547.80 (20.29% below entry)
✅ Target (Tentative Positional): ₹2,510.30 🎯
📌 Risk-to-Reward (R:R) & Percentages:
SL Percentage: ~20.29%
Target Percentage (from ₹1,941): ~29.34%
R:R Ratio: 1:1.44
⚠️ Key Risks & Considerations:
1️⃣ Immediate Resistance at ₹2,035 – Monitor price action here. If rejected, wait for a re-entry after confirmation.
2️⃣ Deep Stop-Loss (~20%) – Adjust position sizing accordingly. Do not go all-in at once.
3️⃣ Market Structure: If broader markets remain weak, reassess if Bajaj Finserv is showing relative strength or struggling.
📌 Final Thoughts:
Wait for breakout confirmation above ₹1,941 with volume. 🚀
Monitor PA at ₹2,035—strong close above this strengthens the setup.
Stick to SL discipline and trail as stock moves higher.
📢 Disclaimer: This is for educational purposes only. Not financial advice. Always manage risk and do your own research before making any trades.
🚀 Trade smart & stay disciplined!

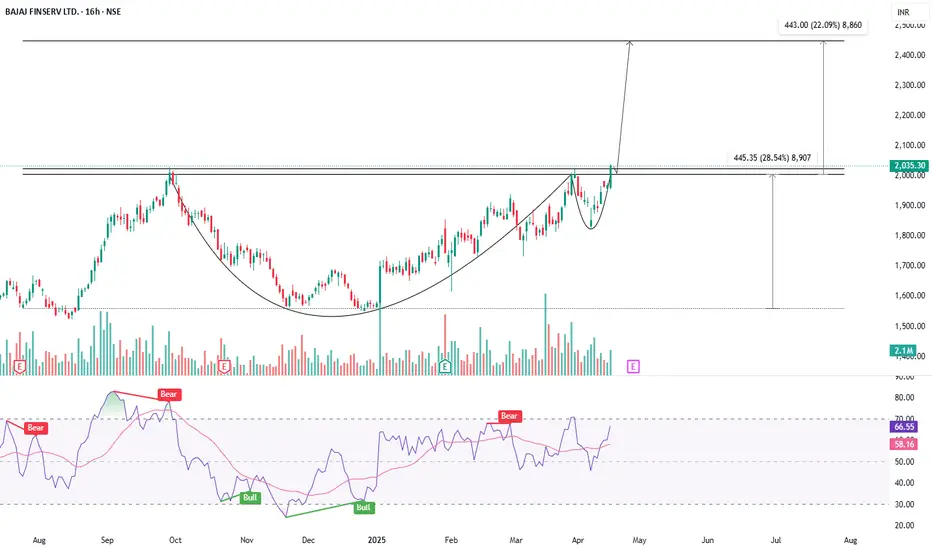
CUP & HANDLE ON THE CHART - IS BAJAJ FINSERV READY FOR LIFTOFF?Symbol - BAJAJFINSV
Bajaj Finserv Ltd. is a leading Indian financial services company engaged in insurance, lending, asset management, and wealth advisory. It operates through its subsidiaries like Bajaj Finance and Bajaj Allianz, making it a major player in the sector. The company is classified as a Systemically Important Non-Deposit taking NBFC.
Bajaj Finserv has recently shown a strong bullish breakout after forming a cup and handle pattern on the larger TF charts - A widely recognized bullish continuation setup. The breakout has occurred with notable volume, lending credibility to the move and signaling the potential for a sustained uptrend.
The stock is currently trading just above its breakout point, and a retest of the breakout zone 1980-2000 is possible. This area now acts as a strong support and provides an attractive entry opportunity for long positions.
Based on the technical pattern, the medium-term target for the move is projected at around 2450, implying an upside of nearly 22% from current levels. The pattern’s depth and the strength of the breakout support this target.
For risk management, a stop loss around 1800 is suggested, just below the handle's base, providing a good risk-to-reward setup.
The formation and breakout from the cup and handle pattern on a higher time frame adds strong bullish conviction to Bajaj Finserv’s chart. For investors looking to ride a medium-term trend with favorable risk-reward dynamics, this may be an opportune moment to enter or accumulate.
Disclaimer: The information provided here should not be construed as a buy or sell recommendation. It reflects my personal analysis and my trading position. Please consider this trading idea for educational purposes only. Thank you!
MRPL is on bullish Reversal mode for 64% gain.MRPL:-
It is showing reversal from support level of 100. (100 is also a psychological level).
It forms Bullish engulf candle at fibbo level 78.6% which is sign of reversal.
This engulfs candle may convert soon in Inv. H&S pattern.
As per chart it may test minimum target of 230 soon which is 64% rise from here.
After cross and sustain above 150 it may take speed.

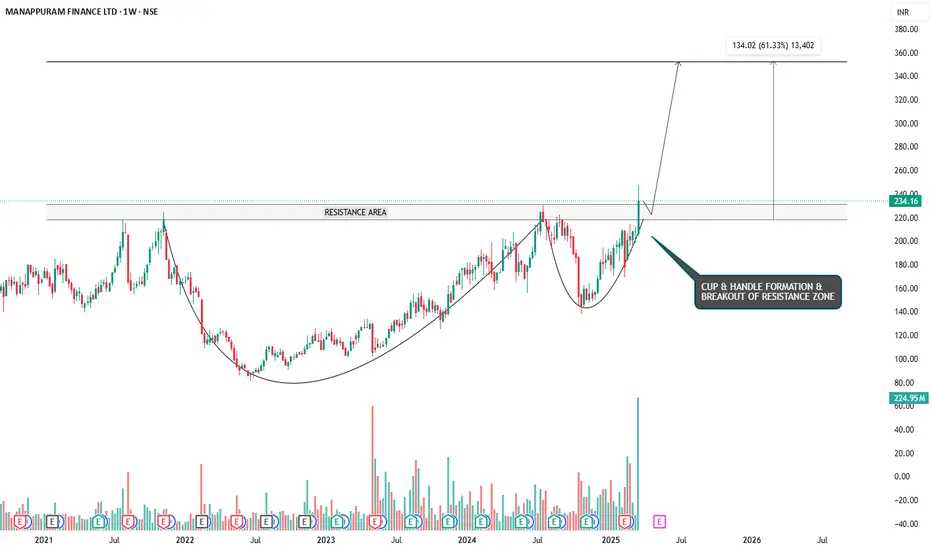
RIDING THE WAVE - CUP & HANDLE BREAKOUT IN MANAPPURAM FINANCESymbol - MANAPPURAM
CMP - 234.16
Manappuram Finance is a Non-Banking Finance Company (NBFC), which provides a wide range of fund based and fee based services including gold loans, money exchange facilities, etc. The Company is a Systemically Important Non-Deposit taking NBFC.
Manappuram Finance Ltd. has recently demonstrated a significant bullish breakout, having formed a classic cup and handle pattern on a larger time frame and breaking out with strong volume. The cup and handle pattern is a well-regarded bullish breakout formation, and when it occurs on weekly or larger time frames, it tends to be highly reliable, indicating a robust upward momentum.
Currently, the stock price may retest the breakout zone, which coincides with the previous resistance area; now turned support - around the 230 to 217 range. This retest is a natural price action behavior and offers an attractive entry point for long positions before the stock continues its upward trajectory.
The target for this breakout, based on technical projections, is around 350, representing a 60% upside from the current market price. Given the strength of the breakout and the established pattern, this target appears achievable over the medium term.
For risk management, a stop loss can be placed around the 197 level, providing a reasonable cushion in case of a price reversal.
From a broader perspective, the formation of a cup and handle pattern coupled with a successful breakout on higher time frames adds a significant bullish bias to the stock. Investors looking for a favorable risk-to-reward setup may find this an opportune time to initiate or add to their positions in Manappuram Finance.
Disclaimer: The information provided here should not be construed as a buy or sell recommendation. It reflects my personal analysis and my trading position. Please consider this trading idea for educational purposes only. Thank you!
Identifying Winning Sectors Before the Big MoveIn this video, we dive deep into how to identify winning sectors before they make their big moves—with a real-world case study on the EMS (Electronic Manufacturing Services) sector.
You'll learn:
How to spot early signs of sector strength using price action and volume.
Why the EMS sector is showing promising signs based on recent market behavior.
Whether you're a swing trader, positional investor, or just looking to sharpen your edge—this video will equip you with actionable insights to stay ahead of the curve.
⚠️ Important: Market conditions are getting better, Position size 20% per Trade. Protect Capital Always
⚠️ Important: Always Exit the trade before any Event.
⚠️ Important: Always maintain your Risk:Reward Ratio as 1:2, with this RR, you only need a 33% win rate to Breakeven.
✅Like and follow to never miss a new idea!✅
Disclaimer: I am not SEBI Registered Advisor. My posts are purely for training and educational purposes.
Eat🍜 Sleep😴 TradingView📈 Repeat 🔁
Happy learning with MMT. Cheers!🥂

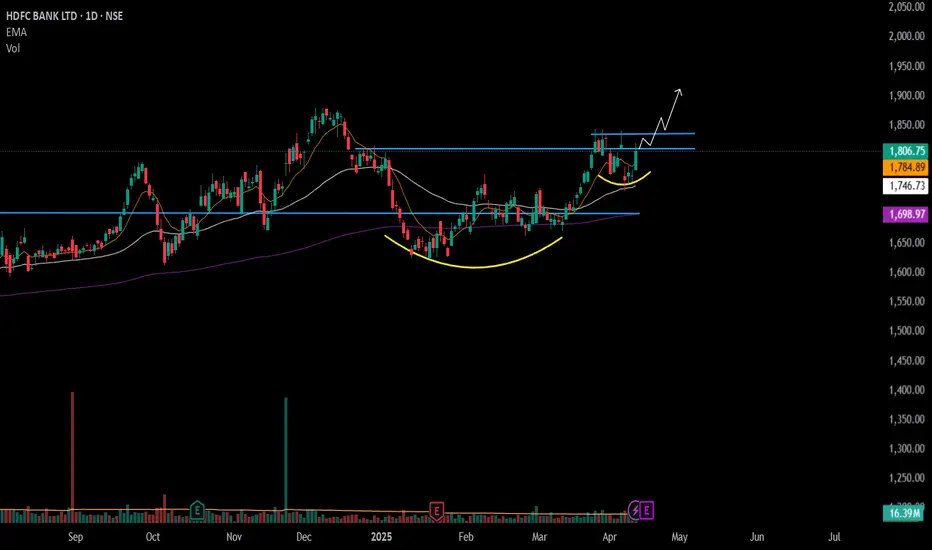
#HDFCBANK - Potential Breakout / Keep in WL 📊 Script: HDFCBANK
Key highlights: 💡⚡
📈 Cup & Handel Break Out in Daily Time Frame.
📈 Price consolidation near Resistance
📈 Enter only if Volume spike is seen.
📈 One can go for Swing Trade.
BUY ONLY ABOVE 1838 DCB
⏱️ C.M.P 📑💰- 1806
🟢 Target 🎯🏆 – NA%
⚠️ Stoploss ☠️🚫 – NA%
️⚠️ Important: Market conditions are bad, Position size 20% per Trade. Protect Capital Always
⚠️ Important: Always Exit the trade before any Event.
⚠️ Important: Always maintain your Risk:Reward Ratio as 1:2, with this RR, you only need a 33% win rate to Breakeven.
✅Like and follow to never miss a new idea!✅
Disclaimer: I am not SEBI Registered Advisor. My posts are purely for training and educational purposes.
Eat🍜 Sleep😴 TradingView📈 Repeat 🔁
Happy learning with MMT. Cheers!🥂