MphasisHello & welcome to this analysis
Stock could be forming a cup & handle pattern in the monthly time frame with the lower leg of the handle coming to an end.
2000 is an extremely important level for the stock in the short term, while it has loads of resistance between 2300-2800 on the upside as it attempts to complete the handle.
Overall weakness continues below 2000, else one could expect stock to rise steadily towards completion of the bullish pattern
Cupandhandlepattern

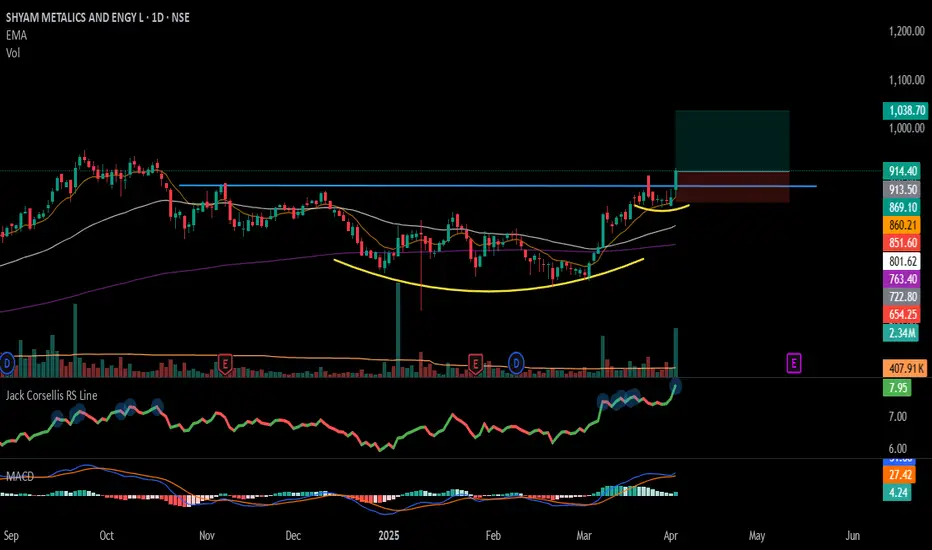
#SHYAMMETL - Cup & Handel Break Out in Daily Time Frame. 📊 Script: SHYAMMETL
Key highlights: 💡⚡
📈 Cup & Handel Break Out in Daily Time Frame.
📈 Price consolidation near Resistance & gave a BO with Volume
📈 Volume spike seen.
📈 MACD Bounce
📈 RS making 52WH
📈 One can go for Swing Trade.
BUY ONLY ABOVE 915 DCB
⏱️ C.M.P 📑💰- 914
🟢 Target 🎯🏆 – 14%
⚠️ Stoploss ☠️🚫 – 7%
️⚠️ Important: Market conditions are getting better, Position size 50% per Trade. Protect Capital Always
⚠️ Important: Always Exit the trade before any Event.
⚠️ Important: Always maintain your Risk:Reward Ratio as 1:2, with this RR, you only need a 33% win rate to Breakeven.
✅Like and follow to never miss a new idea!✅
Disclaimer: I am not SEBI Registered Advisor. My posts are purely for training and educational purposes.
Eat🍜 Sleep😴 TradingView📈 Repeat 🔁
Happy learning with MMT. Cheers!🥂
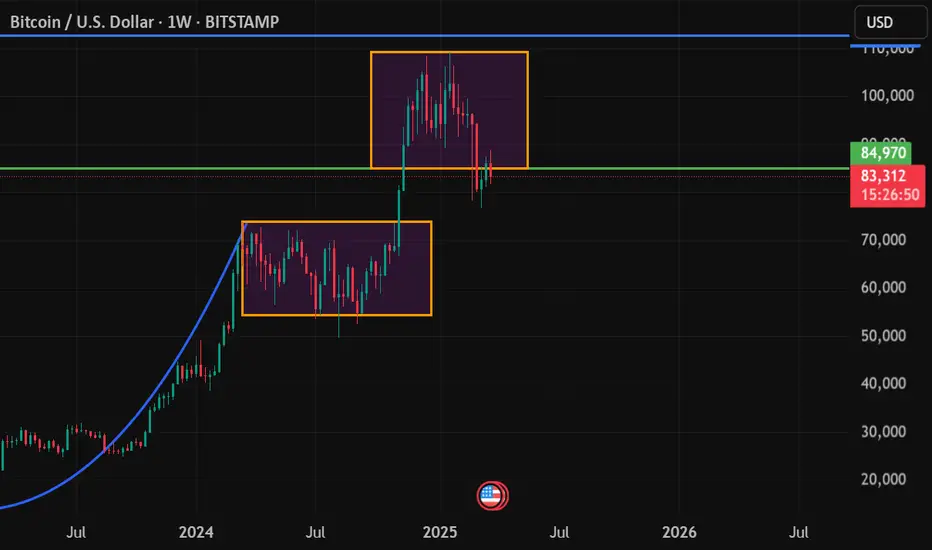
Bitcoin Weekly Analysis: Two Consolidation Phases Market Overview
Bitcoin is currently consolidating after reaching $108K, forming a cup and handle pattern on the weekly timeframe. This is the second major consolidation phase in BTC’s recent uptrend. The first phase, seen earlier in the cycle, led to a powerful breakout, and history could repeat if BTC clears FWB:88K –$90K.
BTC remains in a pre-breakout phase, and the coming weeks will determine whether it surges toward new all-time highs or undergoes a deeper correction.
Two Major Weekly Consolidation Phases
1st Consolidation Phase (July–Dec 2024):
BTC traded within a $56K–$72K range, forming the base of the cup.
Once BTC broke out of this range, it rallied straight to $108K, confirming a strong uptrend.
2nd Consolidation Phase (Feb–Present 2025):
BTC peaked at $108K and started a healthy retracement, forming the handle of the pattern.
It is now trading between $80K– FWB:88K , preparing for the next breakout.
This consolidation mirrors the first phase and could fuel another explosive move higher.
Technical Breakdown
1. Key Support & Resistance Levels
Support Zones:
$80K– GETTEX:82K → Short-term support; must hold to sustain bullish momentum.
$74K–$76K → If BTC drops lower, this zone should act as strong demand.
Resistance Zones:
FWB:88K –$90K → The breakout level; BTC needs to close above this to confirm bullish continuation.
$100K–$108K → Major resistance; if cleared, BTC enters price discovery mode.
2. Breakout Potential & Price Targets
A weekly close above $90K signals a confirmed breakout of the second consolidation phase.
Measured Move Target:
Short-Term: $108K retest.
Extended Target: $120K+ if bullish momentum continues.
3. Bearish Scenario & Invalidation
A failure to reclaim FWB:88K –$90K could lead to an extended consolidation.
A break below $80K weakens the cup and handle setup.
If BTC drops below $74K, we may see a retest of the $72K–$74K range before a renewed attempt to break out.
Final Take: Preparing for the Next Big Move
Bitcoin’s price action closely resembles its first consolidation phase, which resulted in a breakout to $108K. The current consolidation is setting up for another strong move, with FWB:88K –$90K acting as the key breakout zone.
If BTC follows the same pattern, we could see a powerful surge to $120K+ once resistance is cleared. However, failure to hold $80K may delay the breakout.
We should watch for a decisive weekly close above $90K as confirmation for the next major bullish leg!
ZEEL : Breakout Candidate#zeel #trendline #breakout #patterntrading #chartpattern #cupandhandlepattern #momentumtrade #swingtrade
Zeel : Swing Trade
>> Trendline Concept
>> Cup & Handle chart pattern visible
>> Moving Avg Concept also suggests Breakout of 50 EMA
>> Breakout point of Trendline / Chart Pattern & Moving Avg concept are all in confluence at same point. (Refer both charts)
>> Hence its a Breakout candidate, probability is higher
>> Upside potential is of 20-25% & Downside Potenial is 9-10%
>> So a good 1:2 Risk Reward Trade
Swing Traders can lock profit at 10% and keep Trailing
Please Boost, comment and follow us for more Learnings.
Note : Markets are still Tricky and can go either ways so don't be over aggressive while choosing & planning your Trades, Calculate your Position sizing as per the Risk Reward you see and most importantly don't go all in
Disc : Charts shared are for learning purpose only, not a Trade recommendation. Do your own research and consult your financial advisor before taking any position.

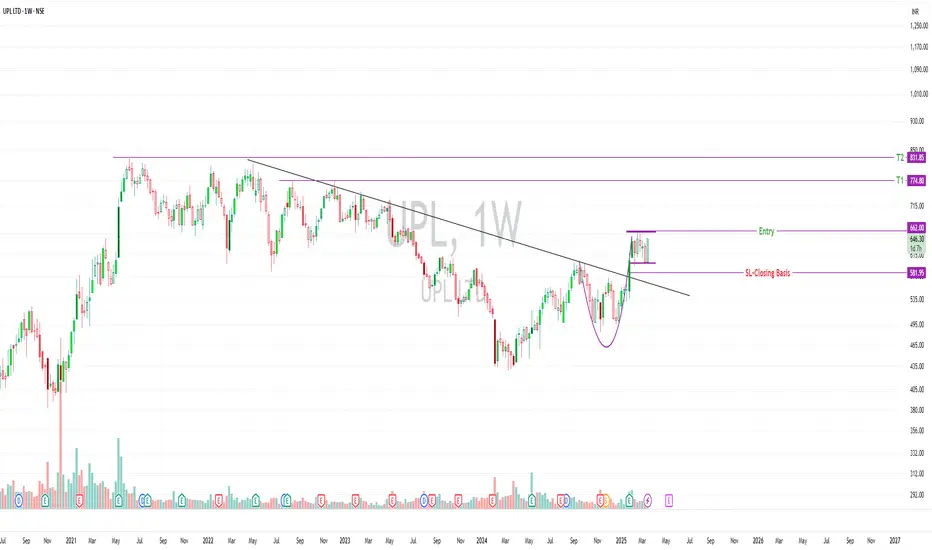
UPL Ltd - Cup & Handle Breakout Setup📊 Trade Plan:
Breakout Entry: Above ₹662 (With 4x-5x Volume Confirmation)
Stop Loss (SL - Closing Basis): ₹581.95
Target 1 (T1): ₹775
Target 2 (T2): ₹831
Current Price: ₹646
📈 Risk & Reward Calculation:
Risk to SL: ₹646 - ₹581.95 = ₹64.05 (9.91%)
Reward to T1: ₹775 - ₹662 = ₹113 (17.07%)
Reward to T2: ₹831 - ₹662 = ₹169 (25.53%)
Risk-Reward (R:R):
To T1: 1:1.72 ✅
To T2: 1:2.57 ✅
📊 Technical Highlights:
✅ Cup & Handle Formation: Classic bullish pattern with a potential breakout
✅ Trading Above Key DMAs: Supports bullish structure
✅ Sectoral Strength: Agrochemicals showing momentum, aiding UPL
✅ Volume Confirmation Needed: Avoid entry without 4x-5x volume spike
✅ Trading Against Trend: Trade light, no heavy positions
📉 Fundamental Concerns:
❌ ROE (-4.28%) & ROCE (3.29%) are poor: Indicates weak profitability
❌ High Debt & Low Efficiency: Capital allocation is not optimal
❌ Dividend Yield (0.15%) is Low: Not an income-generating stock
❌ Market Cap: ₹48,512 Cr – Large cap, but currently weak performance
🔎 Key Insight:
UPL's fundamentals are weak with low profitability (negative ROE) and poor return on capital (ROCE 3.29%), meaning the stock relies more on technical breakout rather than strong financial backing.
⚠️ Risks Involved:
❌ Breakout Failure Risk: If ₹662 is not sustained, stock may fall
❌ Sector Volatility: Agrochemicals are cyclical, demand-dependent
❌ Overall Market Weakness: If Nifty falls, UPL may struggle
❌ Fundamentally Weak: Not ideal for long-term holding
🚨 Disclaimer:
⚠️ This is not financial advice. Trade light and avoid heavy risk, as this setup goes against the long-term trend. Ensure proper risk management before entering. Volume confirmation is a must! 🚀
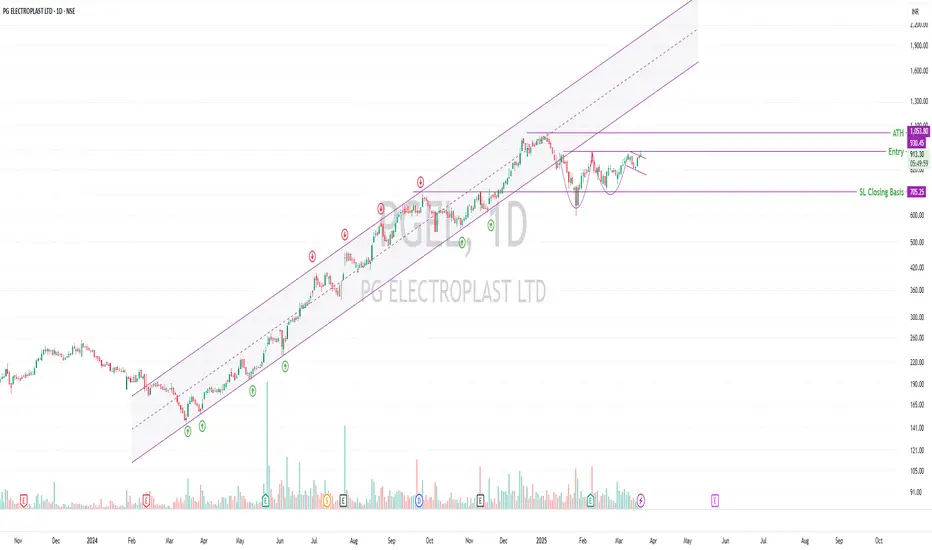
PG ELECTROPLAST LTD (NSE: PGEL):Double Bottom & CNH📈 PG ELECTROPLAST LTD (NSE: PGEL) – Trade Setup & Analysis
🔹 Trend: Stock is in an uptrend, previously a cycle winner. Corrected significantly in the recent market fall but is now recovering and trading close to ATH.
🔹 Technical Highlights:
Trading above key DMAs ✅
Double bottom, VCP, and CNH formation (not textbook-perfect but forming)
Volume missing but RSI improving 📈
Price action near ATH to watch – a high-volume breakout could signal a strong move.
🔹 Key Levels:
Entry: ₹925.70
SL (Closing Basis): ₹705.25 🛑
ATH Resistance: ₹1,053.80
🔹 Market Structure:
LL-LH trend in the broader market, so caution advised ⚠️
Gradual accumulation suggested, wait for confirmation on breakout with volume.
Breakouts are prone to failure in weak markets – risk management is key.
🔹 Fundamentals:
Market Cap: ₹26,226 Cr
Stock P/E: 124 (High Valuation ⚠️)
Book Value: ₹40.5
Dividend Yield: 0.02%
ROCE: 18.7% | ROE: 18.9% ✅
Sales Improving YoY but OPM% needs improvement
EPS Improving, Profits Rising ✅
📌 Final Thoughts:
Monitor price action near ATH – strong volume breakout = potential buy.
Weak market structure means all setups carry a higher failure risk.
Company fundamentals are decent, but valuations are stretched.
🔍 Do your own research before committing capital. This is a potential mover but needs confirmation!
ABBOTINDIA potential gain 33%ABBOTINDIA is forming a cup with handle pattern which has the potential of gain upto 33%

JSW Steel – A Different Perspective.📢 JSW Steel – A Different Perspective (Not a Trade Recommendation)
Let's talk about JSW Steel 🏗️ and why it's worth watching. More importantly, this post is to highlight why you should keep doing your homework even in a bear market 📉. If fear stops you from researching, you might miss the next big move!
🔍 Why This Stock is Interesting:
✅ Uptrend Since May 2022 – The stock has been in an ascending channel 📈, respecting the lower trendline.
✅ Higher Highs & Higher Lows (HH-HL) – The bullish structure remains intact.
✅ Trendline Breakout & Cup and Handle (CnH) Formation – A classic bullish signal ⚡.
✅ Relative Strength – While many stocks corrected 30-40%, JSW Steel held strong with just an 18% correction.
✅ Sector Strength – Metals broke out of consolidation, and if China rebounds, the spillover effect could benefit this sector.
✅ Above Key Moving Averages (DMAs) – Indicates positive momentum 📊.
⚠️ Risks Involved:
❌ The overall market is still weak 🛑.
❌ Bottom formation is uncertain – We might not have seen the final dip yet.
❌ Trading against the trend – Caution is needed when going against broader market sentiment.
🎯 Key Levels to Watch:
🔹 Support: ₹939 – Holding this level is crucial.
🔹 Break Below ₹879 – Could trigger further downside.
💡 Final Thoughts:
Add to your watchlist 📝 and consider accumulating gradually instead of going all in.
If the market falls further, most trades will go against you. Manage risk wisely!
Metals are cyclical – Timing matters ⏳.
📢 Disclaimer: This is for educational purposes only and not financial advice. Always do your own research before making investment decisions!

BOSCH, SAMVARDHNA MOTHERSON & SONA BLWHello & welcome to this analysis
Auto ancillary stocks at strong support levels suggesting a bounce/reversal from current levels with them forming Bullish Harmonic Patterns in weekly time frame
BOSCH - Alt Shark
MOTHERSON - Alt Shark
SONACOM - Cypher
Today's candle were very strong, one can look to add on follow through confirmation or on pullback, the risk reward appears decent at current levels.
In the video I have suggested possible levels of resistance on upside along with negation levels on the downside for each case.
All the best

#CHOLAFIN - VCP / C&H BO in DTF📊 Script: CHOLAFIN
Key highlights: 💡⚡
📈 VCP in DTF
📈 BO with Volume
📈 MACD gave a Bounce
📈 Price consolidated for 85Days
📈 One can go for Swing Trade
⚠️ Over All Market condition is bad, Practice paper trading
🟢 If you have any questions regarding the setup, please feel free to leave your inquiries in the comments, and I will respond promptly.
BUY ONLY ABOVE 1435 DCB
⏱️ C.M.P 📑💰- 1433
🟢 Target 🎯🏆 – 6%
⚠️ Stoploss ☠️🚫 – 2.90%
⚠️ Important: Always Exit the trade before any Event.
⚠️ Important: Always maintain your Risk & Reward Ratio.
✅#Boost, #Like & #Follow to never miss a new idea! ✅
Disclaimer: I am not SEBI Registered Advisor. My posts are purely for training and educational purposes.
Eat🍜 Sleep😴 TradingView📈 Repeat 🔁
Happy learning with MMT. Cheers!🥂

Cords Cables-Can it continue to be a multibagger?Cords Cables is a small cap company which is available at a perfect position technically.
Zone of 140-150 was a supply zone earlier which now should become a demand zone.
If stock manages to bounce from here with good volumes, it can continue its multibagger journey towards big targets.
However, if this zone is breached, stock can fall rapidly so it sis make or break level for stock technically.
Very risky. Keep in watchlist to study and learn.
Not a recommendation.

Senores Pharma: Cup & Handle - Ready for Some Action?NSE:SENORES
Senores Pharma is forming a potential cup and handle on the daily timeframe. A breakout attempt on Feb 6, 2025, failed to sustain above ₹607.35 as selling pressure came in second half.
Now, the cup and handle pattern is progressing, making next week crucial. A close above ₹607.35 is the key level to watch for confirmation.
Volumes are rising, with today's volume (Feb 21, 2025) nearly 5x yesterday's. The stock's resilience despite market pressure indicates strength.
Cup and Handle pattern usually don't disappoint so would be interesting to watch.
Senores Pharmaceuticals is a research-driven company focused on developing specialty pharmaceutical products for regulated markets. The company has shown impressive financial performance:
Recent Financials (Q3 FY25):
Net Sales: ₹106.4 crore (up 35% YoY from ₹78.7 crore in Q3 FY24)
QoQ Performance: Increased from ₹104.4 crore in Q2 FY25 (up 1.92%)
EBITDA: ₹29.1 crore (up 92% YoY)
PAT: ₹17.2 crore (up 142% YoY from ₹7.1 crore in Q3 FY24)
9MFY25 Performance:
Total Revenue: ₹288.1 crore (up 157% YoY from ₹112.1 crore in 9MFY24)
PAT: ₹40.7 crore (up 162% YoY)
Market Position : The stock has outperformed its sector and the broader Sensex, achieving consecutive gains over the past month and trading above multiple moving averages.
Future Projections : Management anticipates a top-line growth of 50%-60% for FY26, with plans to launch five new products in the current quarter.
Strategic Focus : Continued investment in R&D and infrastructure development is expected to enhance manufacturing capabilities and expand product offerings.

USD/INR - Where the rupee is heading, Will it reach the 90s?FX_IDC:USDINR
Looking at the daily chart of USD/INR we can see a breakout at 86.68 level. And now there is a retracement from 87.95 levels. The question is whether it will make a new high or not, should we remain bullish on USD?
Let's refer the history to find a high probability answer.
From Oct'18 prices consolidation for 1.5 years. During this period there was cup and handle (C&H) formation followed by a breakout in Feb-20 @72.5 INR.
Note that the base of the handle was at 70.55 INR.
The momentum continued till 77 Rs in Apr-20.
If we draw a fibo extension from 70.55 to 77 (Δ 6.45), and apply it from the next C&H breakout at 77 Rs in May-22. The upmove followed this breakout made a high @ 83.285Rs. which is approx equal to (B/o pt + Δ) = (77+6.45 = 83.45).
Now Lets apply this concept to find the high of current bull run.
Let draw Fibo extension from base of the handle to top of the the entire run i.e from 75.288 to 83.285 (Δ ≈ 8)
And apply it from the B/o of C&H pattern @83.41 Rs.
So the next targets are {(B/o pt + Δ) = (83.41+8 = 91.41)} or {(B/o pt + 1.618*Δ) = (83.41+1.618*8 = 96.35)}

Hindustan UnileverHello & welcome to this analysis
FMCG sector appears to be doing better then other sectors after a very long time with Hindustan Unilever having a large weightage in the sector
Strength signal -
Since 2008 it has never violated the Quarterly Ichimoku Base line nor the Monthly Ichimoku Cloud. Near these support levels it becomes a very attractive value buy. This time also in 2024 it did the same.
After giving a Cup & Handle breakout in the weekly time frame its seen a pullback since October 2024 along with the rest of the market. In the last 3 weeks its gone sideways whereas we have seen other sectors continue to see sharp selling. Once again highlighting that current level is seeing consistent buying support. The pullback appears to have been completed as it bounced back from its rising trend line.
A daily falling wedge breakout has also witnessed a pullback now. As long as it now holds the rising trendline at 2350 it has good potential for upside suggesting a decent low risk high reward set up from short to medium term.
Upside levels one can look out for above 2400 are at 2700 / 3100 / 3300 / 3600
All the best for your trading and investing
My last video on the stock link is shared

Redington Ltd – CNH & Inverse H&S Trade with Caution!🚀 Pattern Highlights
Cup and Handle & Inverse Head and Shoulders:
Redington is showing a potential Cup and Handle (CNH) formation alongside an Inverse Head and Shoulders, signaling a breakout at ₹238–₹240.
📊 Technical Levels
Entry: ₹238–₹240 (Breakout Level)
Stop Loss: ₹181 (24% below, on a daily closing basis)
Target: ₹340 (~42% upside, positional/medium-term)
Risk-Reward Ratio: ~1:1.75
🕵️♂️ Observations
1️⃣ The stock is trading within an ascending channel, forming higher lows.
2️⃣ It's below its 52-week high but not correcting much during this bearish phase.
3️⃣ The channel top may act as a key resistance.
4️⃣ Still in Higher High (HH) and Higher Low (HL) format while many other stocks have transitioned to Lower High (LH) and Lower Low (LL) structures.
5️⃣ Volume confirmation will be crucial for a breakout.
⚠️ Risks to Consider
Market Sentiment: Current market conditions are bearish, with indices correcting and most sectors showing weakness.
Bearish Transition?: No confirmation if this is a bull market correction or the start of a bear market.
Earnings Season: Quarterly results are around the corner, which could bring surprises.
📌 Why Risk Management Is Key
Example: Newgen Software recently broke out at ₹1,548 (ATH), moved ~15%, but then plunged 41% in just 9 trading sessions, trapping bulls.
Solution: Trade light with 7–10% of your usual position size (e.g., buy 7 shares if you usually buy 100). This limits risk while keeping you involved.
🏁 Conclusion
Trade cautiously: Position size, risk management, and patience are your best tools here.
If the stock doesn’t fall further, it could be an ideal candidate when the market reverses and bottoms out.
For Beginners: Avoid this trade for now. Add it to your watchlist and observe.
✨ Final Thoughts
Redington is trading tightly above its key DMAs with narrow-range candles. This indicates strength despite market weakness. Watch closely for a breakout confirmation.
🔍 Disclaimer
This is not financial advice. Do your own research (DYOR) and consult a financial advisor before making investment decisions. Trading involves risks, and capital is at stake. This idea is shared for educational purposes only.

Motherson Sumi-Can it fly from here?Motherson Sumi is now available at a very beautiful demand zone.
It is retesting previous cup and handle breakout and also is near a trendline support.
Any bounce from this zone will give good returns in stock.
Levels are mentioned on chart. One of the best stock within auto ancillary sector.
If you trust EV theme, this stock should be on radar.

CarTrade Tech- CnH FnP. Keep on Radar📊 CarTrade Tech - Technical Analysis 🚗
Reason for Picking This Stock:
CarTrade Tech has been in an uptrend since March 2023, trading within a rising channel. The stock tends to take support near the 50 DMA and the channel bottom, showcasing strong demand in those areas.
✨ Key Highlights:
1️⃣ Breakout from 3.5-Year Resistance: The stock has broken above a significant 3.5-year-old resistance level of ₹1,622.85 and gave a weekly closing above it.
2️⃣ Chart Patterns:
Cup and Handle (CnH) formation near the 3.5-year resistance.
Flag and Pole (FnP) pattern adds conviction to the breakout.
3️⃣ No Overhead Resistance: The left side of the chart shows no major resistance, providing room for upside movement.
4️⃣ Relative Strength in Market Correction: The stock has held strong during the broader market correction.
🎯 Trading Levels & Risk-Reward (R:R):
Entry: ₹1,835
Stop Loss (Closing Basis): ₹1,514
Positional Target: ₹2,543
SL %: 17.5%
R:R: 1:2
📌 How to Trade:
✅ Wait for Confirmation: A clear breakout with volume and a wide-range candle will strengthen the setup.
✅ Small Position Size: As the market trend is bearish, trade with reduced risk.
✅ Pullback Entry: Look for a pullback to the 50 DMA region or channel bottom for better risk-reward entries.
✅ Add on Base Formation: If the stock consolidates above the breakout level and breaks out again, consider this as a further entry point.
⚠️ Risk Considerations:
🚨 The broader market is trading well below the 50 DMA and 200 DMA, with a death cross in play. Committing large capital at this point may not be advisable.
🚨 This is a pure technical call on a fundamentally weak company. Perform your own due diligence before trading.
💡 Key Points to Watch:
1️⃣ Clear breakout from the Flag and Pole (FnP) and Cup and Handle (CnH) patterns.
2️⃣ The channel top may act as a resistance, so monitor price action near those levels.
3️⃣ Broader market stabilization above the 200 DMA and 50 DMA is crucial for larger capital deployment.
🚦 Final Thoughts:
CarTrade Tech is showing relative strength in a falling market—a key factor for stock selection during corrections. The intention is to highlight opportunities in stocks performing well despite broader market weakness. Trade cautiously and stick to strict risk management. 💪 and do not wait for target to be achieved in this market condition. Try to book partial and trail SL.
📉 Disclaimer: This analysis is for educational purposes only and not financial advice. Always consult your financial advisor before making any trading decisions.

#LAURUSLABS - Potential Stage 1 Breakout 📊 Script: LAURUSLABS
Key highlights: 💡⚡
📈 C&H formation in weekly chart.
📈 Price gave a good up move
📈 Went Side Ways, wait for more consolidation near Resistance
📈 Volume spike must be seen on BO
📈 MACD Bounce
📈 One can go for Swing Trade.
BUY ONLY ABOVE NA DCB
⏱️ C.M.P 📑💰- 602
🟢 Target 🎯🏆 – NA%
⚠️ Stoploss ☠️🚫 – NA%
⚠️ Important: Always Exit the trade before any Event.
⚠️ Important: Always maintain your Risk & Reward Ratio.
✅Boost, Like and follow to never miss a new idea! ✅
Disclaimer: I am not SEBI Registered Advisor. My posts are purely for training and educational purposes.
Eat🍜 Sleep😴 TradingView📈 Repeat 🔁
Happy learning with MMT. Cheers!🥂

Bajaj Healthcare - Fresh Opportunity for Upside Move! 📈 Bajaj Healthcare - Fresh Opportunity for Upside Move! 🚀
🔍 Key Observations:
Stock is forming a CNH (Continuation Narrowing Pattern) on the daily timeframe.
Broke out of a 3-year-old trading range on 18th Dec 2023.
Consolidating in a narrow range since 19th Dec 2023.
Volume confirmation (3x-5x) and a strong candle needed for breakout confirmation.
Broader markets are still in a weak structure (LL-LH), so trade cautiously.
🎯 Trade Setup:
Entry: Above 717 (Breakout level).
Stop Loss (SL): Closing below 595 (17.01% risk).
Target 1 (Positional): 942 (31.38% reward).
📊 Risk-Reward (RR):
RR Ratio: 1:1.8
💡 Trading Strategy:
Initial Entry: Buy above 717 with a small test quantity (limit position size).
Add More: On breakout and retest (if it occurs).
Overall Position Size: Keep it low as we are trading against the broader market trend.
Wait for Confirmation: Broader markets need to show signs of reversal (closing above 50-200 DMAs) for scaling in further.
⚠️ Disclaimer:
This is not investment advice. Trade at your own risk.
The broader market is still in a weak structure (LL-LH), and the probability of failure is high.
Always use proper risk management and limit position size.
Past performance is not indicative of future results.
📌 Key Takeaways:
CNH pattern suggests a potential breakout.
Volume confirmation is critical for validity.
Trade cautiously in a weak market environment.
RR of 1:1.8 offers a favorable setup if the breakout sustains.
🚨 Final Note:
Personally, I will scale in only when the broader markets show signs of reversal (closing above 50-200 DMAs).
Until then, trade lightly and stay disciplined!

V2 Retail Ltd: CnH Breakout Setup🛒 V2 Retail Ltd: CnH Breakout Setup
Entry: ₹2,002.85
Stop Loss (SL): ₹1,687 (on closing basis; -15.77%)
Target:
🎯 Positional Target: ₹2,323 (+15.98%)
🚀 Why this trade?
Chart Pattern: Clear Cup and Handle (CnH) breakout with the stock trading in an ascending channel.
Trend Confirmation: The stock is maintaining its position above key Daily Moving Averages (DMAs), confirming strength in the uptrend.
Sectoral Tailwind: Budget 2025 brings a positive outlook for the consumption and FMCG sector, supporting this trade's fundamentals.
Volume: Increasing, but it still needs improvement to strengthen the breakout signal.
⚠️ Key Observations and Risks:
Resistance Ahead: The channel top may act as resistance, so price action near these levels should be watched carefully.
Market Context: Broader market trends are weak, making this a counter-trend trade that adds an element of risk.
Volume Concerns: Volume is yet to fully confirm a breakout; a retest is possible.
📚 Educational Insights:
Channel Tops as Resistance: In ascending channels, the upper boundary often acts as dynamic resistance; breakout strength depends on volume.
Risk Management: With a wide stop loss (closing basis), position sizing becomes critical to limit exposure.
This is a positional trade, so short-term fluctuations shouldn’t influence decisions prematurely.
✅ Suggested Approach:
Take small positions initially to minimize risk while testing the market.
Monitor volume and sector strength for additional confirmation.
Avoid over-leveraging in trades with broad SLs, especially in counter-trend setups.
📈💡 "Adapt to market behavior, but always trade with discipline and patience."
Disclaimer: This analysis is for educational purposes only and should not be considered as financial advice. Trading and investing involve significant risk, and past performance is not indicative of future results. Please consult with your financial advisor before making any trading or investment decisions. Always manage your risk and trade responsibly.

ELGIEQUIP cup and handle patternA cup and handle price pattern on a security's price chart is a technical indicator that resembles a cup with a handle, where the cup is in the shape of a "u" and the handle has a slight downward drift.
The cup and handle is considered a bullish signal, with the right-hand side of the pattern typically experiencing lower trading volume. The pattern's formation may be as short as seven weeks or as long as 65 weeks.
Key Takeaways
A cup and handle is a technical chart pattern that resembles a cup and handle where the cup is in the shape of a "u" and the handle has a slight downward drift.
A cup and handle is considered a bullish signal extending an uptrend, and it is used to spot opportunities to go long.
Technical traders using this indicator should place a stop buy order slightly above the upper trendline of the handle part of the pattern.
The pattern was first described by William J. O'Neil in his 1988 classic book on technical analysis, How to Make Money in Stocks.
Price target of 574

UNITDSPR: Cup & Handle pattern breakout📊 Analysis :
Good bullish candle breakout of C&H pattern with good volume.
📈 Trading Plan :
Entry: Buy above 1565 (wait for a breakout above candle at least 15-30 min with strong volume confirmation).
Target 1: 1650
Stop-Loss: 1525
R:R 1:2

cup and handle breakoutBajaj consumer on weekly timeframe has formed cup and handle pattern and given breakout with good volume. The short term and mid term momentum is also bullish with recent crossover.
the target is of 1:3 which indicates it could be a fair trade.
