#SENSEX | Cup & Handle Breakout Loading?CMP: 82,600
A classic Cup & Handle pattern is forming on the weekly chart of SENSEX , signaling a potential continuation of the long-term uptrend. A breakout above the neckline could trigger a fresh rally.
Pattern: Cup & Handle (Bullish Continuation)
Breakout Confirmation: Weekly close above handle neckline
Pattern Target: +15% upside → ~96,500
Invalidation: Weekly close below 79,741
📌 Key Zones:
Resistances: 84,059 – 84,100 / 85,978 (All-Time High)
Supports: 82,133 / 81,307 / 80,426
⚠️ Watch for a strong weekly close above the neckline to confirm breakout.
📌 Disclaimer: This analysis is shared for educational purposes only. It is not a buy/sell recommendation. Please do your own research before making any trading decisions.
#SENSEX | #BSE | #CupAndHandle | #ChartPattern | #PriceAction
Cupandhandlepattern

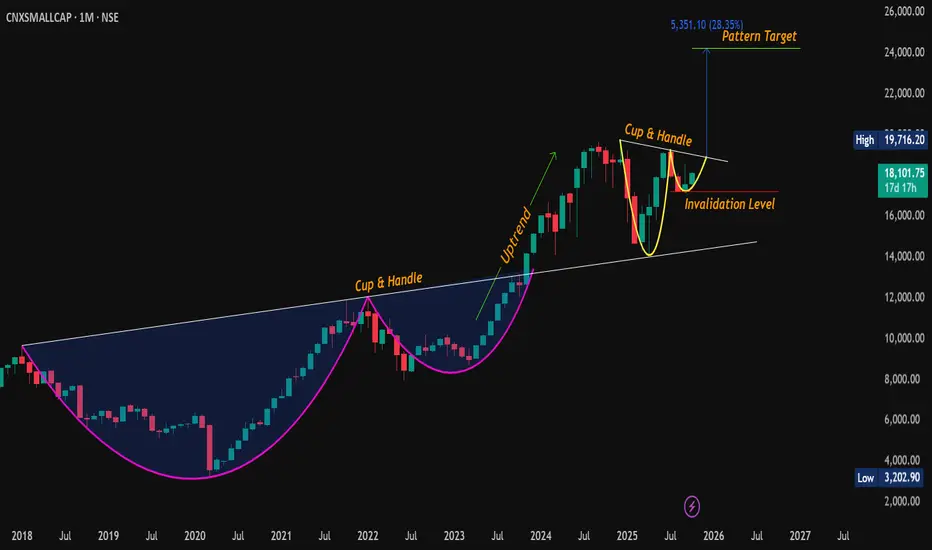
#CNXSMALLCAP | Monthly Cup & Handle Breakout Brewing!Classic Cup & Handle pattern is forming on the monthly chart of Nifty Small Cap Index , signaling potential for a strong bullish continuation if key resistance levels are cleared.
🔹 CMP: 18,102
🔹 Pattern: Cup & Handle (MTF)
🔹 Resistance Zones: 18505 - 18603 / 19075 - 19307 / 19716 (ATH)
🔹 Support Zones: 17601 - 17561 and Handle bottom 17209
🔹 Pattern Target: 24200 (+33% from CMP)
🔹 Pattern Invalidation Level: 17209 MCB
Watch for a strong breakout above the neckline . Monthly close above this level could trigger a fresh rally into uncharted territory.
#CNXSMALLCAP | #SmallCap | #SmallCapIndex | #CupAndHandle | #ChartPattern | #PriceAction | #BullishContinuation
📌 Disclaimer: This analysis is shared for educational purposes only. It is not a buy/sell recommendation. Please do your own research before making any trading decisions.
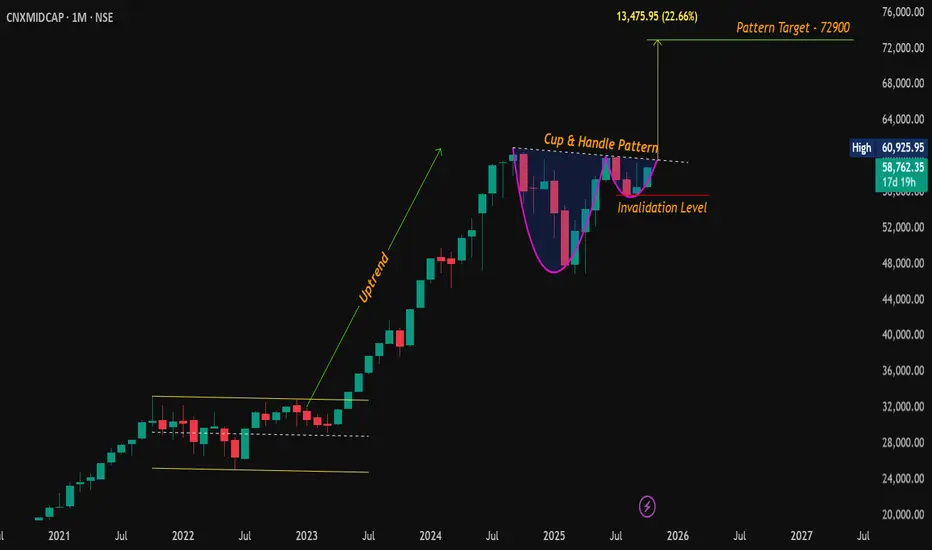
#CNXMidCap | Monthly Cup & Handle Breakout Setting Up!Classic Cup & Handle pattern is forming on the monthly chart of Nifty Mid Cap Index , signaling potential for a strong bullish continuation if key resistance levels are cleared.
🔹 CMP: 58,762
🔹 Pattern: Cup & Handle (Monthly Time Frame)
🔹 Breakout
🔹 Resistance Zones: 59,678 – 60,381 / 60,926 (All-Time High)
🔹 Support: 56,113
🔹 Pattern Target: 72,900 (+24% from CMP)
🔹 Invalidation Level: 55,660 (Monthly Close Below)
Watch for a strong breakout above 60,926 . M onthly close above this level could trigger a fresh rally into uncharted territory.
#CNXMIDCAP | #MidCap | #MidCapIndex | #CupAndHandle | #ChartPattern | #PriceAction | #BullishContinuation
📌 Disclaimer: This analysis is shared for educational purposes only. It is not a buy/sell recommendation. Please do your own research before making any trading decisions.
Beautiful Cup & Handle Trade in L&T Finance in Weekly Time FrameL&T Finance has started its next leg Movement on already completed Cup & Handle breakout.
As you can see from the charts, the price has consolidated for around 8 years under this beautiful cup and Handle formation. Having this pattern in a weekly time frame and having already completed the neckline break out, with excellent retest and pullback, the stock is well poised for a zooming move in further days.
Adding fuel to the move is that its results is expeced on 15th October, which is expected to be super duper as this is festive season.
And in past 15 years, 11 years the scrip has given good returns in the month of October.
Todays Volume is in good numbers.
Stock has closed well above recent 52week high.
Can be considered at below levels:
Entry - >268
Target 1 -> 300 -- Short term
Target 2 -> 348 -- this might take more time.
Stop Loss -< 233 Weekly close below this price.
The above details for educational purpose only.

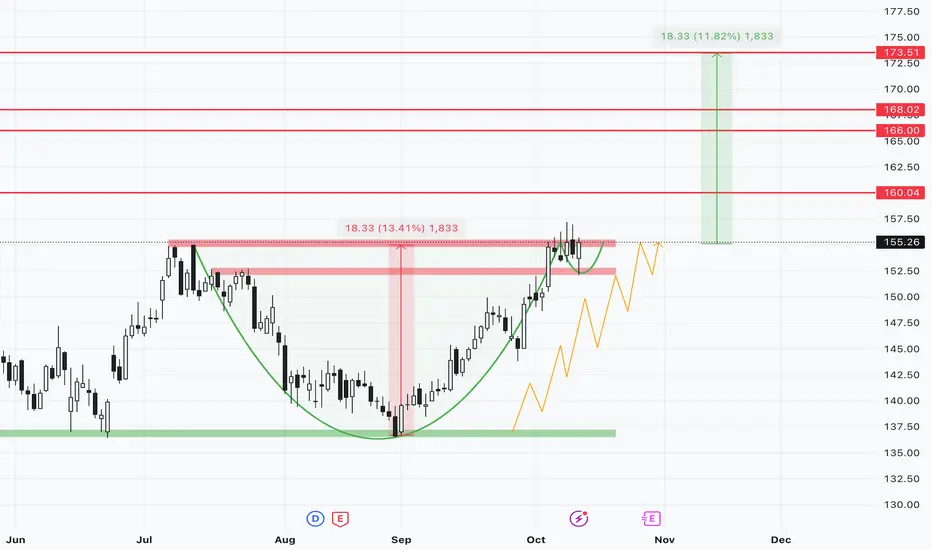
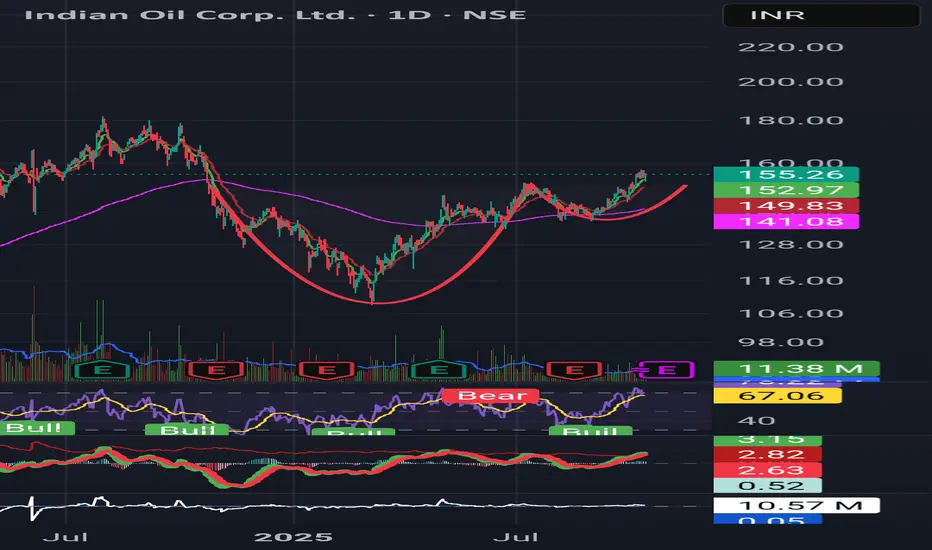
IOC - Potential breakout swing candidateChart Analysis :
Price sustaining near its major resistance of 155 and gave a retest today near 152 level. If breaks out and sustains 1hour above 156 can consider for long. Following a Cup and Handle pattern with Higher Highs intact from recent September lows.
Key Levels :
Support : 152/150
Resistance/Targets : 157/160/166/168/173
StopLoss: 150 Closing basis
Disclaimer:
I am not SEBI registered. This analysis is for educational purposes only and not investment advice. Please do your own research before trading or investing.
IOC forming a strong cup-and-handle breakout. IOC looks strong technically — cup-and-handle breakout on daily chart, trend intact across timeframes.
CMP 155-156;
stop 148.8;
target 180.
Trend supported by momentum & EMAs.
📈 RSI > 65
✅ MACD bullish
📊 Holding above ₹148.8 keeps the trend
#Nifty Weekly Outlook – Cup & Handle in Focus!CMP: 25,285
Primary Trend: Uptrend (Bullish Bias)
🔽 Support Zones
• 25154 – 25084
• 24858 – 24768
• 24588 (Major swing support)
🔼 Resistance Zones
• Immediate Resistance: 25424 – 25449
• Next Hurdles: 25638 – 25669
• Key Breakout Level: 26179 – 26277.35 (ATH)
Pattern: Cup & Handle ☕️
A classic Cup & Handle pattern is forming on the weekly timeframe , following a strong uptrend, which is a bullish continuation setup.
• 🧭 Neckline breakout (sloping white trendline) is the key trigger.
• 🎯 Target Projection: ~29,500 (~16% upside potential post-breakout)
🔒 Pattern Invalidation Level
• Weekly close below 24,337 negates the pattern.
⏳ Awaiting Breakout Confirmation
• A weekly close above the neckline with solid volume will confirm the breakout .
• Until then, price remains in a healthy consolidation.
✅ Dips into support zones can be used for positioning, with proper risk management.
#Nifty | #Nifty50 | #CupAndHandle | #ChartPatterns | #SwingTrading | #PriceAction
📌 Disclaimer: This analysis is shared for educational purposes only. It is not a buy/sell recommendation. Please do your own research before making any trading decisions.

BUY TODAY SELL TOMORROW for 5%DON’T HAVE TIME TO MANAGE YOUR TRADES?
- Take BTST trades at 3:25 pm every day
- Try to exit by taking 4-7% profit of each trade
- SL can also be maintained as closing below the low of the breakout candle
Now, why do I prefer BTST over swing trades? The primary reason is that I have observed that 90% of the stocks give most of the movement in just 1-2 days and the rest of the time they either consolidate or fall
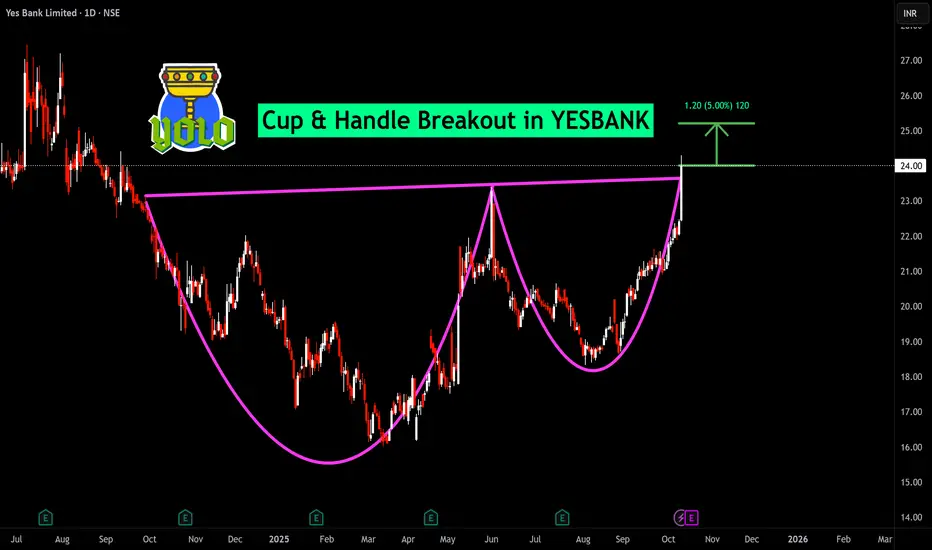
Cup & Handle Breakout in YESBANK
BUY TODAY SELL TOMORROW for 5%
AUROPHARMA | Bullish Cup & Handle Breakout Setup________________________________________
🚀 Aurobindo Pharma Ltd (NSE: AUROPHARMA) | Bullish Cup & Handle Breakout Setup
📊 Current Market Snapshot
CMP: ₹1,119.90
Sector: Pharmaceuticals / Healthcare
Pattern Observed: ☕ Cup & Handle Breakout Formation
Candlestick Signal: Strong Bullish Candle + Volume Expansion
Strength Rating: ⭐⭐⭐⭐☆ (Bullish Breakout Confirmation)
________________________________________
🧭 Technical Overview
Aurobindo Pharma has formed a classic Cup and Handle pattern, signaling trend reversal and continuation strength.
After a steady base formation over the past few months, the stock has broken out above its neckline near ₹1,120 with a powerful bullish candle and rising volume — a strong indicator of institutional buying.
The cup represents accumulation, while the handle reflects a healthy consolidation before breakout.
The volume spike (~4.9M) and RSI breakout confirm momentum strength, supported further by:
✅ Bullish VWAP
✅ BB Squeeze-On Compression (volatility expansion)
✅ Fake Breakdown Recovery (liquidity sweep)
These signals collectively validate a bullish structure with potential upside continuation as long as the price sustains above ₹1,120.
________________________________________
📊 Trade Setup (Cup & Handle Breakout)
Entry: ₹1,126.30
Stop Loss: ₹1,066.80
Resistance: 1132/1145/1164
Support: 1101/1082/1070
Risk/Reward Ratio: 1 : 1 | 1:2
Volume: 4.94M (Above Average)
________________________________________
💡 Learning Note
This pattern is a textbook Cup and Handle breakout, one of the most reliable continuation patterns in technical analysis.
The rounded base (cup) indicates accumulation, while the short handle shows minor profit booking before renewed buying strength.
A decisive breakout above the neckline with volume surge confirms trend continuation — a great example of how volume + pattern confluence can guide traders toward high-probability setups.
________________________________________
⚠️ Disclosure & Disclaimer – Please Read Carefully
The information shared here is meant purely for learning and awareness.
It is not a buy or sell recommendation and should not be taken as investment advice.
I am not a SEBI-registered investment adviser, and all views expressed are based on personal study, chart patterns, and publicly available market data.
Position Status: No active position in Aurobindo Pharma at the time of analysis.
Data Source: TradingView & NSE India (Past Chart Reference) (Historical levels)
Trading — whether in stocks or options — carries risk. Markets can move unexpectedly, and losses can sometimes exceed the capital you have invested.
Past performance or setups do not guarantee future results.
If you are a beginner, treat this as a learning example and practice with paper trades before risking real money.
If you are experienced, always assess your own risk, position sizing, and strategy suitability before entering trades.
Consult a SEBI-registered financial adviser before making any real trading decision.
By engaging with this content, you acknowledge full responsibility for your trades and investments.
________________________________________
💬 Found this useful?
🔼 Give this post a Boost to help more traders discover structured learning.
✍️ Drop your thoughts, questions, or setups in the comments — let’s grow together!
🔁 Share with fellow traders and beginners to spread awareness.
👉 “If you liked this breakdown, follow for more clean, structured setups with discipline at the core.”
🚀 Stay Calm. Stay Clean. Trade With Patience.
Trade Smart | Learn Zones | Be Self-Reliant 📊
________________________________________

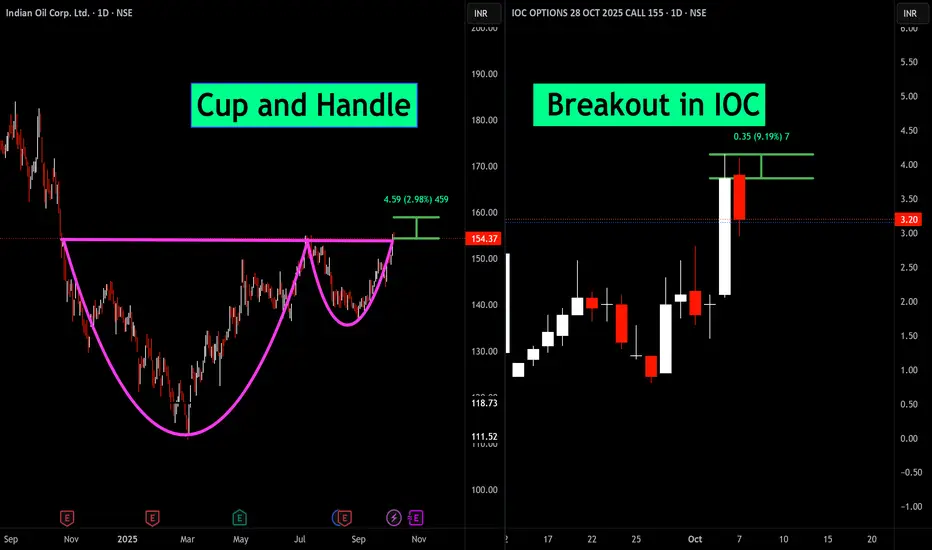
Cup and Handle breakout in IOCdian Oil Corporation (IOC) is exhibiting a classic cup and handle pattern on the daily chart, signaling bullish momentum. Recently, a breakout was observed, supported by strong volume, with a potential upside of nearly 3%. Options activity also confirms bullish sentiment. This setup offers a compelling risk-reward opportunity for traders.
Cup and Handle Breakout and Retested in NYKAANykaa triggers a textbook cup-and-handle breakout on the daily chart, followed by a clean retest that flips resistance into support and signals continuation potential toward the measured move. The 28 Oct 2025 257.5 CE premium surges alongside, reflecting bullish momentum but remains sensitive to decay if price slips back below the neckline

BUY TODAY SELL TOMORROW for 5%3 minutes ago
DON’T HAVE TIME TO MANAGE YOUR TRADES?
- Take BTST trades at 3:25 pm every day
- Try to exit by taking 4-7% profit of each trade
- SL can also be maintained as closing below the low of the breakout candle
Now, why do I prefer BTST over swing trades? The primary reason is that I have observed that 90% of the stocks give most of the movement in just 1-2 days and the rest of the time they either consolidate or fall
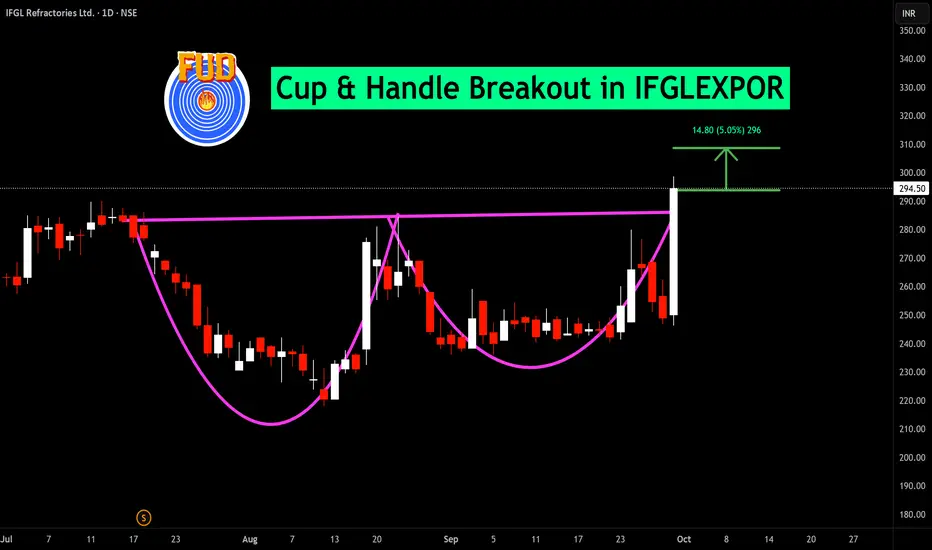
Cup & Handle Breakout in IFGLEXPOR
BUY TODAY SELL TOMORROW for 5%
JK Paper cmp 426.25 by Weekly Chart viewJK Paper cmp 426.25 by Weekly Chart view
- Weekly basis Support Zone 345 to 380 Price Band
- Weekly basis Resistance Zone 445 to 480 Price Band
- Bullish Cup & Handle pattern made surrounding Support Zone
- Volumes spiked heavily last week by close sync with avg traded qty
- Majority of the Technical Indicators BB, EMA, MACD, RSI, SAR on positive trend
- Falling Resistance Trendline Breakout well sustained by price and volumes momentum

Cup & Handle Breakout Expected in Punjab National Bank A classic Cup & Handle formation is visible on Punjab National Bank’s weekly chart, signaling a potential bullish breakout. The pattern is nearing its resistance, with a clear neckline retest. Currently, there is confluence with higher volume on the breakout attempt, further supporting the bullish thesis.
Cup & Handle resistance is set around ₹113 on the weekly chart, with a recent confirmation candle and strong price action.
Call option for 28th October 2025 (113 CE) has moved sharply, with a gain of nearly 12% intraday as speculative interest increases.
Watch for sustained closes above ₹113 for trend continuation. Target for the pattern hints at another 2–3% upside, with stop-loss just below breakout level for risk management.
This post reflects a sell-side trading perspective; maintain strict discipline with entries and exits.

Daily Nifty Analysis: 03/10/25The cup and handle pattern is under formation here.
Support is 24760
Resistance and entry criteria are breached at the 24800-24805 level.
The target of the pattern is 25000, i.e., 200 points above.
On the contrary, the sell will be below 24760, for which I am not focusing much at the moment. On either way, the downside levels are also mentioned.

NYKAA - Cup with handle pattern📈 Pattern Analysis: Nykaa recently completed a "Cup-with-Handle Breakout" , which is a strong bullish continuation pattern. However, the breakout targets have not yet been achieved. In the past few sessions, the stock has witnessed selling pressure, forming a double-top bearish pattern on the chart.
📊 Key Levels & Structure: The price is currently in a corrective phase and may move lower to retest the breakout zone of the cup-with-handle pattern. This zone is expected to act as a strong support level and could provide a fresh opportunity for accumulation if the structure holds.
🔎 Momentum Indicators:
RSI has cooled off from overbought levels, creating room for the next leg of upside.
Volumes during the recent dip are lower compared to the breakout volumes, suggesting the decline is corrective rather than a trend reversal.
🎯 Projection & Outlook:
A successful retest of the breakout zone could resume the uptrend with upside targets around ₹ .... levels in the medium term. Failure to hold the support could, however, lead to extended consolidation.
⚠️ Disclaimer:
This is a technical projection, not an investment recommendation. Traders should manage risk carefully and align strategies with their financial objectives.
Bajaj Health care falling wedge pattern.Price Action: A "weapon candle breakout" is evident, with the price testing 497.60 INR, supported by a "huge volume" spike, indicating strong bullish momentum.
Pattern: A falling wedge pattern is noted, typically bullish, with the breakout suggesting a potential upward trend.
Targets and Support:
As per chart any dip up to 458 is buying opportunity for Price targets are set at 646 INR (TG1) and 784 INR (TG2).
Indicators:
RSI (14, close) at 67.72 nears overbought levels.
MACD shows a bullish crossover.
ADX is in momentum (above 25) with +DI above -DI, confirming trend strength.
Like and support.

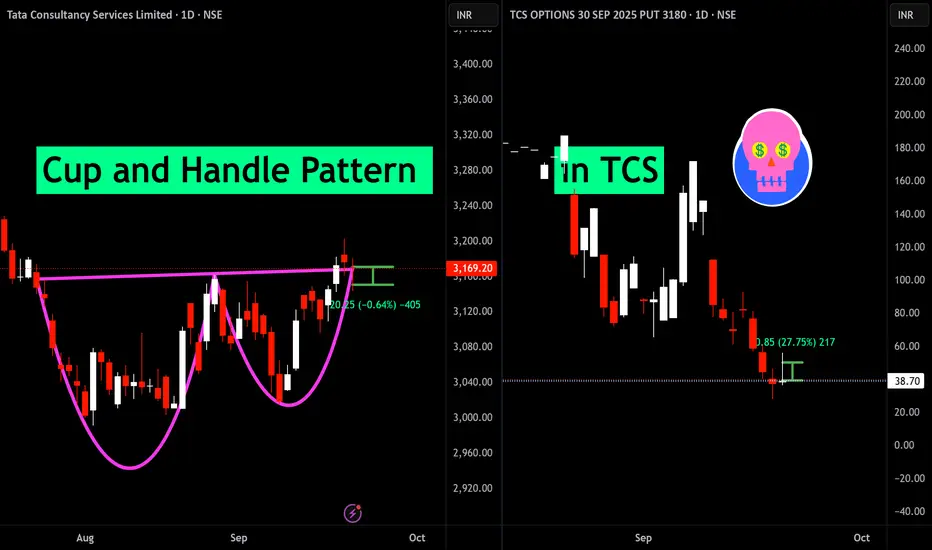
Cup and Handle Pattern failed in TCSThe cup and handle pattern has formed, but the anticipated breakout has not materialized. This failed breakout may indicate the potential for further downside movement in the stock
BUY TODAY SELL TOMORROW for 5%DON’T HAVE TIME TO MANAGE YOUR TRADES?
- Take BTST trades at 3:25 pm every day
- Try to exit by taking 4-7% profit of each trade
- SL can also be maintained as closing below the low of the breakout candle
Now, why do I prefer BTST over swing trades? The primary reason is that I have observed that 90% of the stocks give most of the movement in just 1-2 days and the rest of the time they either consolidate or fall
Cup & Handle Breakout in TANLA
BUY TODAY SELL TOMORROW for 5%

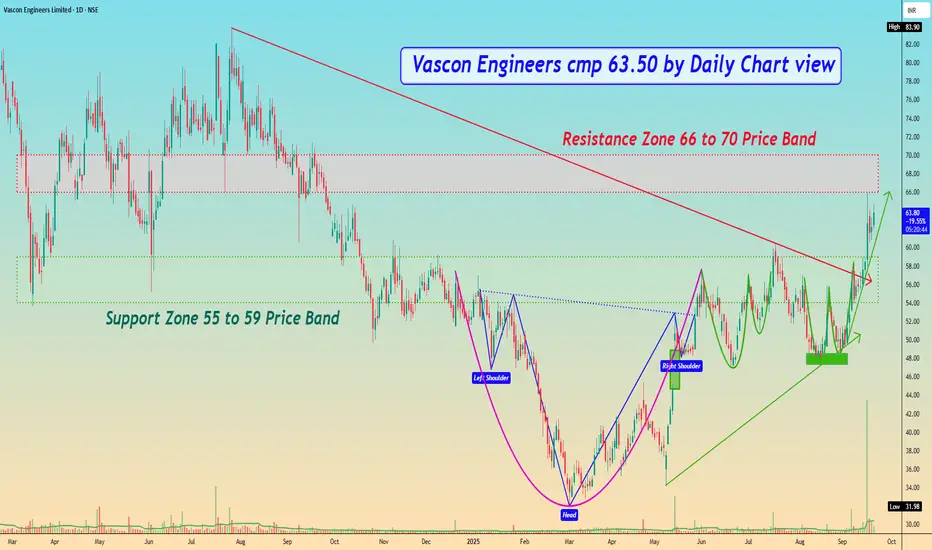
Vascon Engineers cmp 63.50 by Daily Chart viewVascon Engineers cmp 63.50 by Daily Chart view
- Support Zone 55 to 59 Price Band
- Resistance Zone 66 to 70 Price Band
- Heavy Volumes surge based breakout above Support Zone earlier Resistance Zone
- Multiple Bullish Patterns made around Support Zone with Head & Shoulders, Rounding Bottoms, Cup and Handle
BUY TODAY SELL TOMORROW for 5%DON’T HAVE TIME TO MANAGE YOUR TRADES?
- Take BTST trades at 3:25 pm every day
- Try to exit by taking 4-7% profit of each trade
- SL can also be maintained as closing below the low of the breakout candle
Now, why do I prefer BTST over swing trades? The primary reason is that I have observed that 90% of the stocks give most of the movement in just 1-2 days and the rest of the time they either consolidate or fall
Cup and Handle Breakout in BAJAJCON
BUY TODAY SELL TOMORROW for 5%

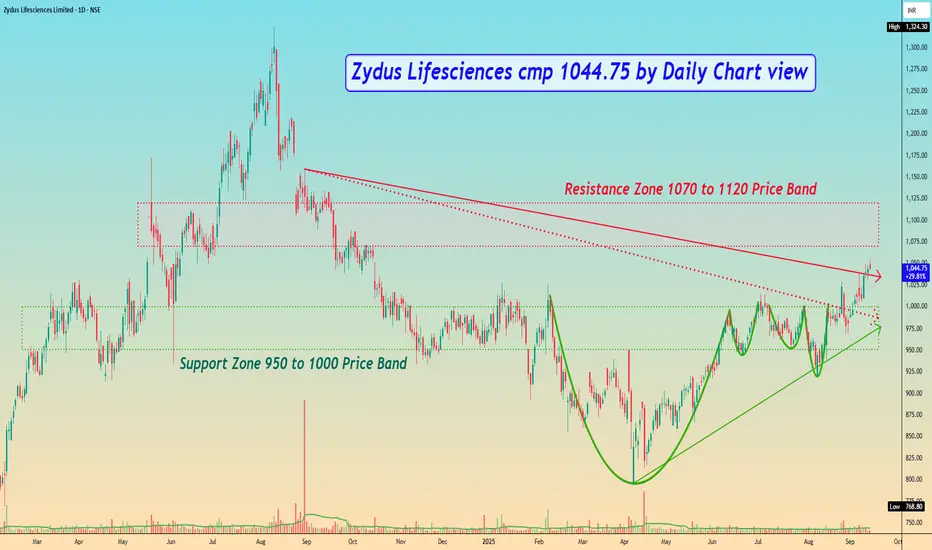
Zydus Lifesciences cmp 1044.75 by Daily Chart viewZydus Lifesciences cmp 1044.75 by Daily Chart view
- Support Zone 950 to 1000 Price Band
- Resistance Zone 1070 to 1120 Price Band
- Falling Resistance Trendline Breakout seems sustained
- Bullish Cup and Handle done by Support Zone neckline
- Bullish Rounding Bottoms made by Support Zone neckline
- Volumes seem getting in close sync with average traded quantity
BUY TODAY SELL TOMORROW for 5%DON’T HAVE TIME TO MANAGE YOUR TRADES?
- Take BTST trades at 3:25 pm every day
- Try to exit by taking 4-7% profit of each trade
- SL can also be maintained as closing below the low of the breakout candle
Now, why do I prefer BTST over swing trades? The primary reason is that I have observed that 90% of the stocks give most of the movement in just 1-2 days and the rest of the time they either consolidate or fall
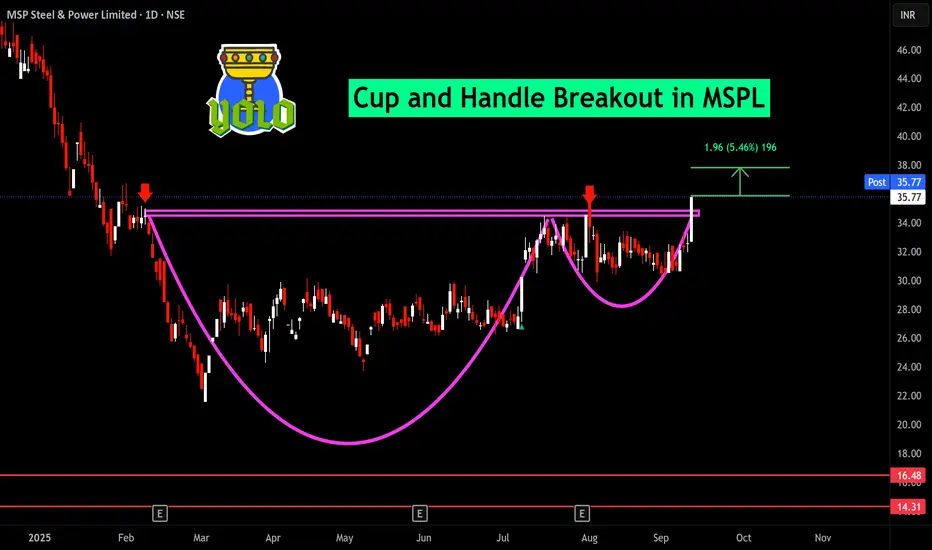
Cup and Handle Breakout in MSPL
BUY TODAY SELL TOMORROW for 5%