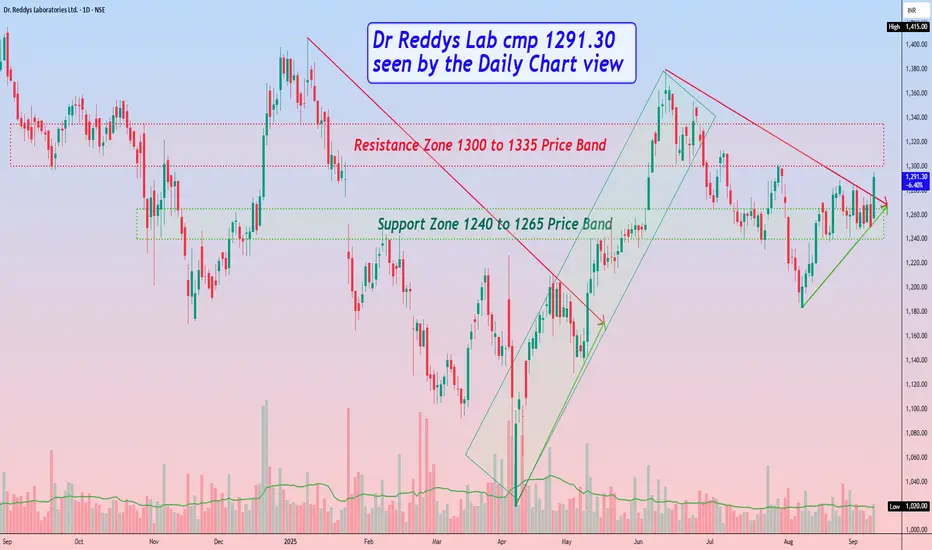
Dr Reddys Lab cmp 1291.30 by Daily Chart viewDr Reddys Lab cmp 1291.30 by Daily Chart view
- Support Zone 1240 to 1265 Price Band
- Resistance Zone 1300 to 1335 Price Band
- Breakout from Falling Resistance Trendline
- Bullish Rising Price Channel with intermittent highs and lows
- Recent history repeating by Breakout from Falling Resistance Trendline
- *Will we see a repeat Bullish Rising Price Channel with intermittent highs and lows*
Cupandhandlepattern
UJJIVANSFB long IdeaUJJIVANSFB looks good in a range between 50 and 200ema. Today It took 50 ema as resistance. Good above 50ema.
Stoploss is given. Targets are also given. Weekly chart is shown in image for higher trend which shows cup and handle is forming.
NOTE : Risk management is Important. No idea about Fundamentals. Just Technical View.

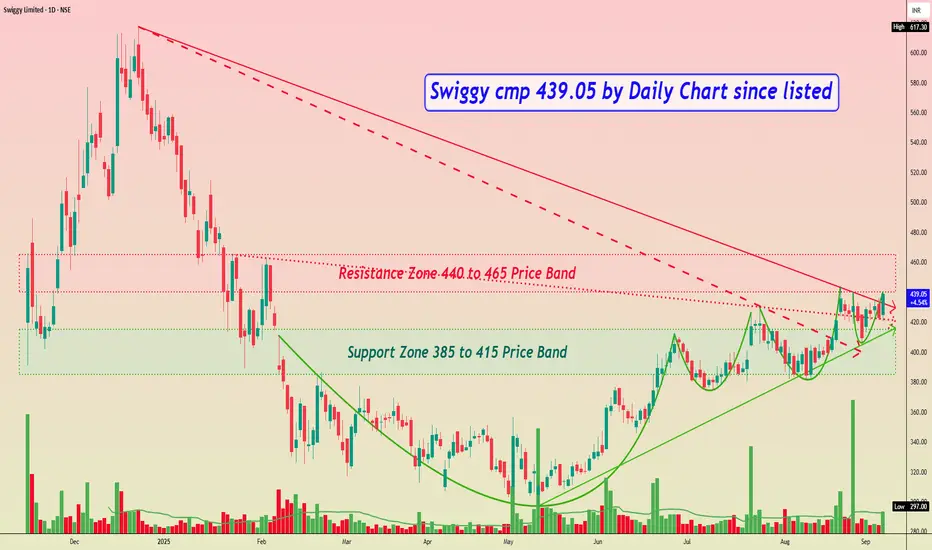
Swiggy cmp 439.05 by Daily Chart since listedSwiggy cmp 439.05 by Daily Chart since listed
- Support Zone 385 to 415 Price Band
- Resistance Zone 440 to 465 Price Band
- Rising Support Trendline well respected by Price momentum
- Bullish Cup and Handle followed by small Rounding Bottoms or a closely considerate VCP pattern
- Falling Resistance Trendline Breakout attempted with older Resistance Trendlines Breakout well sustained
- Volumes are spiking heavily at intermittent intervals and staying in close sync with the average traded quantity
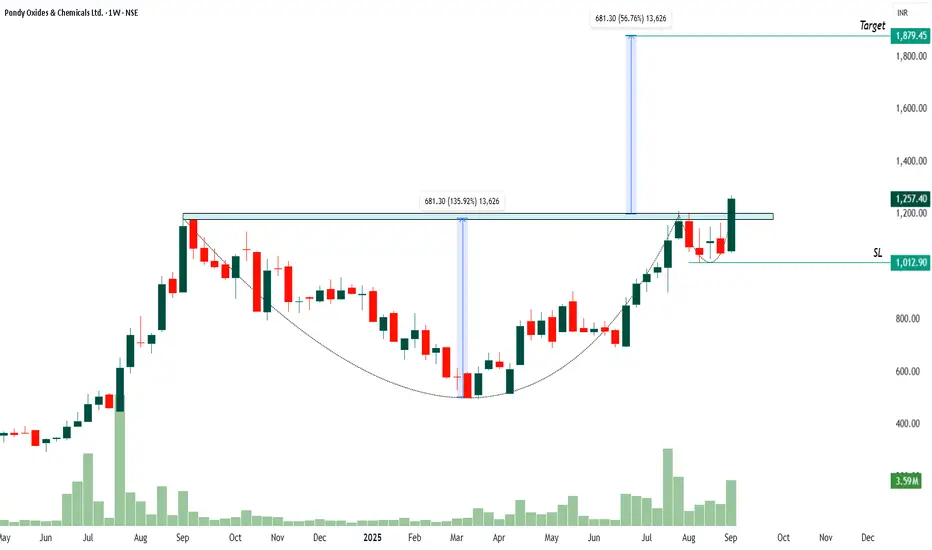
POCL - Cup and Handle - LongThe price has formed a classic “cup and handle” pattern, breaking above the resistance zone near ₹1,050–₹1,200, which previously acted as a ceiling for over a year. This breakout is confirmed by strong volume, indicating robust buying interest.
The level of ₹1,012.90 is marked as support and potential stop loss (SL). A close below this level would invalidate the breakout, making it a logical point for risk management.
Based on the height of the cup and handle pattern (approx. ₹680 from base to breakout), the projected target is around ₹1,879.45, suggesting a potential 50%+ upside from the current breakout level.
Notice the rising volume bars during the breakout, which give confidence that this move is backed by real market strength, not just price manipulation.
Above ₹1,200, the setup favors long positions toward ₹1,870, following the classic chart breakout principles. Strict stop loss (SL) at ₹1,013 is advised to protect capital in case the breakout fails.
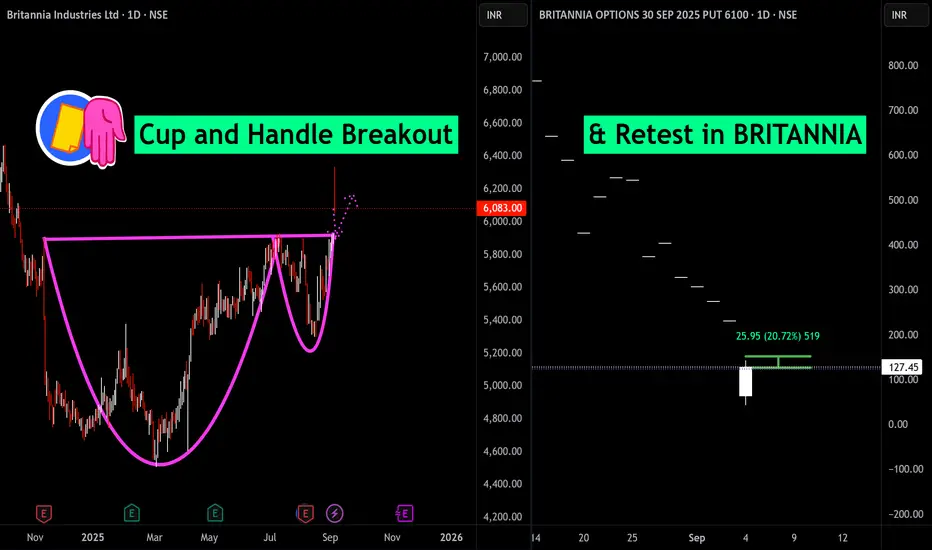
Cup and Handle Breakout & Retest in BRITANNIABritannia Industries has delivered a textbook Cup and Handle breakout on its daily chart, signaling renewed bullish momentum and the potential for higher highs ahead. After months of base-building, the stock surged above the key resistance level near ₹6,083, confirming the breakout with strong volume and a sharp price spike. This technical pattern often foreshadows continued upward movement, as buyers regain control following consolidation.
On the right, the Britannia 6100 September PUT option chart highlights a significant retest, with the PUT price dropping over 44% today, indicating strong bullish sentiment in the underlying stock. The sharp drop in the PUT’s value reinforces the breakout’s validity, since a falling PUT price typically aligns with rising equity prices.
Overall, Britannia’s decisive close above resistance and the synchronized retreat in bearish option premiums underscore an emerging uptrend. Traders may watch for continuation above ₹6,083 while managing risk near the breakout level.
BUY TODAY SELL TOMORROW for 5%DON’T HAVE TIME TO MANAGE YOUR TRADES?
- Take BTST trades at 3:25 pm every day
- Try to exit by taking 4-7% profit of each trade
- SL can also be maintained as closing below the low of the breakout candle
Now, why do I prefer BTST over swing trades? The primary reason is that I have observed that 90% of the stocks give most of the movement in just 1-2 days and the rest of the time they either consolidate or fall
Cup and Handle Breakout in JAICORPLTD
BUY TODAY SELL TOMORROW for 5%

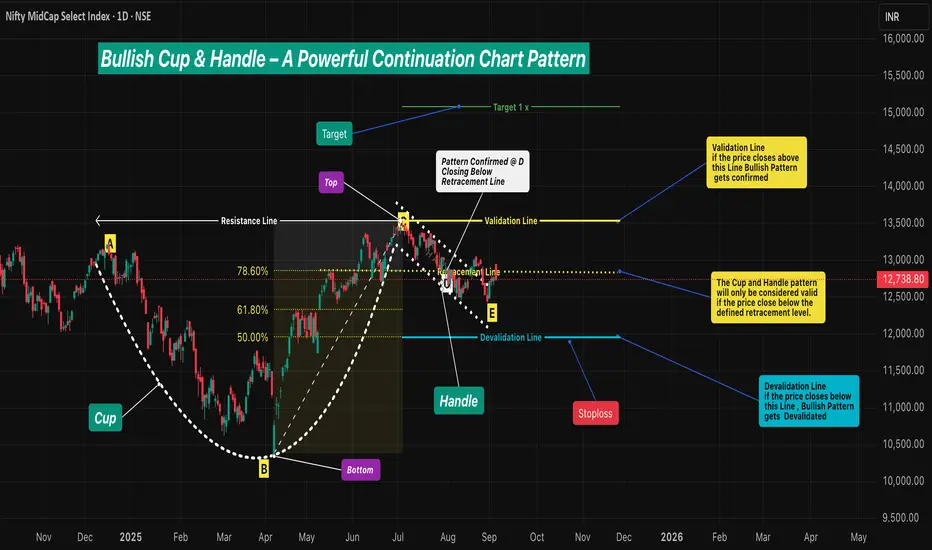
Bullish Cup & Handle – A Powerful Continuation Chart Pattern🔹 Intro / Overview
☕ The Cup and Handle is a 📈 bullish continuation pattern often studied in technical analysis.
⚔️ It forms when there is a fight between bulls 🐂 and bears 🐻 — the Cup develops as both remain strong.
📉 During the Handle, sellers 🛑 temporarily gain strength.
📈 But when price closes above the Validation Line, buyers regain control 💪 and bullish momentum dominates.
____________________________________________________________
📖 How to Identify
✅ Validation → The pattern is valid if price closes above the Validation Line.
❌ Devalidation → The pattern is invalid if price closes below the Devalidation Line(before Validation).
📉 Retracement Rule →The pattern is only confirmed if the price closes below the Retracement Line during the Handle formation.
This ensures a proper pullback forms before breakout .
____________________________________________________________
📖 Key Points of Pattern
✅ A valid Cup requires the retracement condition — confirmation occurs only if price closes below the Retracement Line .
⚖️ Balanced Highs → Point A (left peak) and Point C (right peak) should be relatively close in price, ensuring a proper Cup shape 🍵.
🔒 The Handle must not break the structural integrity of the Cup.(No Close Below Devalidation Lines)
____________________________________________________________
🎯 Trading Plan (Educational Only)
📌 Entry → Considered only after confirmation when price closes above the Validation Line.
🛡️ Stop-Loss (SL) → After validation, the Devalidation Line may act as an SL.
🎯 Target (TP) →
First Target → 1R (equal to the risk defined by Entry–SL distance).
Remaining Lots → Trail using ATR, Fibonacci levels, Box Trailing, or structure-based stops.
____________________________________________________________
📊 Chart Explanation
🍵 The Cup forms with a rounded base Point B and two balanced tops: Point A (left peak) & Point C (right peak) - The marginal price difference should be small to ensure a reliable Cup.
📈 The Retracement Line ( Point D ) confirms the pattern only if price closes below the Fibonacci Level of 78.60% and above the 50.00% .
📉 The Handle develops as price pulls back, with Point E marking the Handle low. and Good Handle of Cup is Formed (this low should not go below 50.00% Level )
📏 The Fibonacci retracement levels are drawn from Point B (Cup base) to Point C (right peak). These levels provide a reference framework to observe Retracement (minimum 78.60%) , Validation (100.00%) , and Devalidation (50.00%) areas for educational study of the structure.
____________________________________________________________
👀 Observations
✨ Works best after a strong uptrend 🚀 or at major support–resistance zones 🧱.
⚖️ A balanced Cup (Top Right ≈ Top Left) improves reliability.
📏 Handle Formation
The Handle should be shorter than the Cup depth — and should also be longer than the required minimum depth for proper structure.
If the Handle is too deep, it weakens the setup — and also if it is too short, the formation loses reliability.
____________________________________________________________
❗ Why It Matters
🔍 Shows the market battle between buyers and sellers.
💪 Highlights how buyers regain dominance after retracement validation.
⚖️ Balanced structure + strict rules = better filtering of weak setups.
📝 Provides clarity on entry, SL, and TP with a structured framework.
____________________________________________________________
🎯 Conclusion
The Cup and Handle pattern, when validated through Fibonacci retracement rules 📉, balanced highs ⚖️, and proper Handle structure 🔒, offers a disciplined framework for studying bullish continuation setups.
🔥 Patterns don’t predict. Rules protect.
____________________________________________________________
⚠️ Disclaimer
📘 For educational purposes only.
🙅 Not SEBI registered.
❌ Not a buy/sell recommendation.
🧠 Purely a learning resource.
📊 Not Financial Advice.
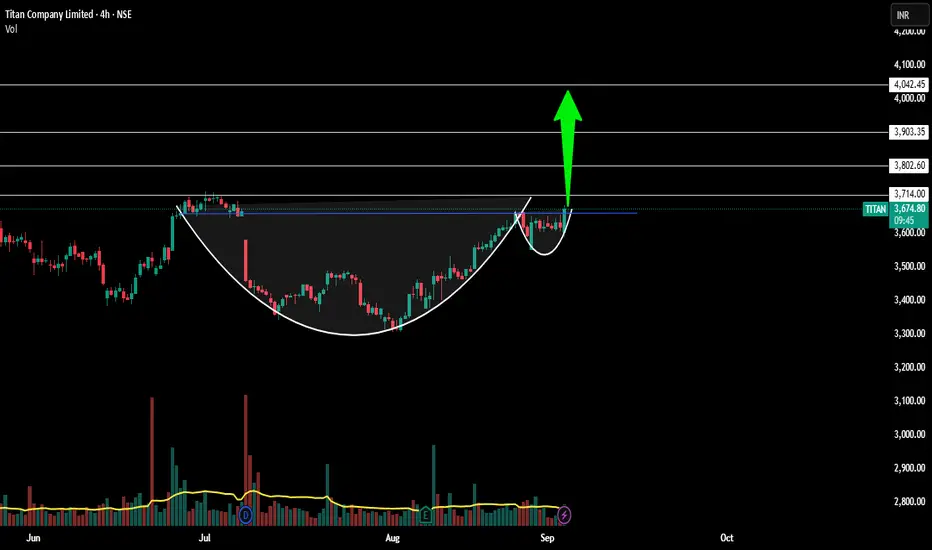
Titan looking good for a 10% upmove to All time high??!!Just a simple Cup and handle pattern...depth of the cup to be the target....
10% from now would be the target level.
Immediate resistance 3726.50...needs to break it!!!!
Looking good in monthly time frame too...with 3 white soldiers candles following a consolidation ....we can expect a good rally if wider markets don't make a panic down move ahead!!!
just my view...not a tip nor advice!!!
Thank you!!!
Gabriel India Ltd | Textbook Cup & Handle Breakout | Swing TradeGabriel India has formed a classic Cup & Handle pattern on the daily timeframe and given a decisive breakout above ₹1200 with strong volumes.
This indicates institutional accumulation and signals the start of a potential bullish leg.
Technical Analysis
Pattern: Cup & Handle → bullish continuation
Breakout Zone: ₹1200–1240 (now acting as strong support)
Current Price: ₹1265 (close as of 02 Sep 2025)
Volume: Noticeable spike, validating breakout strength
EMA Setup: Price trending above 20EMA (₹1178) & 50EMA (₹1123) → trend intact
Fundamental Key Area
Sector: Auto Ancillary (OEM supplier – suspension systems)
Market Cap: ~₹18,200 Cr (Mid-cap)
P/E: ~73 → premium valuation, market pricing in growth
Recent EPS: ₹4.3 (Jun-25) → steady growth
Sales Growth: +22% YoY (Jun-25) → consistent performance
Operating Margin: ~8% → stable margins for auto sector
Trade Plan
Entry Zone: ₹1240–1265 (CMP or on dips)
Stop-Loss: ₹1180 (below handle support & 20EMA)
Targets:-
T1: ₹1300 (Partial booking) (expected timeline 1-2 weeks)
T2: ₹1350 (Extended move) (expected timeline 2-3 weeks)
RR ≈ 1:1.8 → Favourable setup
Note: This analysis is shared purely for educational and informational purposes based on chart patterns and publicly available data. It should not be considered as investment advice. Please do your own research or consult a financial advisor before making trading decisions.
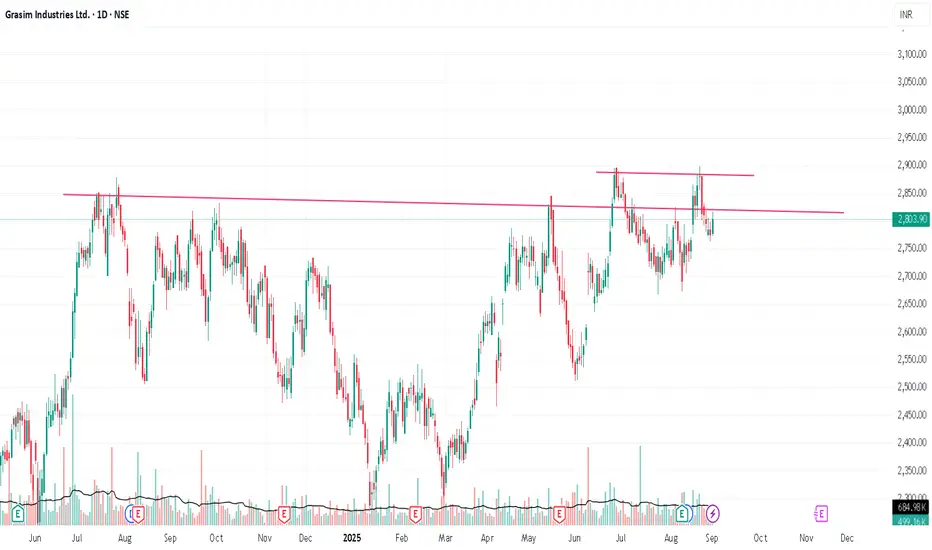
Flexing at All Time HighGrasim broke a cup & handle pattern and came down, again trying to break another trendline at top of the cup & handle pattern. if it breaks and sustain above the latest breakout with good volume, it'll move up for sure.
***This is only for educational purposes***
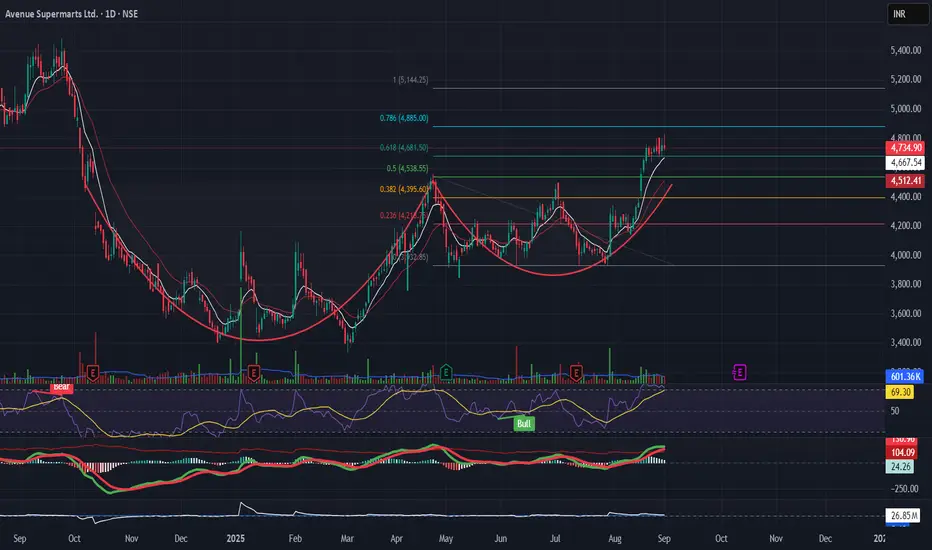
D’Mart (Consumption) Possible Throwback to breakout levelD’Mart (Consumption)
Chart Context:
D’Mart after its breakout near ₹4524 with EMAs aligned bullishly d'Mart Start Weakening and possible throwback to the breakout level. RSI is above 69, indicating strength. Fib levels highlight potential upside to ₹4,885 → ₹5,145.
Post Caption:
"D’Mart sustaining above ₹4,524 breakout zone.
Upside levels: ₹4,885 → ₹5,145.
Stop near ₹4,540.
🛒 Consumption theme continues to show leadership."
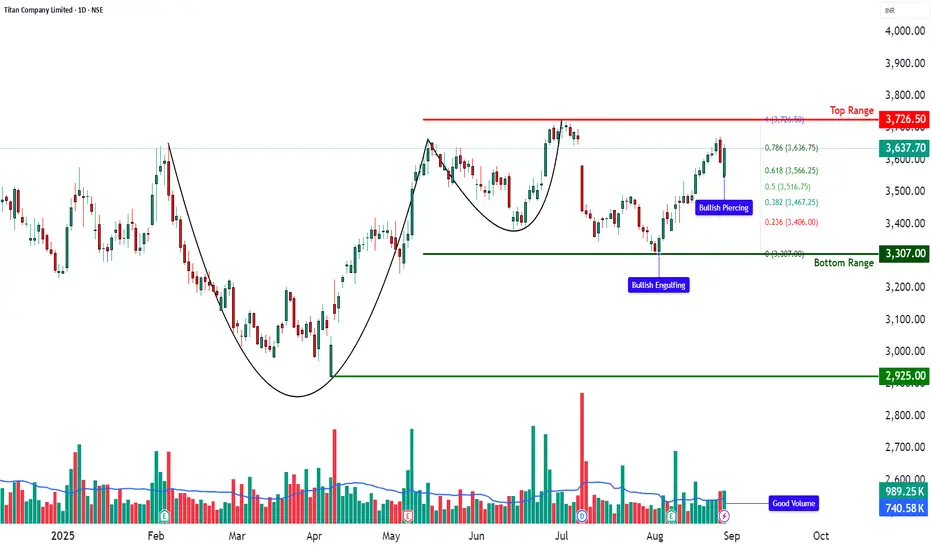
TITAN – Cup & Handle Breakout Retest📊 TITAN – Technical & Fundamental Educational Snapshot
Ticker: NSE: TITAN | Sector: Consumer – Lifestyle & Jewellery
CMP: ₹3,637.70
Rating: ⭐⭐⭐⭐ (Bullish Setup – For Educational Purposes Only)
Pattern Observed: ☕📈 Cup & Handle Breakout Retest
📊 Technical Observations
Titan Company Ltd. (CMP: ₹3,637.7) is presently exhibiting a Cup & Handle formation, with the price recently retesting the handle zone around ₹3,550–₹3,600 and showing signs of strength supported by healthy volumes. On the technical front, important resistance levels are noted around ₹3,675, ₹3,712, and ₹3,773, while support levels lie near ₹3,576, ₹3,515, and ₹3,477. Key indicators currently reflect positive momentum, with RSI around 65, MACD showing bullish signals on multiple timeframes, and CCI at 92, while the Stochastic indicator is in the higher zone (88–94), suggesting overbought but trending conditions. Volumes stood at ~989K, higher than the 20-day average of ~740K, indicating increased participation. Price action is also holding above VWAP, with Bollinger Band dynamics hinting at the possibility of trend continuation.
📰 Fundamental & News Flow
In its Q1 FY26 results, Titan Company Ltd. reported around 11% year-on-year revenue growth, primarily supported by sustained jewellery demand, although margins were modestly affected due to gold price volatility. The company continues to witness healthy traction in its Tanishq jewellery and Titan Eye+ businesses, alongside a recovery trend in watches and wearables. Titan has also been pursuing aggressive retail expansion, and the upcoming festive season is expected to support consumer demand further. From a structural perspective, the company is often highlighted for its premium brand positioning, robust balance sheet, and long-term jewellery demand drivers, which are considered key strengths in its sector.
📊 STWP Trade Analysis (Educational Purpose Only):
The recent price action indicates a Bullish Engulfing pattern followed by a Bullish Piercing formation, which are generally studied as signs of positive sentiment when supported by volumes. After the retest, a reference level around ₹3,726.50 may be noted, while the Bullish Piercing structure also highlights an observation zone near ₹3,650.90, with further upward reference levels around ₹3,752 and ₹3,854, and a protective support reference near ₹3,549. From a Fibonacci retracement perspective, a pullback level is visible near ₹3,566, with an invalidation reference around ₹3,516.
BUY TODAY SELL TOMORROW for 5%DON’T HAVE TIME TO MANAGE YOUR TRADES?
- Take BTST trades at 3:25 pm every day
- Try to exit by taking 4-7% profit of each trade
- SL can also be maintained as closing below the low of the breakout candle
Now, why do I prefer BTST over swing trades? The primary reason is that I have observed that 90% of the stocks give most of the movement in just 1-2 days and the rest of the time they either consolidate or fall
Cup & Handle Breakout in VOEPL
BUY TODAY SELL TOMORROW for 5%

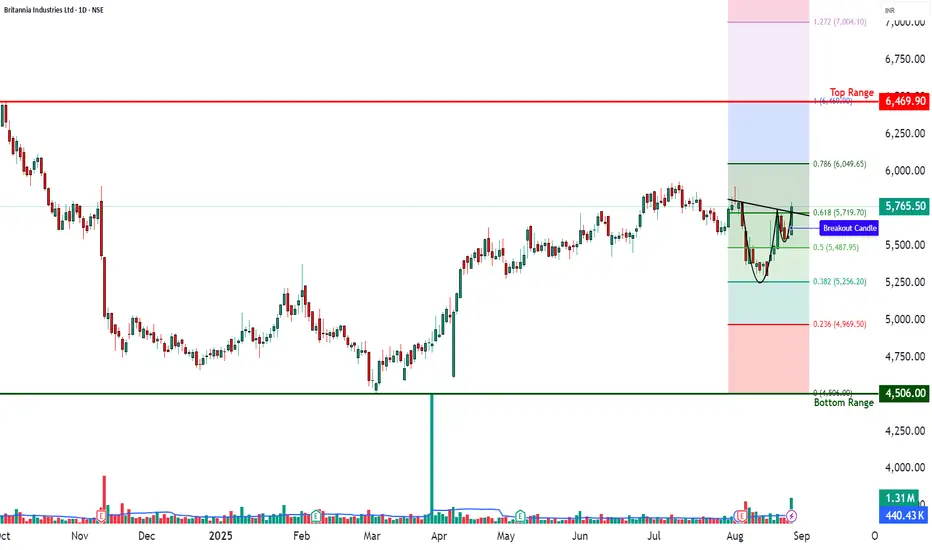
BRITANNIA - Cup & Handle Breakout Attempt📊 BRITANNIA – Technical & Fundamental Educational Snapshot
Ticker: NSE: BRITANNIA | Sector: FMCG – Packaged Foods & Biscuits
CMP: ₹5,765.50
Rating: ⭐⭐⭐⭐ (Bullish Setup – For Educational Purposes Only)
Pattern Observed: ☕📈 Cup & Handle Breakout Attempt
📊 Technical Observations
BRITANNIA (CMP: ₹5,765.5) is exhibiting a Cup & Handle breakout formation, confirmed by a strong bullish candle on heavy volumes. The stock has moved up from a recent bottom zone near ₹5,256–₹5,487 towards the neckline at ₹5,794, with key resistances placed at ₹5,848, ₹5,931, and ₹6,068, while supports are noted at ₹5,628, ₹5,491, and ₹5,408.
Technical indicators show RSI at 59 (breakout zone), a bullish MACD crossover, CCI at 76, and Stochastic at 94, highlighting strong upward momentum. The price action is supported by VWAP strength, and a Bollinger Band squeeze-off breakout, suggesting a possible trend continuation.
Volume surged to ~1.31M shares, significantly higher than the 20-day average of ~0.44M, indicating institutional participation. Based on the current momentum and technical structure, there is a strong possibility of breakout continuation; however, traders should carefully monitor the ₹5,628 and ₹5,518 levels as critical supports for risk management.
Britannia Industries has been in focus after analysts at PL Capital named it among their top stock picks, citing its strong positioning to benefit from India’s consumption revival. In its Q1 FY26 results, the company reported a consolidated net profit of ₹521 crore, up ~3% YoY, with revenues rising ~9% to ₹4,622 crore, though profitability fell short of street expectations due to higher input costs. Standalone performance was softer, with net profit down 0.8% YoY to ₹498 crore despite an 8.8% increase in revenue, reflecting margin pressure from raw material cost inflation. On the positive side, Britannia highlighted broad-based demand growth across both rural and urban markets and announced steps to boost the nutritional profile of its products by increasing whole grain content while reducing sugar and sodium, aligning with health-conscious consumer trends.
From a sentiment standpoint, the stock currently reflects a neutral to slightly positive bias. Bullish triggers include the ongoing consumption recovery, strong rural demand, analyst endorsements, product innovation, and sequential revenue growth. On the bearish side, rising input costs, weak standalone profitability, and rich valuations (P/E ~60) pose risks to near-term upside.
From an investment perspective, the outlook for Britannia remains mixed but constructive. On the bullish case, volume-led demand growth, health-focused innovation, and strong brand positioning could support further upside. On the bearish case, margin pressure and stretched valuations may limit near-term gains. In the short term (next few sessions), price action appears momentum-driven, supported by a bullish cup-and-handle breakout setup and strong institutional participation, making a continuation move possible in the next 1–2 days. Over the longer term (6–12 months), Britannia’s growth story remains intact provided cost pressures ease and the company sustains its demand momentum, aligning with PL Capital’s positive stance on the FMCG leader.
📊 STWP Trade Analysis – Under the STWP trade framework, one illustrative breakout scenario could involve a long entry near ₹5,794.50, with a protective stop at ₹5,518.40. In comparable past structures, price has tended to extend towards zones such as ₹5,848–₹5,880 (approx. 1:1 risk–reward), ₹5,931 (around 1:1.5 R:R), and ₹6,049–₹6,071 (approx. 1:2 R:R). If momentum accelerates, a stretch target may open towards ₹6,068 → ₹6,347.
An alternative, more conservative illustration could be a pullback entry in the ₹5,545–₹5,525 zone, with a tight invalidation stop at ₹5,518. A quick reaction pullback may also occur around the Fibonacci level of ₹5,719.70, before attempting a continuation higher. Upside zones remain aligned with the same resistance ladder (₹5,848–₹5,880 → ₹5,931 → ₹6,049–₹6,071 → ₹6,347).
Possible Demand Zone (Illustrative): ₹5,608.50 – ₹5,545
Stop Loss (tight): ₹5,537.90
Approximate Risk: ~₹70 per lot
⚠️ Risk Reminder:
Price momentum is strong but Stochastic readings are elevated, which may lead to volatility or shakeouts. Traders should trail stops actively (e.g., move SL to breakeven after T1, and under higher lows after T2). Market volatility, raw material cost changes, and broader FMCG index sentiment can influence outcomes. Past price behavior and backtests are illustrative only and do not guarantee future performance.
⚠️ Disclaimer – Please Read Carefully
The information shared here is meant purely for learning and awareness. It is not a buy or sell recommendation and should not be taken as investment advice. I am not a SEBI-registered investment advisor, and all views expressed are based on personal study, chart patterns, and publicly available market data.
Trading — whether in stocks or options — carries risk. Markets can move unexpectedly, and losses can sometimes exceed the money you have invested. Past performance or past setups do not guarantee future results.
If you are a beginner, treat this as a guide to understand how the market works — practice on paper trades before risking real money. If you are experienced, always assess your own risk, position sizing, and strategy suitability before entering trades.
Consult a SEBI-registered financial advisor before making any real trading decision. By engaging with this content, you acknowledge full responsibility for your trades and investments.
💬 Found this useful?
🔼 Give this post a Boost to help more traders discover clean, structured learning.
✍️ Drop your thoughts, questions, or setups in the comments — let’s grow together!
🔁 Share with fellow traders and beginners to spread awareness.
👉 “If you liked this breakdown, follow for more clean, structured setups with discipline at the core.”
🚀 Stay Calm. Stay Clean. Trade With Patience.
Trade Smart | Learn Zones | Be Self-Reliant 📊
HWC - LongThis is a weekly candlestick chart of Hancock Whitney Corporation (HWC) listed on NASDAQ. The chart is showing a Cup and Handle pattern, which is a bullish continuation pattern often seen before an upward breakout. Let’s break it down step by step:
🔎 Pattern Analysis
Cup Formation (Left Side to April 2025)
The chart formed a large round bottom (cup), which reflects a gradual decline followed by a steady recovery. This signals accumulation by smart money (big investors quietly buying at lower levels).
Handle Formation (June–August 2025)
After the cup, prices consolidated slightly downward and sideways, forming the handle.
This is the last stage before a breakout, essentially a "pause" before buyers take full control.
Breakout Zone (63 level): The neckline (or breakout level) is around $63. Price has just broken above this neckline, confirming the bullish pattern.
🎯 Price Target Projection
The height of the cup is around $18.43 (41.73%). Adding this to the breakout point ($63) gives a target of around $81. This is marked on the chart as the Target zone.
📉 Stop Loss (Risk Management)
The suggested Stop Loss (SL) is set at $56.94. If prices fall below this, the bullish setup would be invalid, so risk needs to be controlled.
🔔 Key Takeaways for Members
✅ A bullish Cup and Handle breakout is visible.
✅ Breakout confirmed above $63.
🎯 Upside Target: $81
📉 Stop Loss: $56.94
⏳ This is a weekly timeframe, so it may take weeks/months for the target to be achieved. Patience is key.
⚠️ Disclaimer: This explanation is only for educational purposes, not financial advice. Always do your own research and manage risk before making trading decisions.

Cup and Handle Breakout in NYKAAA potential Cup and Handle breakout is forming in Nykaa (FSN E Commerce Ventures) on the daily chart. Price action shows a classical rounded base followed by handle consolidation, with prices breaking above resistance at ₹229.50. The breakout target is approximately ₹4.70 higher (about 2% upside), supporting bullish momentum. Additionally, the September 230 CALL option has surged 13.89%, reinforcing strong follow-through and trader interest on the breakout. This setup fits textbook continuation patterns and suggests a positive short-term outlook for Nykaa as long as prices hold above the breakout level.
Trade Context for Posting
Pattern: Cup and Handle breakout.
Underlying: FSN E Commerce Ventures (Nykaa), NSE daily chart.
Breakout Level: ₹229.50.
Target Upside: ₹4.70 (approx. 2% from breakout), option up 13.89%.
Validation: Bullish price action, volume expansion, supportive option activity.
Trade Plan: Consider long positions above ₹229.50, with stop-loss below the handle low. Watch for sustained momentum and volume, aiming for the indicated breakout objective.
This trade is based on established technical analysis principles, showing strong risk-reward from current levels, and is backed by sharp movement in related call options.

Mphasis cmp 2917.70 by Daily Chart viewMphasis cmp 2917.70 by Daily Chart view
- Support Zone 2785 to 2845 Price Band
- Resistance Zone 2980 to 3045 Price Band
- Falling Resistance Trendline Breakout attempted
- Rising Support Trendline well respected by up-trending price
- Bullish Cup & Handle pattern done near the Resistance Zone neckline

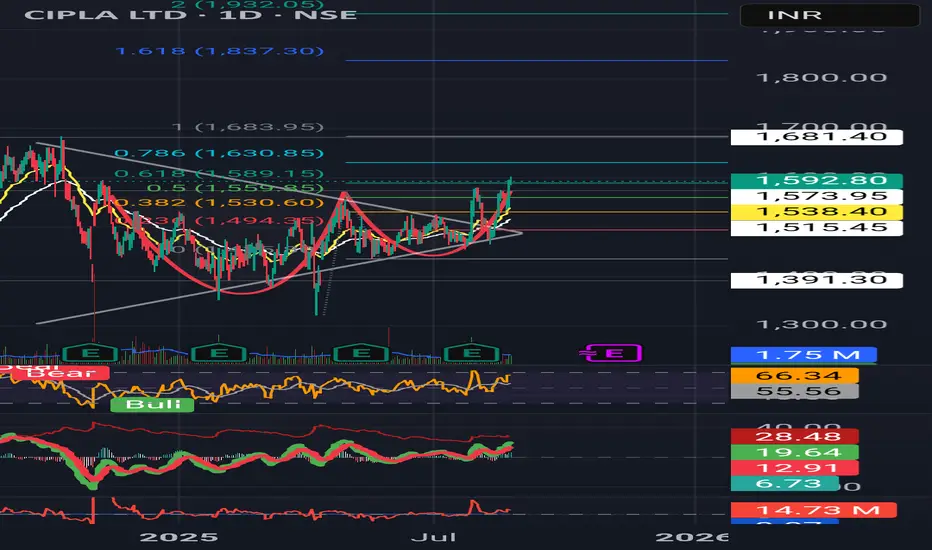
Breakout from cup-and-handle pattern
✅ Strong EMA alignment (20 > 50).
✅ RSI > 60 with bullish slope.
🚩 Needs follow-through above ₹1600 for sustained rally.
🎯 Target zones: ~₹1630, ₹1683, ₹1837 (Fib extensions).
🛑 Stop-loss: ₹1571 (tight ATR-based).
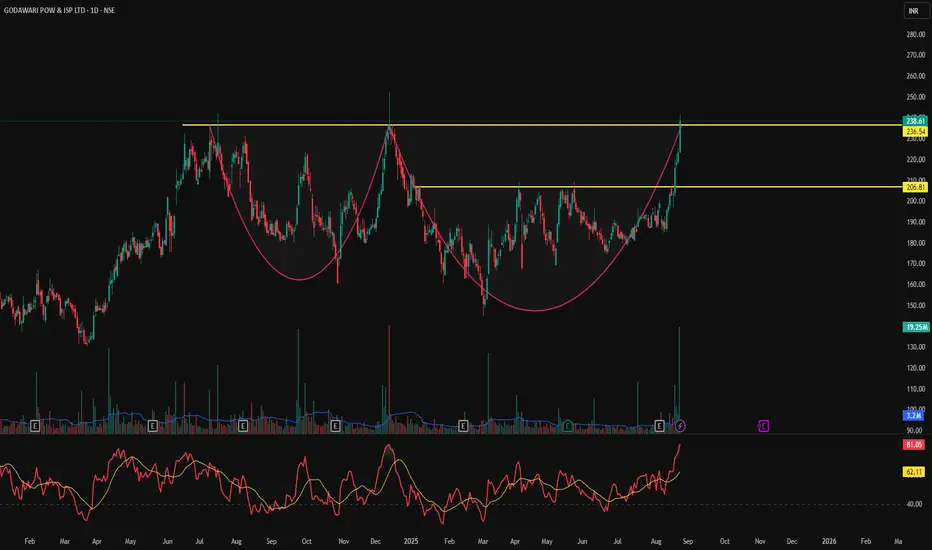
GPIL - Cup & Handle Breakout | Daily Chart📊 GPIL – Cup & Handle Breakout with Explosive Volume | RSI > 80
📅 Chart Date: August 24, 2025
📍 CMP: ₹238.61 (+6.91%)
📈 Symbol: NSE:GPIL | 1D Timeframe
🔍 Technical Analysis
☕ Cup & Handle Breakout
A multi-month Cup & Handle pattern has been completed.
Price gave a strong breakout above the neckline zone ₹206.81.
Next supply zone is around ₹236–₹240, which is being tested.
💥 Volume Confirmation
Relative Volume (RVol): 842% 🔥
Today’s volume 19.25M vs avg 3.2M — heavy institutional buying.
📈 RSI (14, close): 81.05
Stock is in the overbought zone, indicating strong momentum.
Short-term pullback possible, but trend remains bullish above breakout.
📌 Key Levels
Breakout Zone (Support): ₹206.81
Immediate Resistance: ₹236–₹240
Next Target Levels: ₹260 / ₹280
Stoploss for Swing Traders: ₹200
Entry on Retest: ₹210–₹215
Stoploss: ₹200
Targets: ₹260 / ₹280
⚠️ Disclaimer: This is an educational chart setup and not trading advice. Please conduct your own research and risk management.
📣 Follow @PriceAction_Pulse for more such clean breakouts and chart pattern analysis!
🔁 Drop a comment if GPIL is on your radar for the next breakout rally 📈
ABCAPITAL(cup& handle)My analysis is large capital company with good returns.
Key piont is Make cup and handle pattern look into chart how was possible to Target reach . Road map create for our target is 230, 300 but .. respect to SL .. LIKE ME .
Company has delivered good profit growth of 47.2% CAGR over last 5 years
Shareholding pattern (%)
As On Dec-23
Promoter 69.0 %
DII 8.4%
FII 10.6 %
Others 12.0 %
for MORE check in my TradingView ID
If You LIKE👌👌 MY Idea ......Boost.🔥🔥🔥.. its.
"Disclosure : I am not Sebi-registered." This channel is for only educational purpose. Any profit/loss, I am not responsible.
Before taking any trade on our charts / calls, please consult your financial advisors. Thanks🙏

Zydus Lifesciences cmp 989.45 by Daily Chart viewZydus Lifesciences cmp 989.45 by Daily Chart view
- Support Zone 946 to 966 Price Band
- Resistance Zone 996 to 1016 Price Band
- Falling Resistance Trendline and Zone Breakout attempted
- Volumes seem in decent sync with the average traded quantity
- Multiple Bullish Rounding Bottoms with Cup & Handle by Resistance Zone neckline
- Resistance Zone acting as a strong hurdle to crossover and breakout basis past reversals

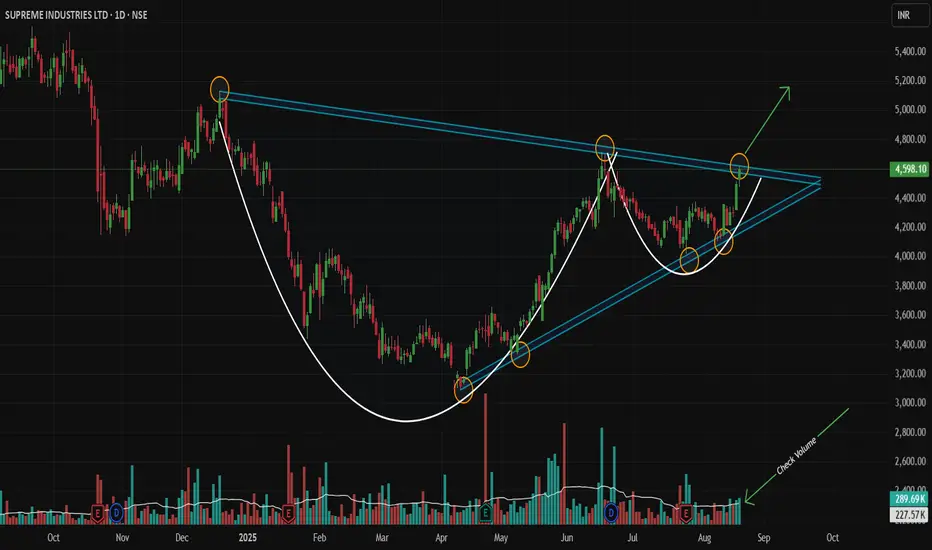
Nested Bullish Patterns Signal Major Breakout!Script: NSE:SUPREMEIND | Timeframe: Daily | Analysis Type: Technical (Pure Price Action) | Patterns: Symmetrical Triangle + Cup & Handle
Idea Summary 💡
A powerful, nested pattern setup is concluding on the daily chart! A large Symmetrical Triangle contains a secondary Cup and Handle (Bullish) pattern. This rare confluence signals strong accumulation and suggests an imminent, powerful upside breakout is likely!
Chart Pattern Logic 🔍
Primary Pattern (Symmetrical Triangle): Characterized by descending resistance (highs: Dec-18-2024, Jun-17-2025) and ascending support (lows: Apr-9-2025, May-9-2025, Jul-24-2025).
Secondary Pattern (Cup & Handle): Formed entirely within the triangle, adding a potent layer of bullish confirmation.
Confluence: This pattern-within-a-pattern setup significantly amplifies the potential for a strong upward resolution.
Trade Thesis 📈
Price is coiling at the triangle's apex under immense pressure. A decisive break above the upper trendline could ignite the next major bullish impulse phase.
Trade Setup ⚡
Direction: LONG 🟢
Entry Trigger: WAIT for a strong Marubozu green candle 🕯️ to close above the triangle's trendline on high volume (min. 1.5x average).
Stop Loss: Below the low of the breakout candle. 🛑
Profit Targets: 4700 🎯 | 4800 🎯 | 5125 🎯
Long-Term Target: 6000+ (Extended Target Based on Pattern Confluence & Momentum) 🚀
Risk Management: Trail stops aggressively after Target 1.
Got another stock you want me to break down? 📊
Drop the ticker in the comments below! If you found this idea useful, like and follow for more pure price action analysis.
Disclaimer: This post/information is solely for educational purposes and should not be construed as a recommendation or financial advice. Trading carries a risk of loss. Please conduct your own research or consult a financial advisor before making any investment decisions. The author and TradingView are not liable for any financial losses incurred based on this content.
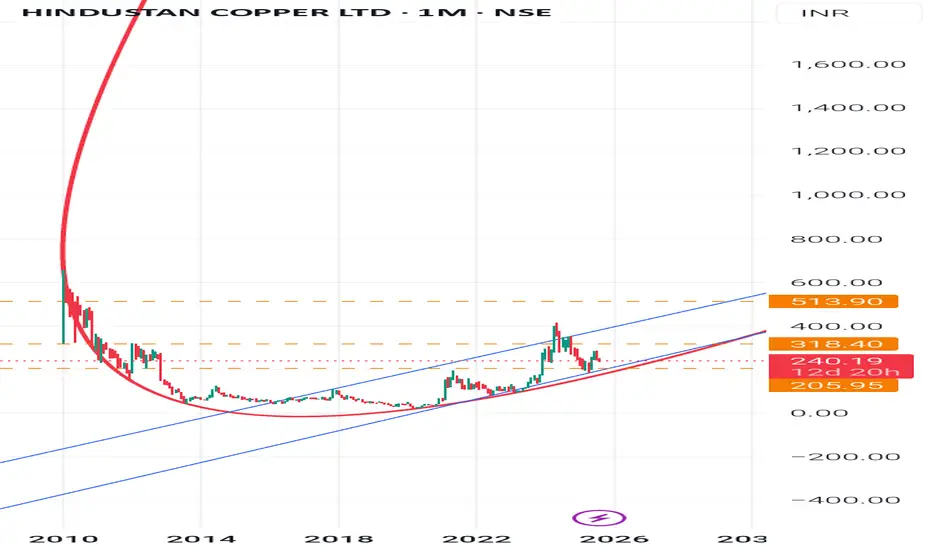
Hindustan copper Trend AnalysisHindustan Copper (HINDCOPPER) - Monthly Chart : Trend Analysis-
Long-term Trend: Strong uptrend since 2020, visible with higher highs and higher lows.
Current Position: After a sharp rally to 414, the stock corrected and is now consolidating around 280.
200-Month MA (red curve): Acts as a strong long-term support trendline.
Chart Pattern👉
Cup & Handle Formation: The stock formed a long cup (2010-2020) and has broken out. Now it is forming a handle/consolidation phase.
Rising Channel: Price is moving inside an upward channel (blue lines).
Support Levels
1. 240 - Strong immediate support (monthly close basis).
2. 205 - Next strong support (channel + trendline confluence).
3. 165- Major base (only if bigger correction comes).
📈 Resistance Levels
1. 318- First hurdle (recent swing high).
2. 414- Previous top, very important resistance.
3. 513- Long-term target zone shown on your chart.
🚀 Next Big Leap🎯
If stock sustains above 318, momentum buying can take it back toward 414.
A monthly close above 414 will confirm a fresh breakout, next big target opens to 513-550 zone.
In the longer run (2-3 years), if 513 is crossed and sustained, stock could head towards 750+.
Risk Note:
Below 240 on monthly close- weakness.
Below 205- trend reversal risk (long-term investors must watch this level closely).
Summary:
Hindustan Copper is in a long-term bullish structure. It is currently consolidating in a handle phase between 240-318. A breakout above 318 can lead to a retest of 414, and then a big move towards 513+. Long-term investors should stay put as long as 205 support holds.
Disclaimer-
This analysis is only for educational and learning purposes.
It is not an investment or trading advice.
Stock market investing is risky- please consult a SEBI-registered financial advisor before making any decisions.
#StockMarket #TechnicalAnalysis #PriceAction