Institutional Intraday option Trading🧠 What is Institutional Intraday Options Trading?
Institutional intraday options trading refers to short-term options strategies executed by large institutions with the intent to profit from price movements, volatility, and order flow within a single trading session.
Unlike positional or swing trading, intraday strategies demand high accuracy, precision, and speed, which institutions handle using advanced systems and huge capital.
🏢 Who Are the Institutions?
Institutions that dominate intraday options trading include:
Hedge Funds
Proprietary Trading Desks (Prop Desks)
Foreign Institutional Investors (FIIs)
Domestic Institutional Investors (DIIs)
Investment Banks
Market Makers
These players have access to deep capital, faster execution platforms, and exclusive market data.
🔄 Institutional Objectives in Intraday Options
Capture Short-Term Volatility
Using strategies like Straddles, Strangles, Iron Condors.
Targeting events like news, economic data releases, or earnings.
Liquidity Management
Institutions provide liquidity through market-making and benefit from spreads.
Risk Hedging
Intraday options are also used to hedge large cash or futures positions.
Arbitrage Opportunities
Spot-Future arbitrage
Volatility arbitrage
Calendar spread arbitrage
📈 Common Institutional Intraday Option Strategies
1. Delta Neutral Scalping
Strategy: Sell ATM straddle and keep delta hedged.
Objective: Earn from theta decay and re-hedging.
2. Gamma Scalping
Based on buying options and adjusting delta frequently as prices move.
Profitable during high intraday volatility.
3. Option Writing with IV Crush
Institutions short options during events like RBI policy, Budget, or results.
Profits from rapid drop in Implied Volatility after the event.
4. Directional Betting with Flow Analysis
Tracking aggressive option buying/selling in OTM/ATM strikes.
Directional trades using high-volume & OI shifts.
5. Statistical Arbitrage
Using quant models to exploit temporary mispricings.
🧩 Institutional Footprints on Option Charts
Retail traders can spot institutional footprints by:
Large ATM Straddle positions
IV divergence in option chain
Open Interest buildup without price movement (Smart money quietly entering)
Options being written at key support/resistance zones
Example:
If Bank Nifty is consolidating near a resistance and suddenly 2 lakh OI is built up in 50 point OTM Calls with low IV – this may be Call writing by institutions expecting price rejection.
⚠️ Risks and Control Measures Used by Institutions
Real-time Risk Monitoring Tools
Delta/Gamma/Vega Exposure Management
Limit on maximum intraday drawdown
AI-driven decision engines to avoid emotional trades
✅ How Can Retail Traders Learn from Institutions?
Follow Open Interest + Volume Patterns
Observe institutional behavior on expiry days
Study option flow at key market levels
Backtest Straddles/Strangles on high IV days
Use Option Greeks for proper understanding
Always trade with risk-defined strategies (no naked selling without hedge)
📌 Final Thoughts
Institutional Intraday Options Trading is not about gambling or just clicking buy/sell — it’s an advanced, mathematically balanced, and data-backed approach to generate consistent intraday alpha from the market. Institutions often move ahead of retail due to technology, access, discipline, and experience.
Retail traders can’t copy the scale but can adapt the logic:
Focus on analyzing institutional footprints
Learn to read the option chain like a map
Use data, not emotions
Currency

institutional Nifty-50 option tradingInstitutional Nifty-50 option trading refers to the strategic use of Nifty-50 options (CE & PE) by FIIs, DIIs, Hedge Funds, and Banks to hedge, speculate, or manage risk on large capital positions. Unlike retail, their trades are data-driven and volume-heavy.
Key Institutional Strategies:
Delta-Neutral Strategies – Like Long Straddles or Strangles, where institutions profit from volatility.
Covered Call / Protective Puts – To hedge large Nifty portfolios.
Bull/Bear Spreads – Deployed when directional conviction is strong but limited in risk appetite.
Option Writing – Writing options at OI resistance/support to generate premiums.
Calendar Spreads – Leveraging time decay while anticipating movement.
📈 How to Track Institutional Activity:
Option Chain Analysis: Spot high OI shifts with unusual volumes.
OI + Volume + IV: Use combined data to infer institutional positioning.
Change in PCR (Put Call Ratio): Signals sentiment shift at index levels.
FII-DII Daily Derivative Data: Published by NSE after market hours.
Strike-wise Open Interest Heatmaps: Help identify resistance/support zones built by institutions.

VRL LOGISTICS By KRS Charts19th March 2025 / 11:13 AM
Why VRLLOG?
1. Fundamentally, Good Stock Net profit is the proof further stock is at 45% Discount then its High and Net income is High compared to its price.
2. Technically, Stock has Completed its Correction Wave C with significant Shakeout before going for Breakout as we can see in above chart.
3. On Monthly and Weekly TFs VRLLOG is on its All-Time biggest Support.
4. Reversal is more convicted because 1st Shakeout was Huge for Buyers and 2nd There is potential for Inverted H&S is about to Formed with more upsides from here.
Targets are pinned in Charts with Stop Loss 1D closing Basis.

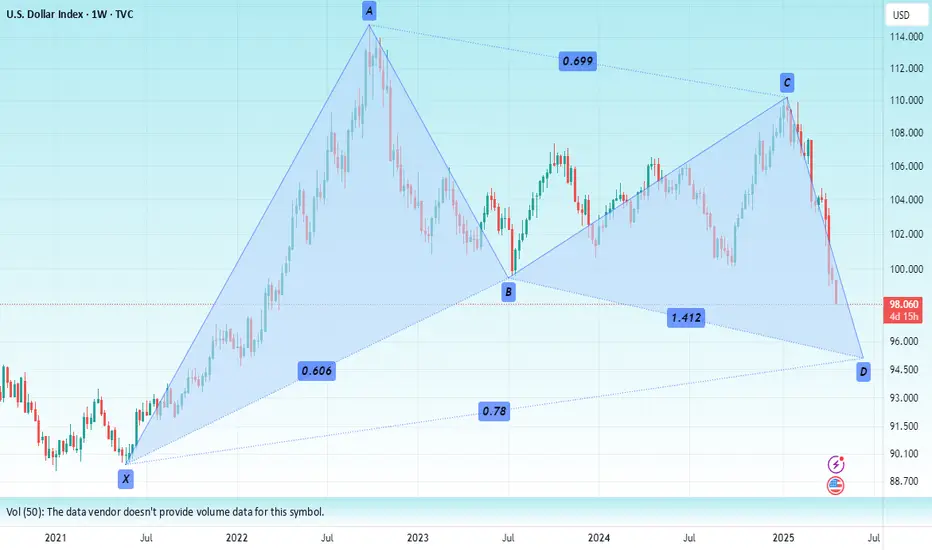
Dollar IndexHello & welcome to this analysis
Current decline in DXY could still continue all the way till 95 where it has a Bullish Harmonic Gartley.
At the current moment big resistance at 99-100, only above that a move towards 101.50 & then 1003
USDINR By KRS Charts 11th March 2025 / 7:24 PM
Why USDINR?
1. Wave Count is Clearly showing that USDINR is in Correction Wave.
2. FVG - Fair Value Gap is Visible + Price is also reacting as per both the theory.
3. 1:3 Risk/Reward
TARGET - Impulsive 4th Wave Level Depth
SL - FVG is Upper Band Closing Basis

Emergence Of Bear Flag Pattern in Bitcoin (BTCUSD)Similar to Nasdaq - ,
Bitcoin (BTCUSD) too forming a Bear Flag.
Similar price action but very high volatility due to news flow.
Lets see where it goes.
Trade Safe

kotak bank#KOTAKBANK near its 1st Target.
Entry: 1665
SL: 1590
Target: 1940/ 2065/ 2210
The intrinsic value of one KOTAKBANK stock under the Base Case scenario is 2 130.49 INR. Compared to the current market price of 1 902.35 INR, Kotak Mahindra Bank Ltd is Undervalued by 11%
happy trading!!!

GBP/JPY 15-Minute Chart AnalysisKey Observations:
1. Descending Trendline Break:
- The price has broken above a descending trendline, signaling a potential bullish reversal.
2. Demand Zone:
- The price found support near the highlighted demand zone 196.430–196.600.
3. Bullish Setup:
- A long trade setup is active, with stop-loss set below 196.168 (extended stop-loss at 195.782) and multiple take-profit targets:
- Target 1: 197.271
- Target 2: 198.063
- Target 3: 198.815
---
Trading Scenarios:
1. Bullish Continuation:
- If the price sustains above 196.600, it is likely to move toward 197.271. Breaking this resistance level could lead to further upward momentum targeting 198.063 and eventually 198.815.
2. Invalidation of Bullish Setup:
- If the price falls below 196.168, the bullish setup will be invalidated, and the pair might retest the previous low near 195.782.
---
Trading Plan:
- Entry (Buy): Above 196.750, targeting 197.271 (first target) and 198.063 (second target) and 198.815 (third target).
- Stop-Loss: Below 196.168 for standard risk or 195.782 for extended risk.
---
Stay disciplined with risk management and watch for any signs of rejection near resistance levels.
Disclaimer:
This analysis is for informational purposes only and does not constitute financial advice. Trading involves substantial risk, and past performance is not indicative of future results. Always conduct your own research and consult a financial advisor before making investment decisions. Trade responsibly.

USDINR By KRS ChartsDate: 3rd July 2024
Time: 7:40 PM
Why USDINR?
1. Everyone know INR is getting weaker against USD day by day, and same thing happened here since Oct 2022 but inside Rising Wedge Pattern in Weekly TF.
2. In Bigger view This Rising Wedge Pattern has formed around resistance line off Bigger Flag in Monthly TF. (Red Doted Line)
3. This pattern can either Breakout or Breakdown any side but after considering above both points its likely to Breakdown rather than Breakout till green dotted support line.
Currencies movements are on many Factors so Thats my view on USDINR is Slightly more bearish than Bullish.
But I will appreciate your views on this too, what you guys are thinking?

AUDUSD approaches 200-SMA hurdle on strong Australia inflationAUDUSD rises to the highest level in a week, up for the third consecutive day, as Australia Inflation numbers for March defend hawkish bias about the Reserve Bank of Australia (RBA) and underpin the Australian Dollar (AUD) strength. However, the overbought RSI could join the 200-SMA hurdle of 0.6535 to cap short-term upside of the Aussie pair. Following that, a downward-sloping resistance line from early January, close to 0.6615 by the press time, will precede a 15-week-old horizontal resistance area surrounding 0.6640-45 to challenge the buyers. In a case where the quote remains firmer past 0.6645, the previous monthly high of near 0.6670 will act as the final defense of the bears.
Meanwhile, the 23.6% Fibonacci retracement of the pair’s downturn from December 2023, close to 0.6480, put a short-term floor under the AUDUSD prices. Also acting as an immediate downside support is a one-week-long rising support line near 0.6460. It should be noted that February’s bottom of 0.6440 will act as an intermediate halt during the quote’s weakness past 0.6460 before targeting the yearly low marked the last week around 0.6360.
Overall, AUDUSD justifies upbeat Australia inflation but the pair’s further upside appears challenging.

GBPJPY TRADE SETUPGBPJPY has touched it's supply zone.
It may fall a bit in daily basis
Swing Target 179.00

AUD/CHF is at major levelAUD/CHF make or break level, AUD/CHF is at important level Forming a Channel Pattern in daily TF. Let's see this sustain or not. what is your view please comment it down. We are Certified. All views shared on this channel are my personal opinion and is shared for educational purpose and should not be considered advise of any nature.

JPYINR waiting periodMoving inside a predefined path. Considering the negative interest rate, Wont move out of the channel yet but by april or may, Once BOJ gives a decisive raise in rates, can see the breakout for a decent move on the upside

Ethereum (#Ethereum) tests its long-term trendline support When Ethereum (#Ethereum) tests its long-term trendline support, it often sparks a significant upward market movement, known as a bull rally.
#Pattern_Recognition: Ethereum (#Ethereum) has shown a recurring pattern where testing its long-term trendline support has resulted in substantial bull rallies.
#Historical_Timing: Notably, each of these support tests has historically occurred in the month of January.
#Projection_for_2024: If the historical trend continues, there's a possibility of witnessing a similar upward market movement or bull rally in January 2024, following the long-term trendline support test.

Cosmos Price Prediction : 10% gains on ATOM / USDT ATOM eyes 10% gains amid chatter about a fork
* Cosmos price remains above a crucial supply barrier extending from $6.161 to $8.966 with the potential for more gains.
* ATOM could climb 10% to tag the $10.218 resistance level, steered by bullish indicators and bullish speculation.
* Invalidation of the bullish outlook will occur once the cryptocurrency breaks and closes below the $8.545 critical support.

GBPUDRLong side good movements with buying pressure e can see
in this zone huge buying we will see(1.2677)

waiting for TRIANGLE BREAKOUT in BNBUSDTElliott Wave Analysis:-
Waiting for TRIANGLE BREAKOUT. Once the breakout took place then we decide the move of the wave .
i am not a SEBI registered advisor. Before taking a trade do your own analysis or consult a financial advisor. I share chart for education purpose only. I share my trade setup.

EURUSD drops within bearish channel with eyes on Jackson HoleEURUSD prepares for the sixth consecutive weekly fall as ECB and Federal Reserve bosses prepare for the annual showdown at the Jackson Hole Symposium. That said, the Euro pair remains pressured within a one-month-old descending trend channel amid downbeat RSI and MACD conditions, which in turn suggest less downside room and highlights the stated channel’s bottom line of around 1.0785 as the key support. In a case where the sellers dominate past 1.0790, the 78.6% Fibonacci retracement of May-July upside, near 1.0770, will act as the final defense of the buyers, a break of which will direct the prices toward May’s bottom of 1.0635.
On the contrary, a fortnight-long falling resistance line, close to 1.0880 at the latest, guards immediate EURUSD recovery within the bearish channel formation. Following that, the mentioned channel’s top line of near 1.0980 and the 200-SMA surrounding 1.1015-20 could test the Euro buyers before giving them a charge. In that case, the monthly high of 1.1065 and the late July peak of 1.1150 may check the upside moves ahead of directing the quote to the yearly top of 1.1275.
Overall, EURUSD bears appear running out of steam but the buyers need strong reasons to retake control, which in turn highlights the central bankers’ speeches at the key event for the pair traders to watch.

EURUSD 2HTrade Idea: BUY
📍 Entry: 🎯 Target: ⛔ Stop Loss: (MARKED IN CHART)
💡 RISK REWARD 1 : 3
💰 Risk 1% of your trading capital.
⚠️ Markets can be unpredictable; research before trading.Disclaimer: This trade idea is based on Elliott Wave analysis and is for informational purposes only. Trading involves risks; seek professional advice before making any financial decisions.Informational onLY !!!!AND IF YOU WANT TO LEARN IT WHAT STOPPING YOU TO ASK HOW ?

WOW DOLLOR Index is break the supportVery long time the doller index is below the 100 level this is psychological level of the market, if dollor is sustain below this is the good news for the India imerging market. This is the signal of bullish. 😍😍😍

USDINR Possible Elliott wave counts Hello Friends
Here we had shared possible Elliott wave counts on chart of USDINR, which is clearly showing that on bigger scale we are in 5th wave of some higher degree, in which we had finished wave (1)-(2)-(3) and currently we are in either in wave (4) or in wave 2 of wave (5).
Also both scenarios are discussed in this video post, you can go through this video post which is explained in best possible way for Educational purpose only.
I am not Sebi registered analyst.
My studies are for educational purpose only.
Please Consult your financial advisor before trading or investing.
I am not responsible for any kinds of your profits and your losses.
Most investors treat trading as a hobby because they have a full-time job doing something else.
However, If you treat trading like a business, it will pay you like a business.
If you treat like a hobby, hobbies don't pay, they cost you...!
Hope this post is helpful to community
Thanks
RK💕
Possible scenario
Alternate scenario
Disclaimer and Risk Warning.
The analysis and discussion provided on in.tradingview.com/u/RK_Charts/ is intended for educational purposes only and should not be relied upon for trading decisions. RK_Charts is not an investment adviser and the information provided here should not be taken as professional investment advice. Before buying or selling any investments, securities, or precious metals, it is recommended that you conduct your own due diligence. RK_Charts does not share in your profits and will not take responsibility for any losses you may incur. So Please Consult your financial advisor before trading or investing.

PostMortem on BankNifty Today & Analysis of 22 MAY 2023First time in many weeks, banknifty underperformed nifty50. Ideally this move should have come last week when nifty50 had 2 more resistances to break and banknifty was near ATH. Better late than never.
Nifty50 shooting pass banknifty is actually good for the entire stock markets in India. Only when all the components have caught up - a bullish trend is synchronized. This will pave the way for further breakouts.
Friday we went home with the news that Rs2000 denominated currency notes are getting removed from circulation w.e.f Sep 30 2023.
Theoretically this should be good news for the banks - approx. 2-3 lakh crore stashed cash is going to return to the banking sector. Majority of this will flow into fixed deposits, debt mutual funds, equity mutual funds & stocks. From a formal economic perspective - this may be the best decision ever made. Ideally Rs500 currency also should be withdrawn in the next 3 to 5 year (according to me) so that the digital migration will gain more momentum.
Having said that, I assume the economists & advisors has taken into consideration what will happen to the informal economy which is the silent backbone of real economic activity in India. Nobody has any clue how much of turnover is happening there - but its still huge!
Kirana shops, road side vendors, dalals, brokers, drivers, maids, caretakers, chaiwalas etc are all from the informal sector. I am not really sure how many of them even have a bank account, leave alone financial investment opportunities.
My grandfather used to carry cash with him, keep some in almari & some in the cash-pot near pooja room. Usually when the number of notes goes up - he exchanged it for the highest denomination available & stored it. He did not use a bank account then! I assume there would be lot of people in India who does the same even today (hope they get saved).
---
Coming back to our analysis, as per the options data there was lot of fresh shorts taken at CE side. Mostly in the afternoon session. This contradicts with the nifty50 view which has got some new hope as the H&S pattern was negated today.
The encircled traded region which just nullified a bearish chart pattern would have caused lot of momentum shift. Again as per options data shorts were created on the PE side.
As I see it, market participants are long on nifty and short on banknifty. A real tough scenario to play out as banknifty has 38% weightage. Possible options are niftyIT to outperform (12% weightage) along with Reliance (10%) & LT + ITC (8%).
This should be a mega fishing week for the option sellers as a strong breakout could only emerge if there is short-covering on banknifty. Nifty by itself may not be able to pull all the weight. Tomorrow's Finnifty expiry may lead the way when few positions in HDFC & Bajaj twins gets unwound.
---
15mts is in a range based trade as of now which kind of makes it a good reward:risk for non-directional option strategies ultra short term.
---
1hr shows the trading range getting narrowed, the lows are getting shifted higher and the highs are getting lower. What follows is usually a range expansion. Chart may say the break would be on the upside, but the reality could be dependent on even macro/news events.

USDINR Strong setupsupport now for USDINR @ 82.35-82.20 zone
while resistance is now at 83.025-83.075 which if breaks, a sharp upmove could take place
