Interest Rate Cycles & Bond Yield Trading1. Understanding Interest Rate Cycles
An interest rate cycle is the recurring pattern of rises and falls in a central bank’s benchmark interest rates over time. These cycles are driven by economic conditions such as inflation, growth, employment, and monetary policy objectives.
Phases of the Interest Rate Cycle
Expansionary Phase (Rate Hikes): When the economy grows too quickly, inflation rises. Central banks (like the Federal Reserve in the U.S.) raise rates to cool down borrowing, spending, and investment.
Peak Phase: This is when rates reach their highest point in the cycle. Economic growth may start slowing, inflation pressures ease, and borrowing costs are at their maximum.
Contractionary Phase (Rate Cuts): In slowing economies or recessions, central banks lower rates to encourage borrowing, spending, and investment. This is the stimulative phase.
Trough Phase: Rates hit their lowest point. The economy starts absorbing liquidity from rate cuts, setting the stage for the next expansionary cycle.
Determinants of Rate Movements
Inflation Expectations: Rising prices prompt rate hikes; falling prices can lead to rate cuts.
Economic Growth: Strong GDP growth may trigger higher rates, while slow growth can cause cuts.
Employment Levels: High unemployment often leads to easier monetary policy.
Global Factors: International interest rates, capital flows, and geopolitical events can influence domestic cycles.
Indicators to Track Interest Rate Cycles
Central Bank Statements & Minutes: Forward guidance often signals rate shifts.
Inflation Measures: CPI, PPI, and Core Inflation trends.
Economic Data: GDP growth, unemployment, retail sales, manufacturing indices.
Market Expectations: Futures markets (e.g., Fed Funds Futures) show predicted rate changes.
2. Bond Yields and Their Relationship with Interest Rates
A bond yield is the return an investor receives on a bond. There is a critical inverse relationship between bond prices and interest rates:
Inverse Relationship
When interest rates rise, existing bond prices fall because newer bonds offer higher yields.
When interest rates fall, existing bond prices rise as their fixed coupons become more valuable.
Types of Bond Yields
Current Yield: Annual coupon divided by current price.
Yield to Maturity (YTM): Expected return if held until maturity, accounting for price changes.
Yield Spread: Difference between yields of different bonds (e.g., corporate vs government) indicating risk appetite.
Yield Curve Dynamics
The yield curve plots yields across maturities (short, medium, long-term bonds). Its shape indicates economic expectations:
Normal Upward-Sloping Curve: Suggests growth; longer-term rates > short-term rates.
Flattening Curve: Signals slowing growth; long-term rates ≈ short-term rates.
Inverted Curve: Often precedes recessions; short-term rates > long-term rates.
3. Trading Bond Yields Based on Interest Rate Cycles
Bond yield trading is essentially anticipating how yields will move with interest rate cycles. Traders can use the following approaches:
Directional Trading
Expecting Rate Hikes: Short-duration bonds are preferred; yields rise, prices fall.
Expecting Rate Cuts: Long-duration bonds gain; yields fall, prices rise.
Yield Curve Strategies
Steepening Trades: Bet that long-term yields rise faster than short-term yields (common in early expansions).
Flattening Trades: Bet that short-term rates rise faster than long-term rates (common near peaks).
Inversion Trades: Profitable in anticipating recessions; short-term yields exceed long-term yields.
Spread Trading
Government vs Corporate Bonds: Wider spreads indicate risk aversion; narrowing spreads indicate higher risk appetite.
Inter-Maturity Spreads: Exploit changes in yield differences across maturities using bond futures.
Interest Rate Derivatives
Futures & Forwards: Predict interest rate moves without buying the underlying bonds.
Options & Swaps: Hedge or speculate on yield changes; e.g., a payer swap profits if rates rise, a receiver swap profits if rates fall.
4. Macro Strategies Linking Cycles and Yields
Rising Rate Environment
Shorten Duration: Bonds with shorter maturities are less sensitive to rate hikes.
Floating Rate Instruments: Beneficial as their coupons adjust with market rates.
Inverse ETFs: Designed to profit when bond prices fall.
Falling Rate Environment
Extend Duration: Long-term bonds benefit from price appreciation.
High-Coupon Bonds: Lock in yields before rates fall further.
Mortgage-Backed Securities: Sensitive to rate drops, can amplify returns.
Neutral or Transitioning Cycle
Barbell Strategy: Combine short-term and long-term bonds to balance risk and opportunity.
Bullet Strategy: Concentrate on bonds maturing around expected rate cuts or hikes.
5. Practical Considerations and Risks
Interest Rate Risk
The core risk: bond prices move inversely with interest rates.
Mitigation: duration management, hedging with derivatives.
Credit Risk
Corporate bond yields may reflect default risk in addition to interest rate changes.
Liquidity Risk
Some bonds, especially longer-term or lower-rated ones, can be hard to trade without affecting prices.
Inflation Risk
Unexpected inflation erodes fixed income returns. Treasury Inflation-Protected Securities (TIPS) can hedge this.
Market Sentiment & Global Events
Geopolitical crises, pandemics, or global central bank coordination can override domestic cycles temporarily.
6. Case Study Example
Early 2020s Scenario:
Post-pandemic, central banks cut rates to near zero.
Long-term government bonds rallied as yields fell sharply.
Traders extended durations and used yield curve steepeners.
As inflation picked up in 2022–23, rate hikes began:
Short-duration bonds and floating rate instruments outperformed.
Yield curve flattened as market anticipated future cuts.
This shows how understanding the cycle and its phase allows tactical bond yield positioning.
7. Key Takeaways
Interest rate cycles dictate the overall environment for bonds.
Bond prices move inversely to yields; duration management is critical.
Yield curves offer insight into economic expectations and future rate moves.
Trading strategies include duration adjustments, curve trades, spread trades, and derivative hedges.
Macro awareness (inflation, GDP, employment, global rates) drives informed yield trading decisions.
Success comes from anticipating cycle phases, not just reacting to them.
In essence, bond yield trading is a disciplined game of timing and positioning around interest rate cycles. Understanding the macroeconomy, central bank policies, and curve dynamics can provide traders and investors with a significant edge, whether for hedging, income generation, or speculative profit.
Cycleanalysis

If you ignore this than it's your choice INDEX:BTCUSD
I am also shocked
every November closed in green in Year on year based than november near to end then it means v shape bounce is ready to in 6 days
please do your own research before taking any trade.
i am not financial advisor
risk is real stay practical
please feel free to ask any questions

Outlook Cycles and the Importance of Cycle Analysis in TradingIntroduction to Outlook Cycles
Trading in financial markets is as much an art as it is a science. Among the tools that experienced traders use to anticipate market movements, outlook cycles play a critical role. An outlook cycle refers to the recurring patterns or phases in the market that repeat over time. These cycles are not arbitrary; they emerge from the collective psychology of market participants, macroeconomic trends, corporate earnings patterns, and broader financial and geopolitical influences.
Understanding these cycles allows traders to anticipate potential market turning points and adjust their strategies accordingly. While cycles do not guarantee exact price movements, they provide a probabilistic framework for predicting trends and reversals, making them invaluable for strategic planning in trading.
Defining Outlook Cycles
An outlook cycle in trading can be described as a repetitive sequence of market behavior, typically measured in time units such as days, weeks, months, or even years. These cycles can manifest across various financial instruments including stocks, commodities, currencies, and indices.
Key Features of Outlook Cycles
Repetition: Patterns tend to recur in similar forms over time.
Predictability: While not exact, they provide insight into probable future movements.
Duration: Cycles can be short-term (intra-day to weekly) or long-term (monthly, quarterly, yearly).
Amplitude: Cycles vary in magnitude, influencing how strongly price moves during different phases.
Types of Outlook Cycles
Outlook cycles can be categorized based on their duration and underlying factors:
Short-term cycles:
Usually last from a few hours to a few weeks.
Influenced by market sentiment, news, technical setups, and trader behavior.
Example: Stock price oscillations around support and resistance levels.
Intermediate cycles:
Typically span several weeks to months.
Influenced by quarterly earnings, monetary policy announcements, and macroeconomic indicators.
Example: Seasonal patterns in commodities or consumer stocks during festive periods.
Long-term cycles:
Extend from several months to multiple years.
Driven by fundamental shifts such as economic expansions or recessions, geopolitical events, or major technological disruptions.
Example: Bull and bear market cycles in equities or long-term commodity demand cycles.
Importance of Cycle Analysis in Trading
Cycle analysis is a crucial aspect of trading because it enables traders to anticipate market movements rather than react to them. Here are the key reasons why cycle analysis is vital:
1. Identifying Market Phases
Every market moves in phases: accumulation, uptrend, distribution, and downtrend.
Accumulation Phase: In this phase, smart money often accumulates positions quietly. Price moves are subtle but set the stage for the next upward move.
Uptrend Phase: Characterized by increasing prices, often driven by retail participation and positive sentiment.
Distribution Phase: Large investors start taking profits, leading to sideways or slightly downward movement.
Downtrend Phase: Prices decline as panic selling and negative sentiment dominate.
Cycle analysis helps traders identify these phases in advance, providing an edge in entering or exiting trades.
2. Timing Entries and Exits
By studying cycles, traders can refine their entry and exit points, rather than relying solely on price action or technical indicators. For instance:
Buying near the beginning of an uptrend cycle maximizes profit potential.
Selling or shorting near the peak of a cycle helps avoid losses during downturns.
This timing advantage is particularly critical in volatile markets where even a few days of misjudgment can result in significant losses.
3. Managing Risk
Cycle analysis allows traders to implement risk management strategies based on the stage of the market cycle. For example:
During a downward cycle, traders may reduce position size or hedge portfolios using options or inverse ETFs.
During upward cycles, traders may take on higher risk positions to capitalize on strong trends.
Understanding cycles provides a risk-reward framework rather than trading blindly.
4. Enhancing Strategy Development
Traders often combine cycle analysis with other methods like technical indicators, fundamentals, and sentiment analysis to create robust trading strategies.
Example: Using moving averages or Fibonacci retracements in conjunction with cycle peaks and troughs can improve accuracy.
Example: Combining economic data releases with known seasonal cycles in commodities (like oil or agricultural products) enhances decision-making.
5. Psychological Advantage
Markets are driven by human behavior, which is inherently cyclical. Fear, greed, optimism, and panic repeat across generations of investors. By recognizing these recurring emotional patterns, traders gain a psychological advantage over the average participant who trades impulsively.
6. Recognizing External Influences
Outlook cycles also help traders understand how external factors influence markets, such as:
Central bank policies affecting interest rates and liquidity.
Geopolitical tensions causing volatility in commodities like oil and gold.
Seasonal economic trends, such as holiday shopping periods boosting retail stocks.
By correlating cycles with external events, traders can anticipate market reactions rather than merely respond after the fact.
Practical Applications of Cycle Analysis
Stock Market Trading:
Identifying earnings cycles, dividend announcements, and market sentiment peaks.
Recognizing seasonal patterns, e.g., “Sell in May and go away” trend in equities.
Forex Trading:
Analyzing interest rate cycles, central bank policy cycles, and currency correlations.
Predicting trends based on geopolitical events affecting specific currencies.
Commodity Trading:
Tracking seasonal demand-supply cycles, such as oil demand in summer or agricultural harvesting cycles.
Understanding macroeconomic cycles like inflationary pressures influencing precious metals.
Options and Derivatives Trading:
Identifying implied volatility cycles to time option purchases or sales.
Understanding cyclical patterns in futures markets for hedging and speculative purposes.
Tools for Cycle Analysis
Several tools and techniques help traders analyze market cycles:
Technical Indicators:
Moving Averages, MACD, RSI, and Stochastic oscillators can identify cyclical peaks and troughs.
Elliott Wave Theory:
Recognizes repeating patterns in market psychology and price action.
Useful in identifying primary, intermediate, and minor cycles.
Fourier and Spectral Analysis:
Advanced methods that break down price data into component cycles to detect periodicity.
Seasonal Charts and Historical Analysis:
Compare current market conditions with historical trends to anticipate recurring patterns.
Economic Calendars and Fundamental Analysis:
Aligning macroeconomic cycles with market cycles enhances predictive accuracy.
Challenges in Cycle Analysis
While outlook cycles provide significant insight, traders must be aware of certain limitations:
No Guarantee of Accuracy:
Cycles indicate probability, not certainty. External shocks can disrupt patterns unexpectedly.
Multiple Overlapping Cycles:
Short-term, intermediate, and long-term cycles can interact, sometimes creating conflicting signals.
Complex Interpretation:
Reading cycles requires experience and often involves combining multiple analytical techniques.
Dynamic Market Conditions:
Cycles can shift over time due to changes in market structure, regulations, or participant behavior.
Despite these challenges, skilled traders view cycles as guiding tools, not absolute rules.
Conclusion
Outlook cycles are a cornerstone of informed trading, offering a structured approach to understanding market dynamics. By analyzing cyclical patterns, traders can anticipate market phases, time entries and exits, manage risk, and gain a psychological edge. Whether in stocks, commodities, forex, or derivatives, cycle analysis complements technical and fundamental methods, creating a more holistic and strategic trading approach.
While cycles are not infallible, they provide a probabilistic framework for decision-making in uncertain markets. Traders who master cycle analysis can move from reactive trading to proactive, calculated strategies, enhancing their potential for consistent profitability.
In short, understanding outlook cycles transforms market uncertainty into strategic opportunity, making cycle analysis one of the most valuable tools in a trader’s toolkit.
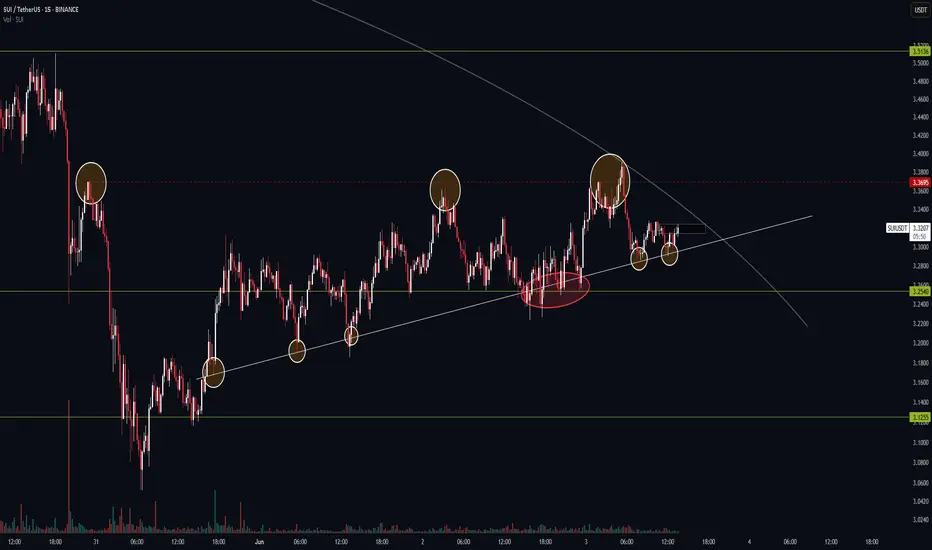
Trendline vs. Resistance — SUI’s Battle on the 15-Minute ChartBINANCE:SUIUSDT
📊 Cycle Structure:
HWC (Higher Wave Cycle): Bullish 🔼
MWC (Middle Wave Cycle): Bearish 🔽
LWC (Lower Wave Cycle): Bullish 🔼
📌 This mixed structure creates a conflicting environment — higher timeframe trend is bullish, but MWC acts as a drag, preventing smooth upward momentum.
📉 Market Structure:
Currently, price is consolidating with a slight bullish tilt. BTC itself is in a very uncertain state, but its cycles are still bullish — meaning SUI might act unpredictably.
We’re looking at two main setups here:
Long Entry: On clean breakout of key resistance.
Short Entry: On breakdown of the descending trendline.
🔸 The 15M descending trendline has already seen 6 touches.
✅ A breakdown could trigger a short setup — but since it's on a low timeframe, don’t expect a massive dump.
🎯 First TP zone for shorts: the 32540 support — a solid zone for partial profit-taking.
🟢 My Personal Preference — Long Bias:
I'm leaning toward the long side for a few reasons:
HWC and LWC are both bullish.
BTC.D just rejected hard from its channel top — signaling altcoins like SUI may perform better.
🔹 32695 has seen 3 touches already, with the third one being a fakeout.
✅ If we see weak selling pressure and strong volume on the next touch, it can be a valid long trigger.
🎯 Potential upside target: the 35135 resistance zone — where a decent reaction is expected.
📌 Want a specific coin or pair analyzed? Drop it in the comments — I’ll pick a few and break them down.
⚠️ Without proper risk management, you're just a ticking time bomb.
— PXA | Structure-Based Precision Trading
#Bitcoin possible scenarios for the next bull market#Bitcoin possible scenarios for the next bull market based on time cycle analysis.

VIPCLOTHNG #Watchlist
#VIPCLOTHNG (W):-CMP 36.5 Looks Good above 40 for more upsides :)
#Disclaimer:-View shared is for educational purposes only. Conduct your due diligence before making any trading or investment decisions.

INDUSINDBK (M)INDUSINDBK (M) is in an uptrend (ascending channel).
An ascending channel is the price action contained between upward sloping parallel lines. Higher highs and higher lows characterise this price pattern. Technical analysts construct an ascending channel by drawing a lower trend line that connects the swing lows and an upper channel line that joins the swing highs.
1) An ascending channel is used in technical analysis to show an uptrend in a security’s price.
2) It is made up of two positive sloping trend lines drawn above and below a price series depicting resistance and support levels.
3) Channels are used commonly in technical analysis to confirm trends and identify breakouts and reversals.
After a COVID FALL, INDUSINDBK is facing a resistance trend line which INDUSINDBK broke on the start of August. If INDUSINDBK breaks and sustains above 1250, then 1500, 2000, and 3000 will easily come in future uptrend months.

ICICIBANK perfect example for cycle stockEvery Stock is having bad phase and good phase in their life span.
Good phase will give up time cycle and bad phase will give down time cycle.
When you are trading on that time you forget the stock is up cycle or in down cycle and you trade blindly which results in draw down in your system.
Till you include the time in your analysis with price your system will not get good results.
You can take Lunar cycle as daily chart reference point for in your candles or Sun cycle in weekly time frame or cycle indicator of tradingview.
Please like and follow if you like the explanation.

BankNifty - LongTerm / ShortTerm Outlook (Time Cycles)Long Term Outlook
We picked time cycle tool available in drawing tools & tried getting dominant lows & highs. Over the process we realised that 18 Week cycle is dominant & running for Bank Nifty Index giving us important lows & highs.
Next low could be due in middle of the Oct 2022 which could be shifted to close to Nov 2022 if current high holds at 39759 which was identified as the recent high
Cycle Analysis
Cycles are always measured from low to low only but at times we can break that rule for analysis purpose & we can even take low to high but these won't be termed as cycles because cycles are always low to low.
In Cyclical Analysis
Low = Trough
High= Crest
Short Term Outlook
We identified an ending diagonal which marks the end of the trend & usually occurs later in the trend signifying that we could be close to the tops
Till the the high of 39759 is intact we assume that another wave is pending downside & have to review again if 39759 highs are taken out on upside.
On short term basis a parallel channel is used to get possible resistance zone which could be upper end of parallel channel close to 39300-39400 zone . If halts at the top then we may assume that fall may start or if Index fall below 38803 lows
Thank you for watching the video & have a nice weekend.

Nifty wave counts from 15183This is one of the rare case where a 3 wave move up has a C wave extension greater than the regular 1.382/1.618.
In super-extended moves, we have seen C Waves extend to 2.0 and even 2.618 of wave A.
What determines the future move is the speed of reversal post completion of Wave C/3.
Another supporting evidence for it being a wave C and not wave 3 is that the initial moves prior to wave C was a clean Wave A i.e. a 3 wave move contained withing parallel lines, whose subwaves tended to equality.
A bull case could be made that - no it was a 1-2-i-ii and not an a-b-c within Wave A, but generally in 1-2-i-ii, the lower degree 1 is shorter than the length of the higher degree 1. Here, both waves tended to equality. Hence an argument for it being a wave A is stronger.
Now we will have to see how price behaves at prior wave 4s of lower degree. Immediate supports are offered in the range of 17150-17450, which is the range of the Wave 4 of lower degree. A corrective rise from there will confirm that we are going further lower.
Will revisit this developing idea once we are at 17150-200.
-ansible/entropy

BITCOIN AT A JUNCTURE OF REVERSALBitcoin/USD may have completed its cycle of one wave
up and one wave down.
Now the time for reversal anytime soon.
We can wait till the .786 is reached as we already have
completed the .618 level and are below that level.
Good investment opportunity may knock your door.
Regards


Nifty spot good short candidateNifty spot cmp 13000
Elliot wave study :- on weekly time frame major elliot wave impulse phase is on verge to mature,, 20 year cycle is on verge to mature,, now if corrective wave unfolds there can be price wise and time wise correction on index..
Wave 1 is of around 5510 points ,, wave 3 is or around 10175 points which is longest and strongest wave of impulse phase and perfectly 2 time of wave 1,, wave 5 is of around 5600 points almost same as wave 1..wave 2 have corrected around 78.6% of wave 1 which is perfect retracement as per elliot wave theory.. wave 4 have retraced around 50% of wave 3 which is also as per theory..
RSI divergence :- Price is consistently making higher high from the peaks of wave 3 to wave 5,,where is RSI making Lower high high bearish divergence,, historicaly most of time it is observed that when there is bearish divergence and RSI touch 70 levels it tends to fall.. at the moment RSI is almost at 70 levels.
Chart pattern :- Rising channel formation structure can be seen in whole impulse phase,, where Support and resistance line are well respected through the cycle.. at the moment index is trading around the resistance line of the rising channel pattern,,and overbought as per concept of price action..

neutralbank nifty 28600 below trade to weak . re visit again 26500 test next my time period to date 22/10/10 before touched
