BTCUSD · 15M · SMC BiasPrice is currently compressing inside a higher-timeframe premium discount equilibrium, respecting a clear range structure.
HTF Context
Equal highs / liquidity resting above the range highs.
Premium zone overhead aligned with prior supply + inducement.
Discount zone below marked by clean HTF demand.
LTF Narrative
Market already delivered a strong impulsive leg up.
Current consolidation suggests liquidity engineering, not continuation.
Upside push toward the equal highs is likely a liquidity grab, not acceptance.
Expectation
Sweep of buy-side liquidity into the premium zone.
Immediate reaction from supply.
Sharp displacement to the downside targeting:
Range low
Discount imbalance
HTF demand below
Execution Plan
No chasing longs in premium.
Wait for:
Liquidity sweep above highs
Bearish displacement
LTF MSS confirmation
Shorts favored post confirmation.
Targets trail into discount until opposing demand shows intent.
Cypher

Godrej Consumer Products Ltd: AnalyzingTechnical Analysis: Cypher Pattern and Support Levels
Godrej Consumer Products Ltd has formed a Cypher pattern in its stock chart and is currently trading around a significant support level at ₹1100. The stock has experienced a notable decline, making it an interesting consideration for long-term investors.
Fundamental Performance Overview
Revenue Growth: In the latest quarter, Godrej Consumer Products reported a 10.08% increase in revenue, marking the highest growth rate in the last three years. This growth reflects strong demand in the FMCG sector, particularly in personal care and household products.
Net Profit: The company's net profit has shown resilience, with a reported increase of 3.5% year-over-year, indicating effective cost management and operational efficiency.
Price-to-Earnings (P/E) Ratio: The current P/E ratio for Godrej Consumer Products stands at approximately 9.2, which is favorable compared to the industry average, suggesting that the stock may be undervalued relative to its earnings potential.
Debt Levels: The company maintains a low debt-to-equity ratio of 0.24, indicating strong financial health and minimal reliance on debt financing, which enhances its stability.
Return on Equity (ROE): Godrej Consumer Products has reported an ROE of 18.6%, reflecting its ability to generate profits effectively from shareholders' equity.
Dividend Yield: The company offers a dividend yield of around 1.5%, providing some returns to investors amidst market fluctuations.
Market Capitalization: As of January 20, 2025, Godrej Consumer Products has a market capitalization of approximately ₹1,15,948 crore, reinforcing its position as a leading player in the FMCG sector.

Blue Dart Express Ltd: Evaluating Investment Potential Technical Analysis: Cypher Pattern and Support Levels
Blue Dart Express Ltd has formed a Cypher pattern in its stock chart and is currently trading with a 40% decline from its recent highs. The stock is finding significant support around the ₹5600 level, which may present a strategic entry point for long-term investors.
Fundamental Performance Overview
Revenue Growth: In the latest financial quarter, Blue Dart Express reported a 9.36% increase in net sales, amounting to approximately ₹1,448.46 crore, indicating resilience in demand for its logistics services despite market challenges.
Net Profit: The company experienced a 13.99% decline in net profit, reporting ₹62.84 crore for Q2 FY24-25, which reflects pressures from rising operational costs and competitive market conditions.
Price-to-Earnings (P/E) Ratio: The current P/E ratio for Blue Dart stands at approximately 49.08, suggesting that the stock may be considered overvalued relative to its earnings potential, especially in a competitive logistics sector.
Debt Levels: Blue Dart maintains a low debt-to-equity ratio of 0.01, indicating strong financial health with minimal reliance on debt financing, which enhances its stability and operational flexibility.
Return on Equity (ROE): The company reported an ROE of 10.45%, reflecting its effectiveness in generating profits from shareholders' equity, although this is lower than some industry peers.
Dividend Yield: Blue Dart Express offers a modest dividend yield of around 0.77%, providing some returns to investors amidst market fluctuations.
Market Capitalization: As of January 2025, Blue Dart Express has a market capitalization of approximately ₹14,775 crore, reinforcing its position as a key player in the logistics and express delivery sector.

Bank of India: Evaluating Recovery PotentialTechnical Analysis: Cypher Pattern and Support Levels
Bank of India has formed a Cypher pattern in its stock chart and has experienced an overall decline of 80% from its peak. Currently, the stock is finding good support around the ₹1100 level, indicating a potential recovery phase for investors.
Fundamental Performance Overview
Revenue Growth: In the latest financial results, Bank of India reported a 15.95% year-over-year increase in advances, reflecting strong growth in its loan portfolio, which is higher than its five-year compounded annual growth rate (CAGR) of 8.86%.
Net Profit: The bank's net profit surged by 61.58% year-over-year, reaching approximately ₹2,421.29 crore for Q2 FY24-25. This significant increase demonstrates effective cost management and improved operational efficiency.
Price-to-Earnings (P/E) Ratio: The current P/E ratio stands at around 5.6, which is relatively low compared to the sector average, suggesting that the stock may be undervalued based on earnings potential.
Reasons for the Significant Decline
The substantial decline in Bank of India's stock price can be attributed to several factors:
Economic Slowdown: The broader economic slowdown and challenges in the banking sector led to increased NPAs and reduced investor confidence.
Market Volatility: Fluctuations in market conditions and investor sentiment negatively impacted the stock performance.
Regulatory Challenges: Regulatory pressures and changes in banking policies may have contributed to uncertainty regarding future profitability.

Axis Bank: Cypher Pattern Formation and Support Zone AnalysisAxis Bank has formed a cypher pattern and is currently trading above a support zone around ₹1000, following a 30% drop from its all-time high1. As of February 6, 2025, Axis Bank's stock traded at ₹1,012.00, with a market capitalization of ₹314,265 crore1. The bank demonstrates good financial performance, as seen by a TTM EPS of ₹91.02 (+109.53% YoY) and is considered to have good to expensive valuation

Nifty 50 upcoming expiry OTM options writing play.so Nifty succesfully has formed two harmonics pattern.
1. 5-0 pattern which typically pesents a bullish view.
2. Cypher pattern which presents a bearish view in a short term.
according to this, one must have to close their CE writing positions at 22180 or 22105.15 and start writing the PE options of 22150 strike or whichever they are comfortable in it. whoever had left their chance in writing it.
if someone is comfortable in futures, than with a tight hedge one can go long at these points.
our stoploss should be below recent low of 21964.60
target 22582 or nearby it.

Gold Next Move SL 1Hr candle close only, Target Trigger Price
All detail for chat. good entry at mark price only. and must stoploss minimum risk and good profit. risk ratio 1:1 to manage modified SL.
📌 This is not a buy/sell recommendation, just an educational trading idea.
📌 Market conditions can change; always conduct your own research.
📌 Understand risks before investing and take full responsibility for decisions.

Federal Bank Ltd (NSE)Federal Bank Trade Setup - Key Levels to Watch! 📊🚀
Stock: Federal Bank Ltd (NSE)
Timeframe: 1D Chart
Current Price: ₹177.62
First Entry Level: Above ₹179.04
Stoploss: 173
Second Entry Level: 160
Stoploss: Below ₹156.03 (Strong support at ₹160.14)
🎯 Bullish Targets:
✅ ₹195.04
✅ ₹225.24 - ₹225.33 (Final Target)
🔻 Bearish Breakdown Levels:
⚠ ₹173.05 Breakdown → Next major support at ₹160.14 & ₹156.03

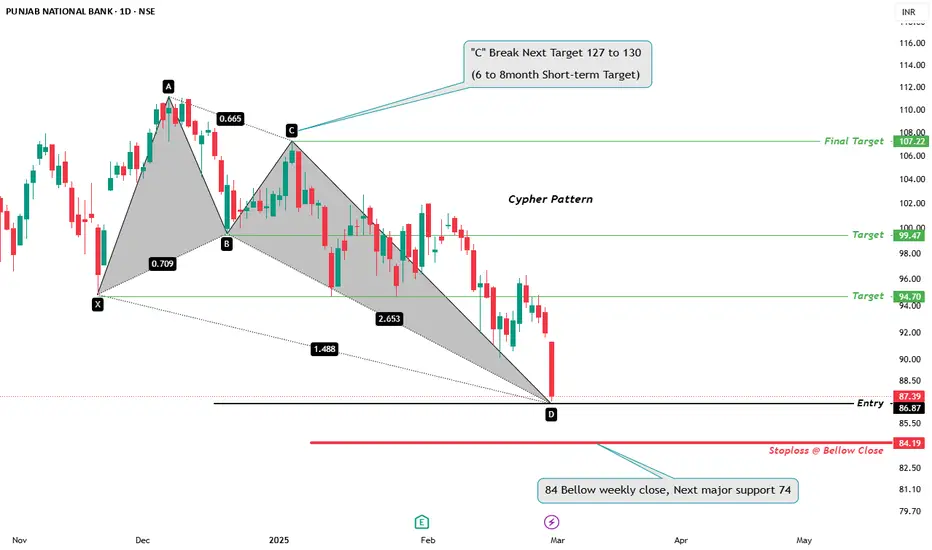
PNB Trade Setup**🚀 PNB Trade Setup - Key Levels to Watch! 📊📉**
📊 **Stock:** PUNJAB NATIONAL BANK (NSE)
🕒 **Timeframe:** 1D Chart
🔹 **Current Price:** **₹87.39**
🔹 **Entry Level: 86 to 87 ⚡
🔹 **Stoploss:** **Below ₹84.19** (If weekly close is below ₹84, next major support is ₹74)
🎯 **Bullish Targets:**
✅ **₹94.70**
✅ **₹99.47**
✅ **Final Target ₹107.22**
✅ **If 'C' Breaks, Next Target ₹127 - ₹130 (6-8 Months)**
🔻 **Bearish Breakdown Levels:**
🚨 **₹84 Breakdown → Next major support at ₹74**
💡 **Key Insights:**
✔️ **Cypher pattern completion at 'D' - Possible Reversal Zone!**
✔️ **Sustaining above ₹87.39 could lead to a strong bullish move** 📈
✔️ **Failure to hold ₹84 may result in further downside towards ₹74** 📉
⚠️ **Disclaimer:** This analysis is for **educational purposes only** and not financial advice. Trade wisely! 📊
ICICI hold 1 to 6 month **📢 ICICI BANK Trade Setup - Key Levels to Watch! 🚀**
📊 **Stock:** ICICI BANK (NSE)
🕒 **Timeframe:** 1D Chart
📉 **Pattern:** Cypher Pattern
🔹 **Current Price:** **₹1,224.15**
🔹 **Retest Range:** **₹1,231.35** 🔴
🔹 **Breaking Range:** **₹1,186.60 / ₹1,273.20** 🔵
🎯 **Bullish Targets:**
✅ **₹1,360.20**
✅ **₹1,466.95**
🔻 **Bearish Breakdown Levels:**
🚨 **Strong Selling Below ₹1,186.60**
🚨 **Target ₹1,120 & ₹1,000**
💡 **Key Insights:**
✔️ **Breakout above ₹1,273.20** can trigger a strong bullish move 📈
✔️ **Failure to hold ₹1,186.60** could push the price lower 📉
✔️ **Retest zone at ₹1,231.35 - Important resistance!** 🔍
⚠️ **Disclaimer:** This analysis is for **educational purposes only** and not financial advice. Trade wisely! 📊

Nifty Next moveSL 1Hr candle close only, Target Trigger Price
All detail for chat. good entry at mark price only. and must stoploss minimum risk and good profit. risk ratio 1:1 to manage modified SL. This is not call, Just my idea. Please understand your risk and take full responsibility of your actions

Copper Next moveSL 1Hr candle close only, Target Trigger Price
All detail for chat. good entry at mark price only. and must stoploss minimum risk and good profit. risk ratio 1:1 to manage modified SL. This is not call, Just my idea. Please understand your risk and take full responsibility of your actions

Dr. Reddy's: Cypher Pattern and Support Level AnalysisDr. Reddy's Laboratories has formed a cypher pattern and is finding support around the ₹1200 level, after a recent 15% fall. Dr. Reddy's shares are trading at ₹1250.20, reflecting a 1.85% change for the day1. The company exhibits low volatility compared to the market, with a six-month beta of 0.2055

Naturalgas Next MoveSL 1Hr candle close only, Target Trigger Price
All detail for chat. good entry at mark price only. and must stoploss minimum risk and good profit. risk ratio 1:1 to manage modified SL. This is not call, Just my idea. Please understand your risk and take full responsibility of your actions

HDFC LifeSL 1Hr candle close only, Target Trigger Price
All detail for chat. good entry at mark price only. and must stoploss minimum risk and good profit. risk ratio 1:1 to manage modified SL. This is not call, Just my idea. Please understand your risk and take full responsibility of your actions

Gold Next MoveSL 1Hr candle close only, Target Trigger Price
All detail for chat. good entry at mark price only. and must stoploss minimum risk and good profit. risk ratio 1:1 to manage modified SL. This is not call, Just my idea. Please understand your risk and take full responsibility of your actions

Banknifty This monthSL 1Hr candle close only, Target Trigger Price
All detail for chat. good entry at mark price only. and must stoploss minimum risk and good profit. risk ratio 1:1 to manage modified SL. This is not call, Just my idea. Please understand your risk and take full responsibility of your actions

Naturalgas 1 weekSL 1Hr candle close only, Target Trigger Price
All detail for chat. good entry at mark price only. and must stoploss minimum risk and good profit. risk ratio 1:1 to manage modified SL. This is not call, Just my idea. Please understand your risk and take full responsibility of your actions

SILVER 1 weekSL 1Hr candle close only, Target Trigger Price
All detail for chat. good entry at mark price only. and must stoploss minimum risk and good profit. risk ratio 1:1 to manage modified SL. This is not call, Just my idea. Please understand your risk and take full responsibility of your actions

GICL has a potential to move up?This is purely technical, on a daily chart, GICL has formed a bullish cypher pattern, also it took support at 200 day moving average, and its RSI is also about to breakeven. All this indicate a positive move upwards.
Disclaimer: Kindly consult your financial advisor before taking any trade..!

RKLB: Changes In LatitudesRocket Lab's upcoming launches are critical to its growth, as they demonstrate the company’s technical reliability and ability to secure high-profile contracts. With their reusable Electron rocket and the upcoming Neutron launch vehicle, Rocket Lab targets the growing small satellite market, which is essential for telecommunications, Earth observation, and defense applications. Successful launches will not only enhance their competitive position against larger players like SpaceX but also drive increased revenue and investor confidence, as the space sector continues to expand toward a projected $1 trillion valuation by 2040. NASDAQ:RKLB
1. Revenue Growth
In Q2 2024, Rocket Lab posted $62 million in revenue, up 71% year-over-year. This growth is driven by an increasing number of launches and contracts in spacecraft manufacturing and services. The company's client base includes commercial operators, defense contractors, and government agencies. As satellite constellations continue to rise in demand for communication and Earth observation purposes, Rocket Lab's tailored solutions for small and medium-class payloads make them a crucial player in this expanding market.
2. Technological Edge and Competitive Positioning
Rocket Lab’s Electron rocket is the first reusable small rocket in the world, allowing it to capture a unique market position. Additionally, its Photon satellite platform and upcoming Neutron rocket—capable of launching medium payloads—place it in competition with industry giants like SpaceX. These innovations are critical as the company aims to cater to the growing demand for low-Earth orbit (LEO) satellites, critical for future internet and IoT connectivity.
3. Financial Health and Potential for Undervaluation
Rocket Lab’s price-to-book ratio of 0.99 suggests potential undervaluation, indicating that the stock trades near the value of its assets. While the company’s P/E ratio is negative (-31.97), reflecting short-term losses as it scales, analysts expect EPS to improve from -$0.39 to -$0.30 by next year. The company’s high level of reinvestment into growth initiatives, including expanded launch capabilities and satellite services, suggests it is positioning itself for profitability in the coming years.
$11.19 NASDAQ:RKLB

Nifty This Month FUT Entry @ 24880 to 920
SL 24800
Target 25140 (B) and 25350 (C)
Final Target 25700 to 740
Ratio 1:5 and 1:10
SL 1Hr candle close only, Target Trigger Price
All detail for chat. good entry at mark price only. and must stoploss minimum risk and good profit. risk ratio 1:1 to manage modified SL. This is not call, Just my idea. Please understand your risk and take full responsibility of your actions

FINNIFTY (CNXFINANCE) - A BEARISH CYPHER PATTERN FORMED. NSE:CNXFINANCE
❇️Harmonic chart pattern: BEARISH CYPHER PATTERN
👉🏻The Cypher pattern is one of the most profitable harmonic patterns and is useful for risk management, because of the large success rate. Traders can minimize losses if they follow the Cypher trading rules and meet the profit target.
🚀How to use
❇️The Cypher harmonic pattern is a trading strategy that uses Fibonacci numbers to identify turning points in geometric price patterns. It can help traders predict future movements, determine when trends will reverse, and decide when to buy and sell. Here are some steps for using the Cypher pattern:
❇️1. Draw the patterns
👉🏻Start with a bullish or bearish impulsive move from point X to A. Then, use a Fibonacci retracement tool to find point B between 38.2% and 61.8% of XA, without closing past 61.8%. Next, use a Fibonacci expansion tool to find point C between 127.2% and 141.4% of the move from X to A, without closing past 141.4%. Finally, use a Fibonacci retracement tool to find point D by moving from X to C and reaching the 78.6% region. You can also use a Fibonacci expansion tool to find point D by moving from B to C and landing between 127.2% and 200%.
❇️2. Enter the pattern
👉🏻Traders can enter a Cypher pattern by setting a limit order at the 78.6% level or using a market order after the price starts to reverse.
❇️3. Set stop losses
👉🏻For a bearish Cypher, place stop losses just above point X. For a bullish Cypher, place stop losses just below point X.
❇️4. Set take profits
👉🏻Draw a Fibonacci extension from point C to point D and set multiple take profits. For example, you could set the first take profit at Fibonacci one, the second at 1.272, and the third at 1.618. You can break into the trade when any of the take profits are hit. Many traders partially close their position at point A, but you can also choose point C for a more aggressive approach
ENTRY STATUS: ACTIVE ✅
TARGET 23440-23140-22555 (as per this harmonic chart pattern)
SL 23670
🚀Happy trading 🫡
👉🏻 @thetradeforecast🇮🇳
