EXE - Institutional Demand at Work: High-Probability Trade Setup🧭 Overall Market Context 🧭
Price is currently trading inside an overlapping demand zone , and the quality of this zone is GOOD . What makes this setup stand out is the very strong follow-through seen when price previously left this area. Such impulsive exits are a clear footprint of institutional participation , where large players are unable to fill all their buy orders at once, leaving pending demand behind.
This return into the same zone gives the market a second chance to react — and these are often the areas where smart money steps in again.
🔍 Zone Quality & Structure 🔍
The structure of the current demand zone adds further confidence to the setup:
The demand zone is fresh and unviolated , meaning price has not yet consumed the pending buy orders.
The leg-out from the zone was impulsive , showing urgency and imbalance in favor of buyers.
Overlapping demand zones are present, which increases the probability of a strong reaction.
Price has now returned deep into the demand zone , which is an ideal location for planning long trades.
From a supply–demand perspective, this is exactly where we want price to be — low risk, high potential.
📈 Trend & Higher Timeframe Alignment 📈
Trend plays a crucial role in probability, and here the bigger picture is clearly supportive:
The weekly timeframe trend is UP , favoring buying opportunities from demand.
There is no higher-timeframe or daily supply zone overhead until the projected target area.
This creates clean upside space , reducing the risk of early rejection.
When demand aligns with the higher-timeframe trend and there is no nearby supply, the odds naturally tilt in favor of continuation.
🎯 Trade Plan & Risk Structure 🎯
A structured plan keeps emotions out of the equation:
Entry : From the current price area inside the demand zone.
Stop Loss : Below the distal line of the lower demand zone.
Target 1 : Minimum 1:2 risk–reward .
Risk here is clearly defined — a key characteristic of professional trade planning.
🧠 Market Logic Behind the Setup 🧠
Strong follow-through confirms institutional interest.
Higher-timeframe uptrend supports continuation.
Clean upside structure reduces friction for price movement.
This is a trend-aligned demand trade , not a counter-trend gamble.
When strong zones meet the right trend and location, probability quietly stacks in your favor.
🚀 Final Thoughts 🚀
This setup reflects the essence of demand and supply trading — clarity, structure, and patience . Trades like these don’t require prediction; they require discipline and alignment.
📉➡️📈 Trade with logic, manage risk with respect, and let probability do the heavy lifting. 💡🔥
Lastly, Thank you for your support, your likes & comments. Feel free to ask if you have questions.
This analysis is purely for educational purposes only and should not be considered as trading or investment advice..
Demand Zone

XAUUSD Pullback to Demand Zone @ 4400 - 4390Gold (XAUUSD) faced a strong rejection from the 4500 supply zone, triggering a healthy corrective move. Price is now approaching a key demand area between 4400 – 4390, where buyers are expected to step in.
If this support holds, we anticipate a bullish bounce with upside targets at 4425, 4435, and 4450.
This zone could offer a high-probability buy setup for short-term to intraday traders, provided bullish confirmation appears.
📌 Disclaimer:
This analysis is for educational purposes only and is not financial advice. Always manage risk and follow your trading plan.
Your feedback drives our content and keeps everyone trading smarter. Let’s make those pips together! 🚀
Happy Trading,
– The InvestPro Team

Reversal Trade – NAUKRI (Info Edge) | 1H ChartNSE:NAUKRI
📌 Trade Description
This is a classic demand-based reversal, not a random bottom-pick. Price has corrected sharply into a previously validated demand zone, where aggressive buying earlier pushed price up with momentum. Now price has returned to the same zone with declining momentum, offering a low-risk, high-R:R opportunity.
If this demand fails, the trade is invalid. Simple. No hope-trading here.
🔍 Technical Analysis
Trend Context: Short-term down-move, but within a broader range. This is a mean-reversion + base formation play, not a breakout chase.
Demand Zone (₹1320–₹1330):
⦿Earlier sharp impulse move originated from this zone → proves institutional participation.
⦿Price revisiting demand after time + correction = fresh probability.
Price Behaviour:
⦿Selling pressure is slowing down near demand.
⦿Smaller candles + wicks = absorption, not aggressive distribution.
Structure Expectation:
⦿First: base formation inside demand
⦿Then: higher low on 1H
Finally: reversal push toward ₹1370–₹1385 zone.
🎯 Trade Plan
Entry: Near demand zone after stabilization (no blind buying)
Stop Loss: Below demand zone (tight & non-negotiable)
Targets:
⦿T1: ₹1348–₹1360
⦿T2: ₹1375–₹1385
Risk–Reward: Minimum 1:2
This is a reaction trade, not a prediction.
Stay disciplined. Let price confirm, then execute.
Keep Learning,
Happy Trading.

Gold Futures | Bullish Reversal Setup from Demand ZoneThis chart shows a bullish setup on Gold Futures (GC1!) based on a pullback into a 2-Hour + 125-Minute Demand Zone confluence due to FII's pending orders.
I’m expecting the price to retrace back into the marked demand area before continuing higher toward the upside targets.
Plan
• Entry: Inside the 2H & 125m Demand Zone
• Stop Loss: Just below the zone
• Target 1: 4,401
• Target 2: 4,438

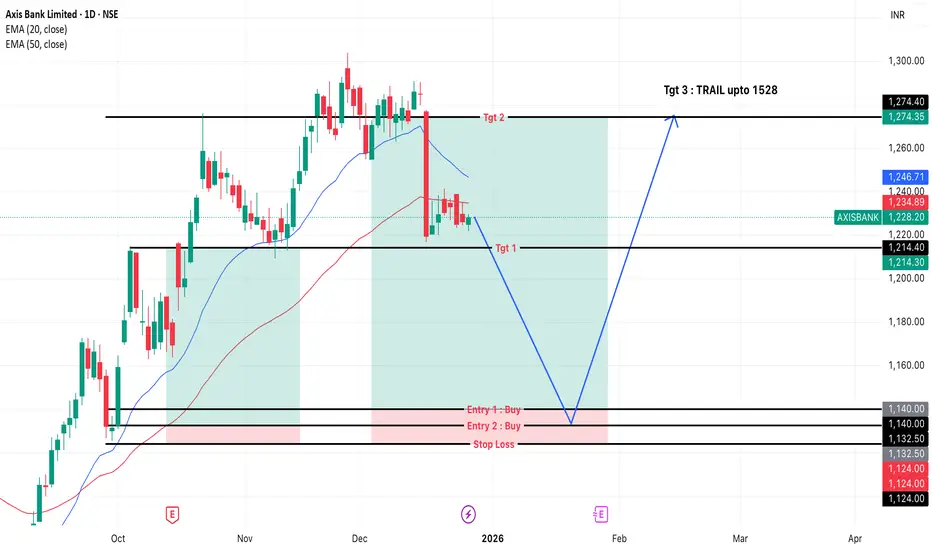
Axis Bank — Positional Long Setup | Plan the Pullback🟢 Long Plan – Buy the Dip Zone
🛒 Entry Zones
Entry 1: around ₹1140
Entry 2: around ₹1132–₹1124 (deeper fill zone)
⛔ Stop Loss
Below ₹1124 (decisive breakdown = setup invalid)
🎯 Upside Targets
Target 1: Previous support retest near ₹1214
Target 2: Resistance retest around ₹1274
Target 3: Trail the position toward ₹1528 if momentum continues
I prefer partial booking + trailing SL as price moves higher.
Trade Logic: A positive Trend & Pulse on daily and weekly time frames + A strong Demand Zone with FII's Pending Orders.
MTF Demand Confluence: High-RR Reversal SetupMulti Timeframe Supply & Demand Analysis
🕰️Yearly Timeframe
On the Yearly timeframe, price has already broken above a major supply zone, signaling strong higher‑timeframe bullish intent and possible long‑term accumulation by institutional players. Just above this breakout, price tapped into a previously tested yearly supply zone, from where it faced rejection and started to rotate lower, confirming active overhead supply.
This structure shows a classic “Break–into–higher supply” reaction, where long‑timeframe trend strength is present, but price is temporarily capped by remaining sell orders in the upper zone. A clean, sustained break above this upper yearly supply could unlock a fresh leg of long‑term upside.
📆 Half-Yearly Timeframe
On the Half-Yearly timeframe, price is currently approaching a strong demand zone — a critical level where significant buying pressure was previously observed. This prior bullish activity proved powerful enough to break through a previous Half-Yearly supply zone, clearly signaling the presence of institutional demand or major accumulation at this area. 💪
This HYTF demand confluence adds further conviction to the overall bullish structure, as it validates sustained buyer interest capable of overcoming historical supply barriers.
📉 Monthly Timeframe
On the Monthly Timeframe, price first reacted downward from a Monthly Demand Zone (MDZ) that coincided with a Half‑Yearly Supply Zone (HYSZ), creating a strong confluence area where sellers stepped in aggressively. As price moved away, the nearest Supply Zone (SZ) was respected again, extending the selling leg and confirming short‑term bearish order‑flow.
Currently, price is approaching Monthly Demand Zone that overlaps with a Half‑Yearly Demand Zone (HYDZ), forming a powerful HTF demand confluence with high probability of bullish reversal. If buyers manage to defend this HYDZ–MDZ cluster, it can act as a strong platform for a new upside swing.
If selling pressure remains elevated and this primary MDZ fails, there is one more MDZ sitting near the bottom of the structure, which can serve as a secondary demand pocket where price may still reverse to the upside. Both these stacked demand zones offer attractive areas to watch for confirmation‑based long setups.
Weekly Timeframe Focus (Reversal Zones)
On the Weekly timeframe, there are four clearly defined reversal zones where price has a high probability of reacting due to visible supply‑demand imbalances and prior impulsive moves. These levels align well with the higher‑timeframe zones, making them high‑quality decision points.
Monitoring these four zones for clean price action signals such as strong rejection wicks, engulfing candles, or structure breaks can help time entries with precision while keeping risk tightly controlled. This multi‑timeframe stacking significantly increases the reliability of any confirmed reversal from these areas.
Conclusion: Long‑Term Investment View
Given the strong confluence of demand zones across Yearly, Half-Yearly, and lower timeframes, plus multiple well‑defined reversal levels on the Weekly chart, this stock is positioned for a potentially strong bullish reversal from current or slightly lower zones. Notably, after the reaction from this higher timeframe demand zone, there are no significant supply hurdles visible on higher timeframes, clearing the path for sustained upside momentum and substantially increasing the chances of higher returns.
From a long‑term investment perspective, the structure suggests a favorable reward‑to‑risk profile and scope for strong performance if price holds above the mapped HTF demand. If demand is confirmed and price starts building a higher‑low structure from these zones, this can evolve into a high‑conviction long‑term swing or investment candidate, supported by institutional‑grade demand footprints and multi‑timeframe alignment.
The Most Important Bitcoin Level of This Cycle — Don’t Miss It.Bitcoin is once again testing its multi-year rising support trendline, the same zone that has triggered every major rally since 2020. Price has repeatedly formed higher lows, showing that long-term buyers are still defending this structure.
What makes this zone special is the confluence:
A macro rising support trendline that has held for nearly 4 years.
A fresh institutional demand zone between 88k–92k.
Volume spike indicating renewed accumulation.
Rejection from macro rising resistance , resetting liquidity below.
This type of setup usually appears before expansion moves. As long as BTC holds above this macro support, the market continues to favor upside targets:
1st Target: 106,770 (conservative)
2nd Target: 124,250 (mid-term)
3rd Target: 135,800+ (macro breakout zone)
But here’s the key point:
A clean breakdown below the structure would delay the bullish cycle, until then, dips into the demand zone remain high-probability accumulation opportunities for long-term traders.
History rarely repeats perfectly…
but it often rhymes, and BTC is back at the same place where big moves begin.
Analysis By @TraderRahulPal | More analysis & educational content on my profile.
Disclaimer:
This analysis is for educational purposes only and is not financial advice. Markets can change quickly always manage risk, do your own research, and trade according to your plan.

ETH/USD – Trendline Breakout Attempt from Higher-Timeframe DemanETH/USD is reacting strongly from a major 4H demand zone after an extended downtrend. Price has tapped into a high-volume area between $2,760–$2,800, showing the first signs of bullish strength with a clean internal structure shift.
📌 Setup Overview
Price respected a long-term descending trendline, but buyers stepped in strongly at the higher-timeframe demand zone.
A short-term structure break (BOS) suggests a potential reversal beginning to form.
Market is now retesting the broken structure + mini demand zone, where buyers are likely to defend.
🎯 Trade Plan
Entry: After the retest confirmation of the minor demand zone.
Stop-loss: Below the demand area to protect against liquidity sweeps.
Target: The next major supply zone around $3,600, aligning with the larger structure and trendline interaction.
📈 Bias
Bullish short-term — expecting continuation to the upside if price holds above the retest zone.
Structure suggests a potential mid-term trend reversal if buyers maintain control.
❌ Invalidation
Idea becomes invalid if price closes below the demand zone and breaks structure to the downside.
UltraTech Cement: Bullish Setup at Major Demand ConfluenceWe are analyzing UltraTech Cement across multiple timeframes as it approaches a high-probability reversal area. Here is the breakdown:
1️⃣ Quarterly Timeframe (Location)
Status: Price is currently approaching a Quarterly Demand Zone.
View: We are treating this as a key "Location" for our trade setup. Since the price is correcting from its Lifetime High , this zone is significant enough to absorb incoming selling pressure and hold the price.
2️⃣ Monthly Timeframe (Trend Origin)
Status: Price is testing the Monthly Demand Zone.
Confluence: This zone perfectly coincides (overlaps) with the Quarterly Demand Zone.
Significance: This acts as a strong support because the massive rally that led to the previous Lifetime High originated right from this level.
3️⃣ Weekly Timeframe (The Setup)
Status: Price is approaching a refined Weekly Demand Zone.
Strength: This is a high-probability zone because it has triple confluence: it coincides with both the Monthly and Quarterly zones.
Support: There is also a Monthly EMA resting in this area, adding extra strength to the zone.
Outlook: If price enters this zone, we expect a strong upmove. There are no major higher-timeframe supply zones overhead to block the momentum.
🛡️ Plan B: The Safety Net
Secondary Zone: In the unlikely event that our primary weekly zone breaks, we are not out of the fight.
Fresh & Untested: Just below the current level, there is another fresh demand zone that has never been tested before.
Opportunity: Because it is "fresh," there are likely unfilled pending buy orders sitting there, ready to trigger a strong reaction and push prices back up.
🎯 Verdict: A solid long setup forming at a high-value location with momentum expected to resume toward highs.

Aditya Birla Capital – Demand Zone📌 Demand Zone:
Demand Zone High: 350.80
Demand Zone Low: 344.40
The stock has triggered a clean 52-week breakout supported by a sharp MACD crossover and strong expansion through the Bollinger bands, signaling fresh momentum entering the structure. The recent wide-range green candle reflects decisive buyer dominance, supported by improving volumes and a steady higher-low sequence that kept the broader trend intact even during consolidation. Momentum indicators such as RSI, CCI, and Stochastics all remain in strong territory, confirming that buyers are still in control despite the price being stretched in the short term. The small demand zone between 353.80–347.95 acts as the immediate retest pocket where institutional flows can re-enter if the stock pulls back. EMA compression has fully expanded, relative strength vs the index has turned positive, and overall the price structure indicates a momentum-driven continuation setup with a favourable trend, strong buying pressure, and stable risk levels as long as the stock holds above the newly formed demand zone.
________________________________________
⚠️ STWP Legal Disclaimer (SEBI-Compliant)
This document is strictly for educational and informational purposes. All examples, charts, levels, and option structures discussed are illustrative and are not intended as buy, sell, or hold recommendations. STWP does not provide investment advice, trading tips, signals, or personalized financial guidance of any kind, nor is it a SEBI-registered intermediary or research analyst. The analyses, illustrations, and risk–reward structures included here are generic in nature and based on publicly available data and observed market behaviour, which may change without notice. Financial markets involve significant risk; derivatives in particular carry the potential for substantial losses. Option premiums, implied volatility, open interest, delta, and other market variables can fluctuate rapidly and unpredictably.
Readers are solely responsible for their trading decisions, capital management, and risk assessment. Before making any investment or trading decision, please consult a SEBI-registered investment advisor. STWP, its representatives, and affiliates shall not be liable for any direct or indirect loss arising from the use of this material. Historical patterns or past market behaviour do not guarantee future outcomes. Nothing in this document should be interpreted as a promise of performance, accuracy, or returns.
Position Status: No active position in ABCAPITAL at the time of analysis.
Data Source: TradingView & NSE India (Past Chart Reference for any charts used).
________________________________________

FEDERALBNK - Demand Zone on the Rise📌 Demand Zone
Demand Zone High: 258.80
Demand Zone Low: 253.75
The stock has just broken into a fresh 52-week high with a powerful expansion candle, supported by bullish volume and strong relative strength against the index. Momentum indicators such as RSI, CCI, and Stochastics are all in the overbought zone, signalling a strong trend in motion but also hinting at the possibility of brief pullbacks as price cools off. The demand zone at 258.80–253.75 acts as the key institutional pocket where buyers previously absorbed supply, making it the most reliable retest area if price dips. OBV remains elevated, EMA bands are fully expanded, and the structure continues to show higher highs with controlled corrections, confirming that buyers remain firmly in command. Overall, the setup reflects a clean bullish continuation with a low-risk structure as long as the price holds above the newly formed demand zone.
________________________________________
⚠️ STWP Legal Disclaimer (SEBI-Compliant)
This document is strictly for educational and informational purposes. All examples, charts, levels, and option structures discussed are illustrative and are not intended as buy, sell, or hold recommendations. STWP does not provide investment advice, trading tips, signals, or personalized financial guidance of any kind, nor is it a SEBI-registered intermediary or research analyst. The analyses, illustrations, and risk–reward structures included here are generic in nature and based on publicly available data and observed market behaviour, which may change without notice. Financial markets involve significant risk; derivatives in particular carry the potential for substantial losses. Option premiums, implied volatility, open interest, delta, and other market variables can fluctuate rapidly and unpredictably.
Readers are solely responsible for their trading decisions, capital management, and risk assessment. Before making any investment or trading decision, please consult a SEBI-registered investment advisor. STWP, its representatives, and affiliates shall not be liable for any direct or indirect loss arising from the use of this material. Historical patterns or past market behaviour do not guarantee future outcomes. Nothing in this document should be interpreted as a promise of performance, accuracy, or returns.
Position Status: No active position in FEDERALBNK at the time of analysis.
Data Source: TradingView & NSE India (Past Chart Reference for any charts used).
________________________________________

GUN/USDT: Two Key Demand Zones for High-Probability Bounce (4H)The price action on the 4-hour chart shows that GUN has been moving within a clear descending channel, indicating a prolonged bearish trend. However, two deep-value demand zones have been identified, presenting high-probability swing long opportunities.Primary Demand Zone (Higher): The first purple zone, which has already been tapped or is very close to a tap, represents a strong unmitigated Order Block. This is the immediate trade opportunity targeting a move back towards the channel's upper boundary.Secondary Demand Zone (Lower): Should the primary zone fail, the lower, deeper purple box at $\sim\$0.0079$ represents a high-conviction "Last Line of Defense" demand area. This offers an excellent high-risk/high-reward entry if the price extends the drop.Trade Plan: We are looking for a reaction and consolidation within one of these two demand zones to target the upper trendline and potentially break out of the descending channel for a significant swing.

CERA – Demand Zone Confluence Supporting Bullish OutlookCERA has exhibited a notable price reaction from its Quarterly Demand Zone 📊, where price absorbed existing buy orders and initiated an upward movement 🚀. This reaction area coincides with the Yearly Demand Zone 🧭, thereby forming a strong confluence zone 🔗 that reinforces its structural significance.
On the Monthly timeframe 📅 , the active Demand Zone overlaps both the Monthly and Yearly Demand Zones . Such multi‑timeframe alignment ⚙️ typically represents a high‑probability support region 💪. Following the initial reaction from this area, price demonstrated a sustained upward move 📈 and established a new, untested Monthly Demand Zone 🟩.
Currently, the price is retracing toward this newly‑formed Monthly Demand Zone 🔄. The retracement is particularly significant because it occurs without any observable reaction from a higher‑timeframe supply zone 🚫🏗️. This suggests that the zone’s underlying demand remains intact 💼, and that the market is approaching an area of potential accumulation 🏦.
Additionally, the Weekly chart 📅 reveals that the current zone coincides with a Monthly Demand Zone 🧱, providing further confirmation of institutional-level support 🏛️. Overall, the technical setup indicates a favorable environment for a potential bullish reversal or continuation from this demand area 🔥📈.
📌 Conclusion
CERA is currently positioned within a multi‑layered structural support zone 🧱 that reflects strong institutional interest and demand alignment across timeframes. The fresh Monthly Demand Zone, combined with Yearly and Quarterly confluence, strengthens the bullish bias.
Unless price invalidates the zone through a sharp breakdown with high volume, the technical structure remains biased to the upside 🚀, favoring long accumulation setups and positioning this level as a potential launchpad for the next impulsive move 💫

AMBER at a Critical Turning Point – Trend Shift or Just a Bounce💹 Amber Enterprises Ltd (NSE: AMBER)
Sector: Consumer Durables | CMP: 7376 | View: Early Reversal Attempt Inside Downtrend Structure
Chart Pattern: NA
Candlestick Pattern: Bullish Engulfing
📊 Price Action – What’s Really Happening?
Amber finally showed signs of life after a sharp slide from 8600 levels.
Buyers stepped in near 7180–7200, creating a clean intraday reversal base.
But — the larger trend is still down, so this bounce must prove itself above 7480–7536.
🧭 Support & Resistance
Resistances: 7484 | 7536 | 7592 | 7785
Supports: 7183 | 7090 | 6990 | 6882
Demand zones are strong → resistance zones are layered and heavy.
This is why confirmation matters.
📈 STWP Trading Analysis:
Bullish Breakout: 7400 | Stop Loss: 7180
A clean bounce developed from the swing demand zone after strong absorption of selling pressure. Despite this intraday strength, the daily chart remains in a downtrend with lower highs and lower lows. A possible close above 7480–7535 could shift bias to short-term bullish continuation. Below 7180, weakness can reappear quickly.
🧩 Final STWP Outlook
Momentum: Mild |Trend: Bearish | Risk: Moderate | Volume: Improving
⚠️ Disclosure & Disclaimer – Please Read Carefully
This content is strictly for educational and informational purposes.
It is not a buy/sell recommendation and should not be treated as investment advice.
I am not a SEBI-registered investment adviser.
Markets carry risk, and price can move unpredictably.
Always evaluate your risk, position size, and suitability before trading.
Consult a SEBI-registered adviser before making any financial decision.
Position Status: No active STWP position in AMBER at the time of analysis.
Data Source: TradingView & Market Data Snapshot.
💬 Found this breakdown useful?
🔼 Boost this post to help more traders learn structured analysis
✍️ Comment your views or setups — let’s grow together
🔁 Share it with traders who want clean, disciplined analysis
👉 Follow @STWP for more structured trade setups, zone-based insights, and disciplined trading approach.
🚀 Stay Calm. Stay Clean. Trade With Patience.
Trade Smart | Learn Zones | Be Self-Reliant 📊
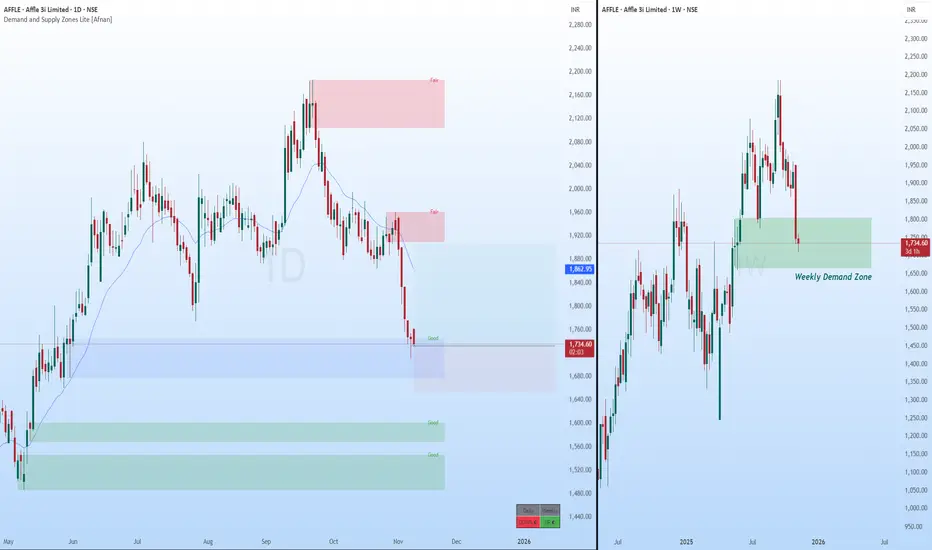
AFFLE - Demand Zone + Uptrend Intact = Perfect Storm for Bulls?Hey traders! I recently spotted something very interesting on the charts that could potentially signal a high-probability bullish setup. Let’s break it down in a simple yet professional way — so even if you’re new to price action, you’ll understand exactly what’s happening here.
📊 Multi–Timeframe Analysis Breakdown ⚡
Daily Timeframe Insight 🔍
Price is currently sitting inside a Daily Rally–Base–Rally (RBR) Demand Zone — and not just any zone, it’s a fresh, Good-quality demand zone . This means that institutional orders likely remain pending here, waiting for price to revisit.
Importantly, there’s no nearby supply zone until a 1:2 RR level, which gives the trade enough breathing space for a smooth upside move.
This zone also carries achievement strength, as it previously broke a supply zone and pushed price to a new all-time high (ATH) — a sign that big players were in control during that move.
Weekly Timeframe Context ⏳
Zooming out, the weekly trend is still bullish. We can clearly see price returning to a weekly demand zone that also has an achievement — it broke prior supply and established the recent ATH.
The retracement happening now is part of a healthy market structure — a pullback into institutional demand for re-accumulation before the next leg higher.
Even better, there’s no higher timeframe supply zone overhead, which means price is free to expand upward without major resistance.
🔥 What Does This Mean for Traders? 💡
Price is reacting from a Daily RBR Demand Zone aligned with Weekly Demand .
Trend Direction : Weekly trend is up, Daily structure supports a continuation.
Risk-Reward Outlook : Clean room till 1:2 RR, minimal supply interference.
Institutional Confluence : Both zones are achievement zones — confirming strong prior institutional participation.
Market Psychology : After creating new highs, the pullback likely represents smart money accumulation, not distribution.
🚦 Possible Trading Approach (Educational Perspective) 🧭
Entry Zone : Around the proximal line of Daily RBR demand
Stop-Loss : Just below the distal line of the demand zone
Target : 1:2 RR or next visible supply zone on the Daily timeframe
Trade Type : Set & Forget or Confirmation-based
This setup aligns perfectly with curve analysis principles, as price is trading low on the curve in an uptrend — a classic condition for demand-based entries.
💬 Final Thoughts 🚀
Trading is all about alignment — when trend, structure, and institutional footprints come together, the market often rewards patience.
“The best trades are born where patience meets preparation.”
Lastly, Thank you for your support, your likes & comments. Feel free to ask if you have questions. 💬
Stay focused, stay disciplined — and remember, every chart tells a story! 📊✨
📜 Disclaimer ⚠️
This analysis is purely for educational purposes only . It should not be considered as trading or investment advice . I am not a SEBI registered analyst .
Bullish Momentum Revival Near Key Support | STWP💹 Aurobindo Pharma Ltd (NSE: AUROPHARMA)
Sector: Pharmaceuticals | CMP: ₹1,138.90 | View: Bullish Momentum Setup
📊 Price Action:
Aurobindo Pharma shows strong bullish momentum after reclaiming key support zones near ₹1,100.
The stock has printed a bullish engulfing candle with institutional-grade volume, signaling a potential continuation of the uptrend.
Price action confirms demand absorption at lower levels with buyers defending the ₹1,080–1,100 zone effectively.
💼 HNI Trade Levels (STWP Setup):
Aggressive Entry: ₹1,138.90–₹1,155.80 | Stop Loss: ₹1,087.35
Low-Risk Entry: ₹1,137.12 | Stop Loss: ₹1,080.02
The STWP HNI Setup reflects a well-defined bullish structure supported by EMA 200 crossover and strong candle confirmation.
Smart money activity is visible through expanding volume footprints and VCP contraction signs fading toward breakout.
📉 VCP Analysis:
Aurobindo Pharma has undergone 112 VCP contractions, forming a tight base before breakout attempts.
Although the current candle is yet to confirm a clean VCP breakout, the setup suggests a pre-breakout stage, aligning with institutional interest.
The ongoing contraction phase combined with a bullish RSI breakout supports accumulation by strong hands.
📈 STWP Trading Analysis:
Entry: ₹1,155.80 | Stop Loss: ₹1,098.70 | Risk: ₹57.10
The bullish structure is reinforced by a 5x volume expansion and a strong buyer-dominated candle.
EMA 200 crossover, MACD bullish alignment, and RSI strength above 52 confirm upside bias.
Holding above ₹1,120 keeps the short-term structure firmly bullish toward ₹1,177–₹1,208 levels.
📏 Fibonacci Analysis:
From the swing low of ₹1,016.10 to the recent swing high of ₹1,208.20 — price currently hovers around the 61.8% retracement zone at ₹1,134.82, a critical Fibonacci pivot.
Sustaining above this level indicates strength and supports the ongoing uptrend.
Fibonacci extensions project targets near ₹1,208–₹1,218 on breakout confirmation.
🧭 STWP Support & Resistance:
Resistances: ₹1,163.13 | ₹1,187.37 | ₹1,218.93
Supports: ₹1,107.33 | ₹1,075.77 | ₹1,051.53
The ₹1,075–₹1,107 zone serves as a strong institutional support, aligning with prior demand clusters.
Weak resistance pockets lie between ₹1,163–₹1,208, opening space for a clean momentum push if price sustains above ₹1,155.
📊 STWP Volume & Technical Setup:
Today’s volume surged to 3.56M vs 1.3M average, confirming high institutional participation.
The chart highlights multiple technical confirmations — a strong EMA crossover, momentum breakout, and volatility expansion supported by a bullish candle formation.
Key momentum oscillators are turning upward, reflecting renewed strength and sustained bullish bias across timeframes.
🧩 STWP Summary View:
Final Outlook:
Momentum: Strong | Trend: Uptrend | Risk: High| Volume: High
Aurobindo Pharma is exhibiting robust institutional footprints with trend confirmation across all major indicators.
As long as the price holds above ₹1,107–₹1,120, the structure remains intact with scope for a short-term move toward ₹1,177–₹1,208.
The bias remains bullish with uptrend continuation potential into the next few sessions.
⚠️ Disclosure & Disclaimer – Please Read Carefully
This post is shared only for educational and informational purposes. It is not a buy/sell recommendation or financial advice.
I am not a SEBI-registered investment adviser; all views are based on technical observation and public market data.
Trading involves risk. Market movements can be unpredictable and may result in losses.
Always perform your own research or consult a SEBI-registered financial advisor before trading.
Position Status: No active position in (AUROPHARMA) at the time of this analysis.
Data Source: TradingView & NSE India
💬 Found this useful?
🔼 Give this post a Boost if you value structured, professional breakdowns.
✍️ Share your thoughts or charts below — let’s learn together!
🔁 Spread this post to help more traders adopt data-driven analysis.
👉 Follow for more clean, institutional-style setups with clarity and discipline.
🚀 Stay Calm. Stay Clean. Trade With Patience.
Trade Smart | Learn Zones | Be Self-Reliant 📊

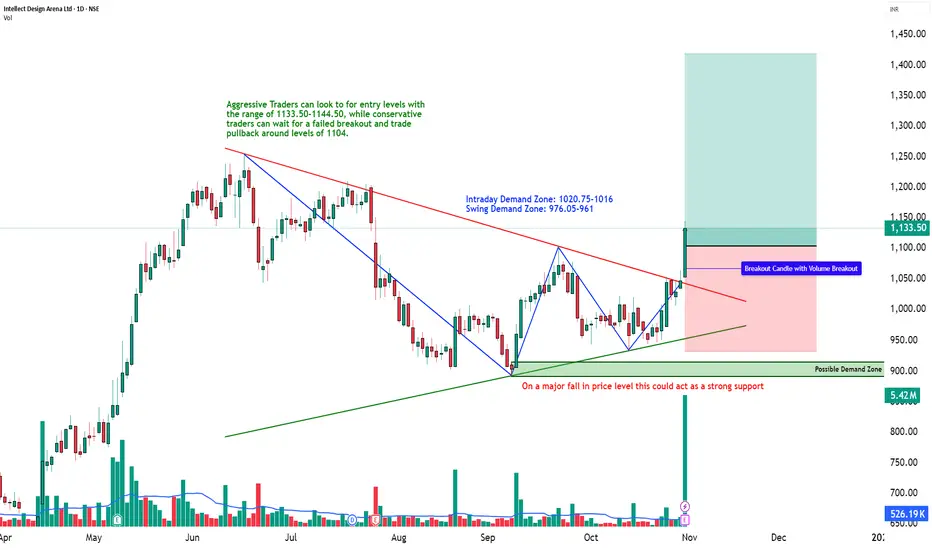
Descending Triangle Breakout with Institutional Volume | STWP💹 Intellect Design Arena Ltd (NSE: INTELLECT)
Sector: IT – FinTech Solutions | CMP: ₹1,133.50 | View: Bullish Momentum Breakout Setup
📊 Price Action:
Intellect Design Arena has delivered a strong bullish breakout from its multi-month descending trendline, marking a structural shift from a consolidation base to a clear uptrend.
The stock reversed sharply from the ₹890 swing low and confirmed momentum above the ₹1,100–₹1,120 zone with an explosive 10x volume expansion.
The wide-range bullish candle and sustained higher close suggest institutional breakout participation and trend continuation toward upper resistance zones.
💼 HNI Trade Levels (STWP Setup):
Aggressive Entry: ₹1,114.50 | Stop Loss: ₹1,044.35
Low-Risk Entry: ₹1,076.5 | Stop Loss: ₹1,019.5
HNI and institutional activity is visible through heavy delivery-based volume and strong follow-up momentum.
The bullish structure remains intact as long as price sustains above ₹1,075–₹1,080, where short-term demand has been confirmed.
📉 VCP Analysis:
Intellect displays a multi-stage Volatility Contraction Pattern (VCP) — 8 visible contractions as per the VCP dashboard.
Each contraction narrowed with decreasing volume before the final 20-day breakout candle confirmed a volatility expansion phase.
This marks the beginning of a trend acceleration stage, aligning perfectly with RSI, MACD, and Supertrend confirmations.
📈 STWP Trading Analysis:
Entry: ₹1,114.50 | Stop Loss: ₹1,044.35
The breakout candle exhibits strong momentum with 5.42M volume vs an average of 0.52M, indicating institutional footprints.
The price is now sustaining above short- and medium-term EMAs, with all major timeframes (Daily–Weekly–Monthly) confirming an uptrend alignment.
Holding above ₹1,095–₹1,075 will maintain the bullish bias, keeping momentum setups active toward ₹1,175–₹1,255 zones.
📏 Fibonacci Analysis:
From swing low ₹890.25 to swing high ₹1,255.0:
61.8% @ ₹1,115.7 → Confirmed breakout level.
78.6% @ ₹1,176.9 → Next momentum target.
100% @ ₹1,255.0 → Swing resistance.
A daily close above ₹1,116 validates the Fibonacci continuation path toward ₹1,255–₹1,285, with an extended potential to ₹1,354 (Fibo 127.2% projection).
🧭 STWP Support & Resistance:
Resistances: ₹1,167.5 | ₹1,201.5 | ₹1,255.0
Supports: ₹1,076.5 | ₹1,019.5 | ₹985.5
The ₹1,076–₹1,020 zone acts as a key accumulation pocket, while the ₹1,255 area marks a significant swing barrier.
Structure indicates strong base support with progressive higher demand, suggesting buyers remain dominant on dips.
📊 STWP Volume & Technical Setup:
Today’s session recorded 5.42M shares vs 0.52M average, a 10x volume surge, confirming institutional breakout participation.
Indicators show bullish MACD crossover, RSI momentum above 70, and Stochastic strength across all timeframes.
The breakout is also validated by Bollinger Band expansion, signaling volatility release.
Trend Direction: UPTREND | Volume Confirmation: Strong Institutional Activity
🧩 STWP Summary View:
Final Outlook:
Momentum: Strong | Trend: Bullish | Risk: High | Volume: High
Intellect Design Arena has transitioned into a confirmed bullish continuation phase with institutional footprints and multi-indicator confirmation.
Holding above ₹1,075 keeps the pattern valid for a potential rally toward ₹1,175–₹1,255 levels.
The setup remains technically clean, high-volume backed, and trend-aligned — favoring bullish bias continuation in the near term.
⚠️ Disclosure & Disclaimer – Please Read Carefully
The information shared here is meant purely for learning and awareness. It is not a buy or sell recommendation and should not be construed as investment advice.
I am not a SEBI-registered investment adviser, and this analysis is based on chart observations, technical patterns, and public data.
Trading involves risk; market movements can be sudden, and losses may exceed invested capital.
Past performance or setups do not guarantee future results.
Please evaluate your risk management and suitability before taking any trading decision.
Consult a SEBI-registered financial adviser before acting on any trade idea.
Position Status: No active position in (INTELLECT) at the time of analysis.
Data Source: TradingView & NSE India (Past Chart Reference).
💬 Found this useful?
🔼 Give this post a Boost to help more traders discover structured learning.
✍️ Drop your thoughts, queries, or setups in the comments — let’s grow together!
🔁 Share this with fellow traders and learners to promote structured analysis.
👉 “If you liked this breakdown, follow for more clean, disciplined setups with patience at the core.”
🚀 Stay Calm. Stay Clean. Trade With Patience.
Trade Smart | Learn Zones | Be Self-Reliant 📊
DABUR: Strong Demand Zones | Bullish Upside Setup📊 DABUR: Comprehensive Multi-Timeframe Demand-Supply Analysis
🎯 Executive Summary
This detailed analysis examines Dabur's price action across multiple timeframes using advanced demand-supply methodology. The stock demonstrates strong bullish momentum with multiple coinciding demand zones across higher timeframes, signaling potential for significant upward movement.
📅 Monthly Timeframe Analysis
Key Observations:
Strong Demand Zone Activation 💪
The monthly timeframe reveals that price has successfully picked up pending orders from a 1-month demand zone , triggering a powerful upward move. This demand zone represents institutional buying interest and forms the foundation of the current bullish structure.
Fresh Demand Zone Formation 📈
Following the initial order pickup, price has created a new 2 base candle monthly demand zone. The formation of fresh demand zones after respecting previous ones is a critical bullish signal that confirms:
Buyers maintain control of the stock
Momentum is building for continuation
The uptrend structure is solidifying
Current Month Response ✅
The current month's candle has reacted positively from this newly formed 2-base candle monthly demand zone, printing a green candle. This back-to-back demand zone respect pattern strongly suggests:
The stock has entered a confirmed uptrend
Price is preparing for a substantial upside move
Buyer dominance is firmly established
📊 Weekly Timeframe Analysis
Demand Zone Respect Pattern:
Consistent Zone Validation 🔄
The weekly timeframe mirrors the monthly bullish structure, with demand zones being consistently respected and price delivering upward moves from each zone. This repeated pattern across multiple weeks confirms the strength of the underlying demand.
Fresh Weekly Demand Zone 🆕
Currently, price is approaching a fresh weekly demand zone that has not been tested yet. Key characteristics:
Untested zones typically produce stronger reactions
Expected significant upward move from this level
High probability of continuation to higher levels
Back-to-Back Zone Formation 🏗️
The continuous formation of back-to-back demand zones, combined with price respecting and reacting from each zone with upward moves, clearly indicates:
Stock is preparing for a major upward leg
Accumulation phase is progressing systematically
Each pullback is being used for additional buying
📉 Daily Timeframe Analysis
Critical Confluence Zone:
Weekly-Daily Demand Zone Alignment 🎪
The daily timeframe shows price currently approaching a demand zone that coincides with the weekly demand zone . This creates a powerful confluence level with enhanced significance because:
Higher timeframe price structure taking precedence
Increased institutional interest at these levels
Multiple timeframe participants converging at the same price level
Maximum probability of reversal and upward continuation
Probability Assessment:
Bullish Factors ✨
✅ Back-to-back demand zone formation
✅ Consistent demand zone respect across timeframes
✅ Fresh weekly demand zone approaching
✅ Daily-Weekly demand zone coincidence
✅ Green candle formation on monthly chart
✅ Clear uptrend structure establishment
Expected Outcome 🚀
Based on the multi-timeframe demand-supply structure, Dabur is positioned for a substantial upward move. The alignment of demand zones across monthly, weekly, and daily timeframes, combined with consistent price respect and fresh zone formation, creates an exceptionally strong bullish setup with high probability of success.
📌 Conclusion
The demand-supply analysis across multiple timeframes reveals that Dabur has established a robust bullish structure with buyer dominance clearly visible. The coincidence of demand zones, back-to-back zone formation, and consistent price respect create a compelling case for s ignificant upside potential.
⚠️ IMPORTANT DISCLAIMER
Regulatory Compliance Notice
SEBI Compliance Statement:
In strict adherence to the latest Securities and Exchange Board of India (SEBI) guidelines, this content is NOT a trading recommendation, investment advice, or educational material. This publication serves informational purposes only.
Professional Disclaimer
Registration Status:
I am NOT a SEBI Registered Research Analyst (RA) nor a SEBI Registered Investment Adviser (RIA). This analysis does not constitute professional financial advice or recommendations as defined under SEBI regulations.
Risk Disclosure
Investment Advisory:
This analysis is provided solely for informational and reference purposes. Readers are strongly advised to:
Consult a SEBI-registered financial advisor or investment professional
Conduct comprehensive independent research
Perform thorough due diligence before making any investment decisions
Assess their own risk tolerance and financial situation
Liability Limitation:
The author assumes no responsibility for any financial losses, damages, or consequences arising from the use or interpretation of this information. All investment decisions remain the sole responsibility of the individual investor.
Market Risk:
Past performance and technical analysis do not guarantee future results. Markets are subject to inherent risks, volatility, and unpredictable factors.
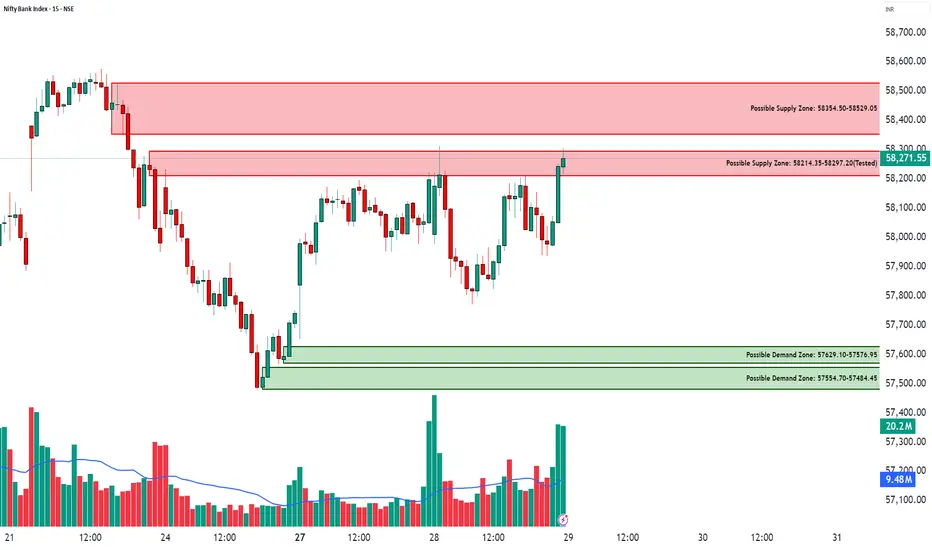
BANKNIFTY - Testing the Supply Zone After Strong Reversal📊 BANK NIFTY – Testing the Supply Zone After Strong Reversal ⚔️
Date: 28th Oct 2025
Spot Price: ₹58,271
🔹 Supports: 57,885 / 57,555 / 57,341
🔹 Resistances: 58,428 / 58,642 / 58,871
🔹 Intraday Demand Zones:
1️⃣ 57,629 – 57,576
2️⃣ 57,555 – 57,484
3️⃣ 57,341 – 57,300
🔹 Supply Zones:
1️⃣ 58,214 – 58,297 (Tested)
2️⃣ 58,354 – 58,529
🔑 Key Highlights
Bank Nifty rebounded strongly from multiple demand zones near 57,600 with a clear volume spike.
Price has now reached the tested supply zone around 58,214–58,297, where profit booking or short build-up could appear.
ATR Dashboard (STWP Edition) shows volatility expansion — suggesting the next move will likely be decisive.
The upper supply belt (58,350–58,530) remains a crucial resistance for trend confirmation.
🎯 STWP Trade View
Bank Nifty is currently trapped between strong demand below and supply overhead, indicating a range setup.
Keep a close watch on dips back into the 57,600–57,800 demand pocket — those zones remain key buyer territories.
If the index breaks and sustains above 58,530, expect a momentum push toward 58,870+.
Conversely, rejection from the current supply could bring a short-term pullback.
💡 Learning Note
When price revisits a tested supply zone after a strong recovery, volume behavior becomes the key —
Declining volume = exhaustion
Expanding volume = breakout potential
Observing this shift early helps traders position themselves smartly before the move unfolds.
Final Outlook:
Momentum: Recovering, but supply pressure visible | Trend: Range-bound between 57,600–8,500|Risk: Neutral within range; breakout may shift bias | Volume: High during reversal — watch behavior at supply
________________________________________
________________________________________
⚠️ Disclosure & Disclaimer – Please Read Carefully
The information shared here is meant purely for learning and awareness. It is not a buy or sell recommendation and should not be taken as investment advice. I am not a SEBI-registered investment adviser, and all views expressed are based on personal study, chart patterns, and publicly available market data.
Trading—whether in stocks or options—carries risk. Markets can move unexpectedly, and losses can sometimes exceed the money you have invested. Past performance or past setups do not guarantee future results.
If you are a beginner, treat this as a guide to understand how the market works and practice on paper trades before risking real money. If you are experienced, always assess your own risk, position sizing, and strategy suitability before entering trades.
Consult a SEBI-registered financial adviser before making any real trading decision. By engaging with this content, you acknowledge full responsibility for your trades and investments.
Position Status: No active position in BANKNIFTY at the time of analysis.
Data Source: TradingView & NSE India (Past Chart Reference) (Historical levels)
💬 Found this useful?
🔼 Give this post a Boost to help more traders discover clean, structured learning.
✍️ Drop your thoughts, questions, or setups in the comments — let’s grow together!
🔁 Share with fellow traders and beginners to spread awareness.
👉 “If you liked this breakdown, follow for more clean, structured setups with discipline at the core.”
🚀 Stay Calm. Stay Clean. Trade With Patience.
Trade Smart | Learn Zones | Be Self-Reliant 📊
NIFTY - Triple Demand Zone Rebound with Strong Volume📈 NIFTY 50 – Powerful Reversal from Triple Intraday Demand Zones 💪
Date: 28th Oct 2025
Spot Price: ₹25,936.20
🔹 Resistances: 26,048 / 26,160 / 26,280
🔹 Supports: 25,816 / 25,697 / 25,585
🔹 Intraday Demand Zones:
1️⃣ 25,868 – 25,814
2️⃣ 25,809 – 25,790
3️⃣ 25,763 – 25,737
🔑 Key Highlights
Nifty witnessed a strong reversal from a cluster of three intraday demand zones.
The 25,800 region attracted heavy buying interest with a sharp volume spike.
Volume expansion at the base confirms fresh long accumulation by strong hands.
Structure suggests short-term bottoming within a broader sideways band.
Resistance around 26,048–26,160 will be the next key test for bulls.
🎯 STWP Trade View
Nifty’s recovery from these demand zones indicates buyers regaining control near lower levels.
Keep a close watch on any dips back into the demand zones — such retracements often provide high-probability opportunities for short-term traders.
As long as price sustains above 25,800, the bias stays bullish toward 26,160–26,280.
💡 Learning Note
When multiple intraday demand zones align together, they create a layered liquidity base — an area where institutions quietly accumulate positions.
Volume confirmation near such zones gives early signs of strength beneath the surface.
Final Outlook:
Momentum: Bullish recovery in progress | Trend: Range-bound but firm bias upward | Risk: | Neutral above 25,800 | Volume: Expanding — confirming active participation
________________________________________
________________________________________
⚠️ Disclosure & Disclaimer – Please Read Carefully
The information shared here is meant purely for learning and awareness. It is not a buy or sell recommendation and should not be taken as investment advice. I am not a SEBI-registered investment adviser, and all views expressed are based on personal study, chart patterns, and publicly available market data.
Trading—whether in stocks or options—carries risk. Markets can move unexpectedly, and losses can sometimes exceed the money you have invested. Past performance or past setups do not guarantee future results.
If you are a beginner, treat this as a guide to understand how the market works and practice on paper trades before risking real money. If you are experienced, always assess your own risk, position sizing, and strategy suitability before entering trades.
Consult a SEBI-registered financial adviser before making any real trading decision. By engaging with this content, you acknowledge full responsibility for your trades and investments.
Position Status: No active position in NIFTY at the time of analysis.
Data Source: TradingView & NSE India (Past Chart Reference) (Historical levels)
💬 Found this useful?
🔼 Give this post a Boost to help more traders discover clean, structured learning.
✍️ Drop your thoughts, questions, or setups in the comments — let’s grow together!
🔁 Share with fellow traders and beginners to spread awareness.
👉 “If you liked this breakdown, follow for more clean, structured setups with discipline at the core.”
🚀 Stay Calm. Stay Clean. Trade With Patience.
Trade Smart | Learn Zones | Be Self-Reliant 📊

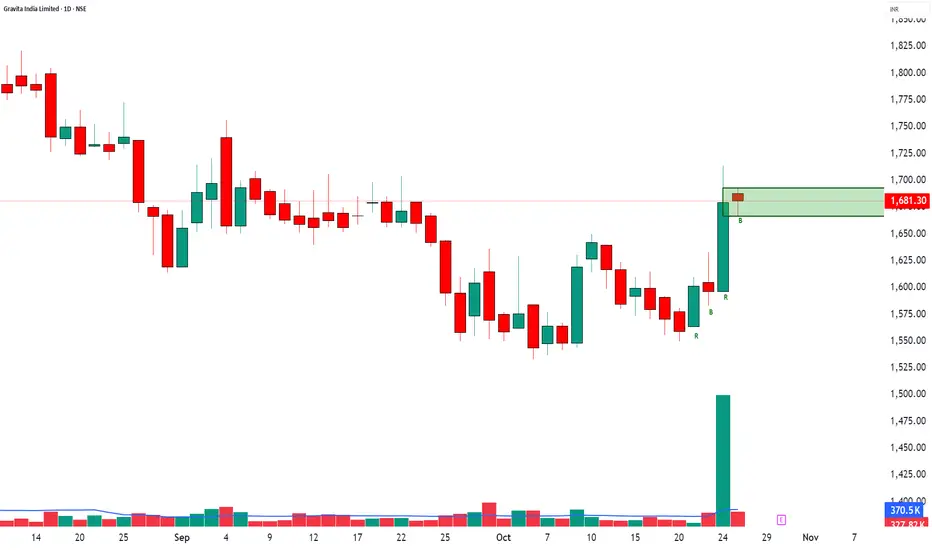
GRAVITA INDIA LTD – Strong Demand Zone📈 GRAVITA INDIA LTD – Strong Demand Zone at 1667–1692 🟢
🔹 Supports: 1668 / 1654 / 1642
🔹 Resistances: 1693 / 1705 / 1718
🔹 Swing Demand Zone: 1692–1667
🎯 STWP Trade View:
Gravita India is currently building strength near its new demand zone.
If the price holds above 1667, it can trigger a move toward 1715–1735 in the short term.
A retest near 1670–1665 with low volume will offer a favorable long entry opportunity.
💡 Learning Note:
Demand zones formed after large bullish candles with high volume often indicate institutional absorption.
Wait for price confirmation or retest to ensure strong continuation from the zone.
Final Outlook: Momentum: Building Up | Trend: Bullish Bias | Risk: Moderate | Volume: Extremely High
________________________________________
________________________________________
⚠️ Disclosure & Disclaimer – Please Read Carefully
The information shared here is meant purely for learning and awareness. It is not a buy or sell recommendation and should not be taken as investment advice. I am not a SEBI-registered investment adviser, and all views expressed are based on personal study, chart patterns, and publicly available market data.
Trading—whether in stocks or options—carries risk. Markets can move unexpectedly, and losses can sometimes exceed the money you have invested. Past performance or past setups do not guarantee future results.
If you are a beginner, treat this as a guide to understand how the market works and practice on paper trades before risking real money. If you are experienced, always assess your own risk, position sizing, and strategy suitability before entering trades.
Consult a SEBI-registered financial adviser before making any real trading decision. By engaging with this content, you acknowledge full responsibility for your trades and investments.
Position Status: No active position in GRAVITA at the time of analysis.
Data Source: TradingView & NSE India (Past Chart Reference) (Historical levels)
💬 Found this useful?
🔼 Give this post a Boost to help more traders discover clean, structured learning.
✍️ Drop your thoughts, questions, or setups in the comments — let’s grow together!
🔁 Share with fellow traders and beginners to spread awareness.
👉 “If you liked this breakdown, follow for more clean, structured setups with discipline at the core.”
🚀 Stay Calm. Stay Clean. Trade With Patience.
Trade Smart | Learn Zones | Be Self-Reliant 📊
THERMAX LTD – Possible Demand Zone📈 THERMAX LTD – Possible Demand Zone in The Making - A possible Rally Base Rally
🔹 Entry Zone: 3325
🔹 Supports: 3271 / 3228 / 3201
🔹 Resistances: 3341 / 3368 / 3411
🔹 Swing Demand Zone: 3325–3255
🎯 STWP Trade View:
Thermax is showing early signs of trend reversal from recent consolidation.
A sustained close above 3340 may open the way for possible further upside move, while dips toward 3280–3260 can offer buying opportunities.
💡 Learning Note:
When price revisits a previously strong demand zone with low volume and then bounces sharply — it often signals the presence of smart money. Watch how price behaves near zone retests before scaling up.
Final Outlook:
Momentum: Building | Trend: Early Bullish | Risk: Controlled | Volume: picking up
________________________________________
________________________________________
⚠️ Disclosure & Disclaimer – Please Read Carefully
The information shared here is meant purely for learning and awareness. It is not a buy or sell recommendation and should not be taken as investment advice. I am not a SEBI-registered investment adviser, and all views expressed are based on personal study, chart patterns, and publicly available market data.
Trading—whether in stocks or options—carries risk. Markets can move unexpectedly, and losses can sometimes exceed the money you have invested. Past performance or past setups do not guarantee future results.
If you are a beginner, treat this as a guide to understand how the market works and practice on paper trades before risking real money. If you are experienced, always assess your own risk, position sizing, and strategy suitability before entering trades.
Consult a SEBI-registered financial adviser before making any real trading decision. By engaging with this content, you acknowledge full responsibility for your trades and investments.
Position Status: No active position in THERMAX at the time of analysis.
Data Source: TradingView & NSE India (Past Chart Reference) (Historical levels)
💬 Found this useful?
🔼 Give this post a Boost to help more traders discover clean, structured learning.
✍️ Drop your thoughts, questions, or setups in the comments — let’s grow together!
🔁 Share with fellow traders and beginners to spread awareness.
👉 “If you liked this breakdown, follow for more clean, structured setups with discipline at the core.”
🚀 Stay Calm. Stay Clean. Trade With Patience.
Trade Smart | Learn Zones | Be Self-Reliant 📊
BANCOINDIA Testing Powerful Demand Zone + Breakout Retest 🧠 Understanding the Smart Money Footprints 🧠
Demand and supply zones are not just colorful boxes on a chart — they represent the footprints of smart money . When institutions buy, they don’t enter all their orders at once like retail traders do. Instead, they accumulate positions in parts — leaving behind a visible trail that we can identify on charts through price imbalances. These imbalances structures — form demand and supply zones .
When price returns to these zones, it’s essentially revisiting the footprints of big players — the levels where unfilled institutional orders might still exist.
In BANCOINDIA, we can clearly see this institutional footprint. The stock is now trading near a high-quality demand zone . The structure here is clean and powerful — a perfect Rally–Base–Rally (RBR) formation.
The leg-out candle that formed this demand zone had strong follow-through and even broke past the previous all-time high , confirming intense buying pressure. Now that price is revisiting this zone, it’s showing potential for a fresh upside move.
📉 Traditional Technical Lens 📉
Let’s now analyze BANCOINDIA through the classical technical perspective.
The stock had earlier broken a significant resistance level with massive bullish volume . That breakout confirmed strong demand participation. Now, price is retracing back toward that same level — which, according to the Law of Polarity , should act as new support.
Moreover, the 50 EMA is aligning beautifully beneath the price. The ongoing pullback is approaching both the EMA 50 and the previous resistance — a confluence that further strengthens the bullish bias.
If we observe the volume , we can see that the selling volume is drying up compared to the prior rally. This shows a lack of bearish momentum, increasing the probability of a bounce from current levels.
🎯 Confluence & Trading View 🎯
When we combine both lenses — Demand & Supply Zone Analysis and Traditional Technical Analysis — we find strong confluence:
The stock is sitting inside a powerful Rally–Base–Rally Demand Zone .
The previous resistance has now turned into support (Law of Polarity).
The 50 EMA is acting as an additional support layer.
Volume analysis shows selling pressure drying up.
Together, these signals suggest a high-probability reversal zone. If BANCOINDIA respects this area, we could see the next leg of rally begin soon.
However — as all seasoned traders know — no setup is 100% guaranteed. Risk management is your best friend. Always define your stop loss before thinking about your target. Even the strongest setups can fail, and protecting your capital must come first.
Identify your demand zone and entry level precisely.
Place your stop loss logically below the zone.
Aim for a 1:2 or 1:3 risk-to-reward ratio .
Let the market do the work — not emotions.
"In trading, patience and risk control build fortunes — not predictions."
Lastly, Thank you for your support, your likes & comments. Feel free to ask if you have questions. 🚀
📚 This analysis is purely for educational purposes and is not intended as a trading or investment recommendation. I am not a SEBI registered analyst.
