NAUKRI - Demand & Supply🎯 INFO EDGE INDIA LTD (NSE: NAUKRI)
Sector: Internet & IT Services | CMP: ₹1,384.00 | View: Range-Bound Near Supply
________________________________________
🟥 Possible Supply Zone
Zone: ₹1,380.60 – ₹1,391.50
Price is consolidating within this resistance pocket.
Sellers may defend this area, making it a critical short-term barrier.
A decisive breakout above ₹1,391.50 can unlock momentum toward ₹1,406 – ₹1,433.
________________________________________
🟩 Possible Demand Zone
Zone: ₹1,334.80 – ₹1,322.40
Strong accumulation zone where buyers previously took control.
Likely to act as a defensive base in case of a pullback.
Re-entry by buyers expected near this zone if tested again.
________________________________________
🔹 Key Levels
Resistance: 1406.73 / 1433.67 / 1475.83
Support: 1337.63 / 1295.47 / 1268.53
💡 STWP View (Educational Insight)
NAUKRI is currently resting near supply after a sharp rally.
Sustaining above ₹1,391.50 → likely continuation toward ₹1,406 – ₹1,433.
Pullback toward ₹1,334–₹1,322 → potential re-entry zone for fresh accumulation.
Breakdown below ₹1,322 → may weaken short-term structure and invite deeper correction.
🔍 Final Outlook
Momentum: Strong |Trend: Bullish |Risk: High| Volume: High
───────────────────────────────────────────────
⚠️ **DISCLOSURE & DISCLAIMER (SEBI-Compliant)**
───────────────────────────────────────────────
📘 **Purpose:**
This content is created **solely for educational and informational purposes** to help readers understand market structure, price action, and technical analysis.
It does **not constitute investment advice**, research recommendation, or a solicitation to buy or sell any security.
👤 **Author Disclosure:**
The author is **not a SEBI-registered investment adviser or research analyst.**
All chart studies, price levels, and observations are based on publicly available data (e.g., **NSE India**, **TradingView**) and are presented purely for **learning illustration**.
📊 **Position Status:**
No active position in * * at the time of publication.
“The author may sometimes trade in the securities discussed, but such trades are independent and shared here only for educational understanding.”
⚠️ **Risk Disclosure:**
Trading and investing involve financial risk. Market movements can be unpredictable, and losses may exceed invested capital.
Readers are strongly advised to consult a **SEBI-registered investment adviser** before making any trading or investment decisions.
🧠 **Responsibility Clause:**
By engaging with this post, you acknowledge that you are **solely responsible for your own trading or investment decisions**, and that this content is intended only for **market education and awareness**.
───────────────────────────────────────────────
💬 **Did You Find This Useful?**
If this analysis helped you understand price structure or market psychology better:
🔼 **Boost** to support transparent & structured financial education.
✍️ **Comment** your insights, observations, or questions — let’s learn together.
🔁 **Share** this post with learners and aspiring traders who value discipline.
📚 **Follow stwp** for more structured, educational breakdowns on stocks & setups.
🚀 *Stay Calm. Stay Clean. Trade With Patience.*
💡 *Trade Smart | Learn Zones | Be Self-Reliant.*
───────────────────────────────────────────────
Demand Zone

Gold sweeps SL, wait for BUY LIMIT at Demand Zone 4,223-4,225Timeframe analysis: H4/30M
Logic: Trend Continuation after liquidity sweep.
MARKET STRUCTURE ANALYSIS (SMC Analysis)
Main Trend: Bullish (Price is moving within a parallel channel).
Structure Confirmation (BOS): The chart has confirmed an upward Break of Structure (BOS), indicating that buyers are controlling the market.
Liquidity Sweep/Fake: The strong bearish candle (marked as "Fake") is a move to sweep Stop Losses of early buyers and gather liquidity before Smart Money pushes the price in the main direction. This is an Inducement action.
Key Demand Zone (POI/Demand Zone/Order Block): The TIMING BUY area (4,223.154 - 4,225.000) is a potential Demand Zone/Order Block identified by Smart Money. The price is expected to retest this area before continuing to rise.
MAIN TRADING SCENARIO (LONG SETUP)
SCENARIO: Wait for the price to Pullback to the POI area to enter a buy order, continuing the main bullish trend.
Parameter
Value
SMC Description
Action
BUY LIMIT
Place a pending buy order
Entry Zone (POI)
4,225.000 - 4,223.150
Demand Zone/Order Block after liquidity sweep.
Stop Loss (SL)
4,214.390
Place below the low of the liquidity sweep candle ("Fake Low"), ensuring safety.
Take Profit 1 (TP1)
4,240.000
Target the nearest Swing High.
Take Profit 2 (TP2)
4,250.000
Target psychological resistance and mid-channel.
Take Profit 3 (TP3)
4,260.000+
Target the upper boundary of the parallel channel.
R:R Ratio
Approximately 1:2.5 to 1:3.5 (Depending on TP)
Good R:R ratio for a trend-following trade.
RISK MANAGEMENT
Risk: Only risk a maximum of 1-2% of the account for this trade.
Breakeven: When the price hits TP1, move SL to the Entry point (Breakeven) to protect capital.
Invalidation: If the price closes the D1/H4 candle below the SL level (4,214.390), the buy plan will be invalidated.

GOKULAGRO – A Strong Demand Zone Meets Classic Breakout Retest 📈 Market Insights 📈
In the world of price action, every rally and pullback leaves behind clues — and supply and demand zones are among the most telling. These zones are the footprints of institutions — areas where large players once entered or exited positions, creating visible imbalances on the chart. When price revisits these zones, it often reacts sharply, as unfilled orders get triggered once again.
🧩 Supply & Demand View 🧩
In the case of GOKULAGRO , we’re witnessing this principle in action. After a powerful rally that pushed the stock to fresh all-time highs, the inevitable profit-booking wave stepped in — giving birth to a clean supply zone near the top. This is where sellers briefly took control, pausing the bullish momentum and cooling off the rally.
Now, what’s particularly interesting is where the price has landed. It’s currently hovering around a strong demand zone — not just any support level, but the very origin of the rally that broke previous resistance barriers and fueled the stock’s breakout run. These areas are historically loaded with pending buy orders, and a return to them often sparks a renewed upward reaction.
Demand Zone Strength: Located at the base of a prior impulse move, signaling prior institutional buying.
Price Reaction Potential: Sharp reversals often emerge from such zones as demand reactivates.
Buyer Interest Area: This zone marks where large players previously entered the market aggressively.
🚀 Classical Chart View 🚀
From a traditional technical standpoint, the broader structure also paints a bullish narrative. The stock recently broke through a significant resistance level — a level that had previously capped price for weeks. The breakout was accompanied by a notable volume surge , suggesting strong conviction behind the move.
What’s unfolding now is a textbook example of “resistance turning into support.” As price revisits this breakout zone, selling pressure has notably declined — reflected in a visible drop in volume during the pullback. This reduced activity indicates that sellers are losing steam, and the correction might simply be a healthy retest rather than a reversal.
Old Resistance → New Support: A classic structural shift confirming bullish continuation.
Volume Behavior: Declining sell volume during the pullback suggests waning bearish momentum.
Zone Confluence: The overlap of the demand zone with this retested level strengthens the bullish setup.
✨ Final Takeaway ✨
Both analytical lenses — supply and demand as well as classical technical — align seamlessly here. GOKULAGRO has already found footing at a high-quality demand zone , one that previously launched a major impulse move. If buyers step in again from this region, the stock could well be gearing up for its next leg higher .
For those observing this setup, keeping a protective stop-loss below ₹162.5 could provide a sensible cushion beneath structural support.
💡 Risk Management Reminder 💡
Even the cleanest patterns can fail — that’s the reality of trading. What separates consistent traders from the rest is discipline . Always size your positions wisely and respect your stop-loss.
“The art of trading is not about being right all the time, but about losing less when you are wrong.”
🔄 Patience, consistency, and emotional control often beat bold predictions in the long run.🔄
Lastly, thank you for your support, your likes & comments. Feel free to ask if you have questions.
⚡ Keep learning, keep analyzing — because every chart tells a story! ⚡
This analysis is purely for educational purposes and should not be considered as trading or investment advice. I am not a SEBI-registered analyst.

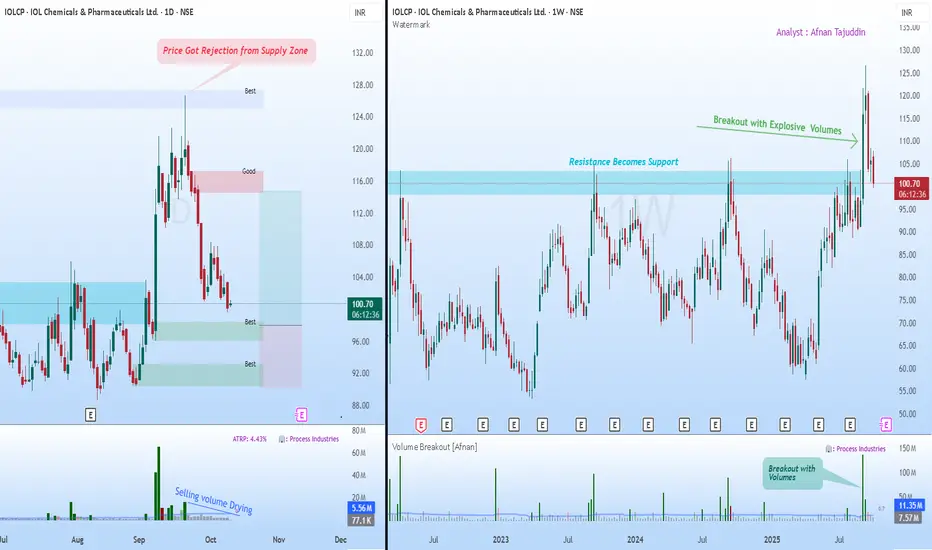
Supply & Demand Setup in IOLCP Could Signal Next Big Move📊 Supply & Demand View 📊
If you’ve been watching IOL Chemicals lately, you’ve probably noticed how cleanly it’s been respecting those key supply and demand structures. These zones aren’t random—they’re the visible fingerprints of institutions building or offloading positions in stages. When price revisits such levels, we often see sharp, almost surgical reactions.
Now, what’s catching my eye on the daily chart is the recent rejection from a supply zone. The pushback was clear, triggering a short-term decline. But here’s where it gets interesting: the selling volume has been steadily tapering off. That usually suggests the aggressive sellers are stepping aside, hinting that downside momentum could be losing steam.
Meanwhile, we’ve got multiple untested demand zones forming below—areas where buyers have shown conviction before. If price drifts into one of these regions again, I wouldn’t be surprised to see a fresh wave of institutional buying step in.
🚀 Breakout Retest View 🚀
Zooming out to the weekly chart tells a complementary story. After grinding under a major resistance for months, the stock finally broke through with explosive volume —the kind that only big money typically leaves behind. That breakout wasn’t just a blip; it reset the broader structure.
Now, the same resistance level has flipped into support—a textbook case of the law of polarity . As long as price continues to respect that zone, the larger trend remains firmly constructive.
What I find compelling is the combination of elements here: strong breakout volume, a healthy pullback, and structure alignment across timeframes. All signs point to this being a typical retest phase rather than a reversal.
✨ Final Takeaway ✨
Both charts are speaking the same language. The daily timeframe is hinting at exhaustion from sellers, while the weekly view reinforces the idea of a bullish continuation once demand reasserts itself. Should price stabilize around those lower demand zones, we could be looking at the next leg of the trend unfolding from there.
💡 Risk Management Reminder 💡
It’s easy to get carried away when the setup looks clean, but the market doesn’t owe certainty to anyone. Stick to your stop-loss, size your positions with care, and remember that discipline—more than any indicator—is what protects your capital.
“Charts reveal opportunities, but discipline secures profits.”
🔄 Stay patient, stay consistent — the market rewards preparation, not prediction. 🔄
This breakdown is shared purely for educational purposes and shouldn’t be taken as a trading or investment recommendation. I’m not a SEBI-registered analyst.
Demat Account Secrets in Trading —Every Traders Should KnowIntroduction
A Demat account is the digital locker for your shares and securities — the backbone of equity investing and trading in modern markets. But beyond opening an account and watching prices, there are plenty of practical, operational, and strategic “secrets” that experienced traders and long-term investors use to reduce costs, manage risks, and extract real value. This guide unpacks those lesser-known but high-impact insights: from choosing the right Depository Participant (DP) and optimizing charges, to advanced features like pledging, e-voting, corporate actions handling, fraud prevention, and tax implications. Whether you’re a frequent intraday trader, a swing trader, or a buy-and-hold investor, these tips will help you use your Demat account more intelligently.
1. Demat 101 — the fundamentals (so you can stop guessing)
A Demat (dematerialized) account holds securities in electronic format. In India, two depositories — NSDL and CDSL — maintain the records; brokers or banks act as Depository Participants (DPs) who provide the interface. When you buy shares, they land in your Demat account; when you sell, they are debited.
Key components:
DP (Depository Participant): Your broker/bank managing the Demat.
Client ID / Beneficiary Owner (BO) ID: Unique identifier for holdings.
ISIN: International Security Identification Number for each instrument.
Statement of Holdings (MSOH): Periodic summary of your holdings.
Understanding the basics helps avoid simple but costly mistakes, like missing corporate action deadlines or confusing a brokerage trading account fee with a DP demat charge.
2. Choosing the right DP — the biggest hidden lever for costs & convenience
Everyone talks about brokerage, but DP fees and service quality quietly shape net returns.
What to compare:
Account opening fees and annual maintenance charges (AMC) — DPs vary widely.
Transaction fees / custodian charges — per scrip or flat per transaction?
Pledge/unpledge fees — important if you use margin funding.
Speed & UI of the DP portal/app — corporate actions, e-voting, and statements are handled through the DP interface.
Customer service responsiveness — when issues arise (frozen shares, IPO refunds), fast support saves money.
Integration with your broker — some brokers offer bundled Demat+trading at lower cost.
Value-adds — auto-pay for corporate actions, consolidated statements, or tax reports.
A little fee shopping can save hundreds per year for active traders. If you trade frequently, prioritize low transaction/DVP (delivery versus payment) costs. If you hold long-term, low AMC and reliable corporate action handling matter more.
3. Know every charge — the micro-fees that add up
Demat-related costs are often small, but they compound.
Common fees:
Account opening fee
Annual maintenance charge (AMC)
Transaction charges (debited shares, off-market transfer)
Rematerialization fee (if you want physical certificates)
Pledge/unpledge fee
Dematerialization fee (converting physical to electronic)
Re-registration fee (if transferring DP)
Pro tip: Ask for a clear fee schedule before opening. Some DPs waive AMC for the first year or if you maintain a minimum balance.
4. Pledging shares — a secret weapon (and its pitfalls)
Pledging lets you use your Demat holdings as collateral for loans or margin from your broker or financial institution without selling them. This is a powerful tool but needs careful handling.
When to pledge:
To avoid selling for short-term margin calls.
To take loans against shares for diversification, emergency liquidity, or tax planning.
Risks & secrets:
Margin haircut: Lenders apply haircuts; volatile scrips get lower borrowing value.
Forced unpledge/sell: If the borrower (you or broker) defaults, the lender can liquidate.
Pledge charges & delays: Unpledging can take time; if markets move quickly you might not recover positions in time.
Keep pledged shares low proportion of total holdings to preserve flexibility.
Best practice: Use pledging conservatively and document the exact terms — interest, margin maintenance, and liquidation triggers.
5. Corporate actions — don’t let freebies slip away
Corporate actions include dividends, bonus shares, rights issues, stock splits, and buybacks. These affect your holdings and tax position.
Secrets:
Auto-execution settings: Some DPs auto-apply rights/renunciation choices; others require manual action. Know your DP’s default.
Track ex-dates and record dates: Missing a record date can mean missing a dividend or allocation.
Tax implications: Dividends and buybacks have different taxation; plan around holding periods to optimize capital gains tax.
Fractional shares from corporate actions may be paid out in cash — watch your account for small value credits.
Tip: Set calendar reminders for big corporate events for your core holdings.
6. Intraday trading & Demat — what traders often misunderstand
Many intraday traders think Demat doesn’t matter because intraday uses the trading account. But Demat still influences some things:
Delivery cycles: If you convert an intraday position to delivery, shares will land in your Demat only after settlement — check T+1/T+2 rules for the exchange.
Transaction vs delivery charges: No Demat debit for intraday (since shares aren’t delivered), but frequent delivery trades create more DP debits and costs.
Avoid unnecessary delivery: If you don’t intend to hold beyond the day, use intraday product to avoid DP transaction costs.
Secret: Using product/overnight margin vs MIS/Intraday modes changes margin requirements and whether shares actually hit your Demat account.
7. Security & fraud prevention — protect the locker
Scams target accounts everywhere. Protecting your Demat is non-negotiable.
Practical measures:
No POA unless necessary: Power of Attorney allows brokers to debit shares; while convenient, it’s a risk if given indiscriminately.
Two-factor authentication for broker/DPS portals.
Regularly reconcile your MSOH with transactions — report discrepancies immediately.
Keep KYC up to date — mismatches slow down corporate actions and transfers.
Beware phishing & SMS frauds: Never share OTPs, passwords, or UCCs.
Freeze facility: Many DPs offer "freeze" on holdings to prevent off-market transfer — useful if you detect suspicious activity.
Secret: If you must grant POA for ease of trading, limit it and use a reputable broker with transparent audit logs and insurance cover.
8. Reconciliation and statements — the daily routine of pros
Make it a habit:
Check daily trade reports and weekly Demat statements.
Match buy/sell confirmations with Demat credits/debits.
Track corporate action updates and small credits (fractional payouts, interest).
Why this matters: Small reconciliation catches — like a miscredited dividend or a failed transfer — can save disputes and losses later.
9. Off-market transfers & gifts — tax and legal subtleties
Off-market transfer (transfer of shares between Demat accounts without exchange) is common for gifts, family transfers, or private transactions.
Secrets:
Stamp duty & documentation: Gifts may require stamped transfer forms and declarations.
Gift taxation: In many jurisdictions, gifts from non-relatives have tax consequences. Document relationship and value.
Lock-in periods for ESOPs: Employee stock plans often have restrictions — off-market transfers may be blocked until vesting or expiry.
Always get the paperwork right to avoid future audits or blocked transfers.
10. IPO allotment & ASBA — how Demat helps get allocations
When you apply for IPOs, you must provide your Demat beneficiary ID. ASBA (Application Supported by Blocked Amount) ties refunds to the bank account, but Demat ensures shares — if allotted — are credited cleanly. Tip: Keep your Demat details updated and ensure PAN/DP mapping is correct to avoid allotment or transfer failures.
11. Taxation & reporting — your Demat is a tax record
Demat statements are primary source documents for capital gains calculations. Hidden advantages:
Broker consolidated statements often include trade-wise P&L and tax reports — use them for accurate filings.
Record holding periods precisely to differentiate between short-term and long-term rates.
Track cost basis across corporate actions — splits, bonus shares, and mergers alter cost per share; your DP statement and ISIN mapping help reconstruct basis.
Secret: Use consolidated transaction history from DP + broker to build an auditable trail for taxes.
12. Advanced tricks traders use (legitimately)
Scrip selection for pledge-margins: Keep a small basket of high-liquidity, low-volatility blue-chips for emergency pledges — they attract better haircuts.
Arbitrage of corporate actions: Professional traders sometimes buy before bonus/record dates to capture specific corporate actions, but account for ex-dates and tax impacts.
Fractional sell tactic: For small fractional leftover holdings after corporate actions, monitor for cash credits or plan an off-market consolidation to reduce micro-lots.
Caveat: All strategies must respect exchange rules and insider trading laws.
13. Common mistakes & how to avoid them
Giving POA to unknown brokers. Fix: Use limited POA or avoid if not necessary.
Ignoring AMC & small fees. Fix: Annual review of DP and renegotiate or switch.
Not tracking corporate action timelines. Fix: Subscribe to alerts and maintain a calendar.
Assuming all charges are the broker’s responsibility. Fix: Read fee schedule and keep records.
Failure to reconcile statements. Fix: Weekly reconciliation habit.
14. Switching DPs — the painless way
If you’re unhappy, transfer holdings using the Off-Market Transfer or Consolidation process. You’ll submit a DIS (Delivery Instruction Slip) at your current DP or use electronic transfer forms. Watch for transfer fees and timing — sometimes it’s cheaper to transfer slowly to avoid peak fees.
Secret: Coordinate transfer during low market activity to avoid missing corporate action deadlines.
15. Final checklist — your Demat hygiene
Know your DP’s fee schedule inside out.
Keep KYC & bank details updated and linked.
Avoid giving unrestricted POA; prefer limited authorizations.
Reconcile statements weekly.
Use pledge sparingly and understand haircut rules.
Track corporate action dates and tax implications.
Enable strong authentication and freeze options if suspicious activity occurs.
Use consolidated broker/DP tax reports at filing time.
Conclusion
A Demat account is more than a passive repository — it’s an operational hub for your market activity. Traders who master its mechanics and hidden levers (fee optimization, pledge use, corporate action handling, security practices) gain efficiency, reduce unexpected costs, and protect themselves from fraud. Whether you’re day-trading, swing trading, or building a long-term portfolio, treat your Demat account with the same discipline you apply to strategy and risk management. Small operational advantages compound over months and years — and often separate consistent winners from unlucky participants.
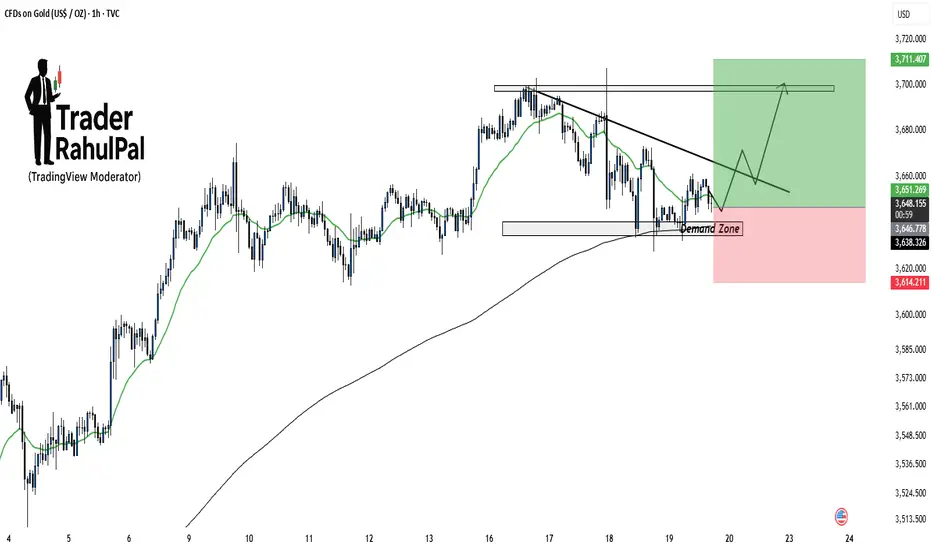
Gold Demand Zone Holding – Upside Potential Toward 3710!Gold is currently testing a demand zone around 3640–3650 , which aligns well with moving average support. As long as this zone holds, price action favors a potential bounce toward the falling trendline and eventually the key resistance area near 3710 . Short-term buyers may look for confirmation inside the demand zone before positioning, while a breakdown below 3614 would invalidate this setup.
Disclaimer: This analysis is for educational purposes only and should not be taken as financial advice. Please do your own research or consult your financial advisor before investing.
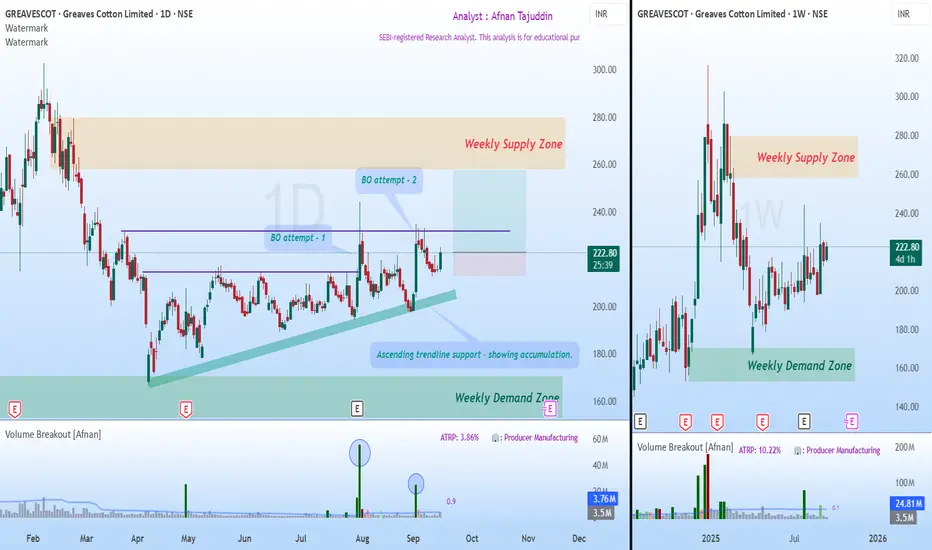
Accumulation and a Possible Breakout Towards Weekly Supply📈 Market Trend and Structure 📈
After forming an all-time high, price began its decline and developed a weekly supply zone . This supply zone now stands as the major target area for buyers.
Following the decline, price touched the weekly demand zone , which acted as a powerful reversal point . As supply-demand traders, this gave us a strong indication of the probable bottom.
From there, price recovered and moved into a phase of sideways consolidation , reflecting the tug of war between buyers and sellers.
⚡ Breakout Attempts and Trendline Support ⚡
During this consolidation, price attempted two breakouts with strong volumes . Both times, sellers stepped in aggressively at the horizontal resistance line.
Buyers, however, showed resilience by consistently defending an ascending trendline . This steady support is a sign of accumulation and growing demand.
Recently, price and volume contracted , forming an inside candle —a balance between buyers and sellers.
Today, this inside candle was broken to the upside, which could make this third breakout attempt successful.
🎯 Trading Plan 🎯
Bias: Bullish continuation.
Entry Trigger: Two previous breakout attempts + today’s breakout of the inside candle.
Target: Weekly supply zone.
Stop Loss: Below the previous swing low.
Risk-to-Reward: Approximately 1:3, a favorable setup.
✨ In Short : Sellers are still active near horizontal resistance, but buyers are showing greater strength at higher lows. The breakout of today’s inside candle tilts the balance towards buyers, making this the most promising pre-breakout setup so far.
🚀💡 “In trading, patience to wait and courage to act make all the difference.”
Lastly, Thank you for your support, your likes & comments. Feel free to ask if you have questions.
⚡ Stay disciplined, trade smart, and let the charts guide your story! 📊✨
This analysis is purely for educational purposes and is not intended as a trading or investment recommendation. I am not a SEBI registered Analyst.
STWP Breakout Watchlist – [14.09] | Key Stocks for Swing TradersSTWP Breakout Watchlist – | Key Stocks for Swing Traders 📊🚀
Markets are buzzing with momentum as multiple stocks show strong breakout signals backed by volumes and clean chart structures 🚀. Today’s watchlist highlights finance heavyweights and defence leaders that are attracting trader attention with fresh swing setups. Let’s decode the key levels, supports, and resistances to track for the coming sessions 🔑.
________________________________________________________________________________
________________________________________________________________________________
BAJFINANCE – 1003.25 (3.41%)
📊 Technical Indicators Explained
Bajaj Finance has given a powerful breakout 🚀 as it clears a long consolidation zone with a strong bullish Marubozu candle backed by heavy volume. The stock posted volumes almost 2 times its 20-day average, reflecting active trading and stronger-than-usual participation. Elevated volumes like this often support the sustainability of the underlying trend.
The chart highlights multiple bullish signals — strong momentum, a 52-week breakout, RSI breakout ⚡ confirming strength, and a Bollinger Band squeeze-off 📊 hinting at fresh volatility expansion. With VWAP support and intraday swing confirmation, the setup looks robust.
As long as key supports at 981 / 959 / 947 are protected, the stock can eye resistances at 1015 / 1026 / 1048 and possibly move towards higher upside levels of 1062 and 1120 in the coming sessions, with a possible demand zone at 975.90 – 965.60.
Bajaj Finance recently touched a 52-week high, driven by strong trading volumes (as per MarketWatch).
The company has set an ambitious goal to grow its loan book to ₹10 lakh crore by FY29, while also working on internal succession planning for senior leadership roles (as per Economic Times).
________________________________________
📈 Investment Outlook & Conclusion
📈 Bullish Case – Momentum with volume support may extend gains towards resistances.
📉 Bearish Case – Breach below 970 can attract selling pressure.
⚡ Momentum Case – Well-aligned for short swing trades.
📅 Perspective – Short-term momentum positive; long-term depends on loan book growth and asset quality.
________________________________________
📊 STWP Trade Analysis – BAJFINANCE
Bajaj Finance has given a strong breakout with momentum and volume confirmation 🚀
👉 For me, my entry zone is around 1004.60, aligned with the breakout structure considering 946.70 as my stop loss.
👉 If the stock dips towards 975.90 – 965.60 (Pullback zone), I will see that as a conservative re-entry with tighter risk.
🔑 Key Levels I’m Watching
Invalidation Level: A sustained move below 945 will negate my bullish view.
My Levels (if momentum continues): 1048 → 1062 → 1120
This is my swing trading approach as long as supports hold and is not a buy/sell recommendation.
________________________________________________________________________________
________________________________________________________________________________
BDL – 1566.50 (▲ +5.73%)
📊 Technical Indicators Explained
Bharat Dynamics (BDL) has delivered a strong breakout candle 🔥 after a prolonged downtrend, backed by extremely high volume 🚀. BDL stood out with an impressive 3.7x surge in volumes over its 20-day average, showcasing aggressive market involvement. Such strong accumulation signals heightened attention from traders and investors, often aligned with significant moves.
The chart highlights multiple bullish signals — RSI breakout, Bullish Engulfing candle, Buy Today Sell Tomorrow (BTST) setup, VWAP support, and SuperTrend reversal confirmation. The BB squeeze-off 📊 indicates a fresh trending move is likely to unfold.
As long as supports at 1506 / 1446 / 1410 are protected, and with a demand zone between 1513 – 1470, the stock looks well positioned to sustain momentum. On the upside, resistances are placed at 1602 / 1637 / 1697, with Fibonacci-based higher levels stretching to 1734 → 1886 → 2041 and beyond.
________________________________________
📰 Recent Updates
Institutional interest in BDL is rising, with the HDFC Defence Fund increasing its stake in the company along with other defence stocks (Economic Times).
BDL has also been highlighted among defence counters that recently surged up to 19%, supported by a strong order book and export prospects (Mint).
________________________________________
📈 Investment Outlook & Conclusion
📈 Bullish Case – Strong breakout with heavy volumes may extend towards higher resistances.
📉 Bearish Case – Slip below 1479 can open downside risk.
⚡ Momentum Case – High-risk, high-reward setup for aggressive short-term swings.
📅 Perspective – Short-term breakout play; long-term outlook tied to defence orders and exports.
________________________________________
📊 STWP Trade Analysis – BDL
Bharat Dynamics has delivered a breakout with volume confirmation and multiple bullish signals 🚀
👉 For me, my entry zone is around 1577, aligned with the breakout structure with my stop being at 1422.60
👉 If the stock dips towards the 1513 – 1470 demand zone, I will treat it as a conservative re-entry with tighter risk.
🔑 Key Levels I’m Watching
Invalidation Level: Invalidation level of below 1422 will negate my bullish view.
My Levels (if momentum continues): 1602 → 1637 → 1697 → 1734 → 1886 → 2041
This is my swing trading approach as long as supports hold and is not a buy/sell recommendation.
________________________________________________________________________________
________________________________________________________________________________
BAJAJFINSV – 2081.50 (▲ +2.14%)
📊 Technical Indicators Explained
Bajaj Finserv (BAJAJFINSV) has given a breakout candle with volume confirmation 🔥 after a long consolidation phase.
The stock displays strong signals — possible breakout setup, bullish engulfing candle, RSI breakout ⚡, swing trade confirmation, and Bollinger Band breakout 📊. The stock is also supported by VWAP demand and a BB squeeze-off, indicating potential for fresh momentum expansion. BAJAJFINSV recorded volumes about 1.8 times its recent 20-day average, suggesting above-normal market activity. This indicates healthy interest and participation, though the intensity is moderate compared to high-volume breakouts.
With strong supports at 2047 / 2013 / 1992, the stock looks well-positioned to sustain its move. On the upside, resistances are placed at 2102 / 2122 / 2156, with higher Fibonacci levels seen at 2135 → 2217 → 2236 if momentum holds.
________________________________________
📰 Recent Updates
Bajaj Finserv has set a target to achieve carbon neutrality for Scope 1 & 2 emissions by 2032, following a decarbonisation study in FY25 (Times of India).
In Q1 FY26, the company reported a 30.4% YoY rise in consolidated net profit to ₹2,789 crore, with revenues growing by ~12–13% (Economic Times).
________________________________________
📈 Investment Outlook & Conclusion
📈 Bullish Case – Gradual momentum with volume support could lift towards resistances.
📉 Bearish Case – A fall below 2032 can trigger near-term weakness.
⚡ Momentum Case – Suitable for cautious swing setups.
📅 Perspective – Short-term bias positive; long-term backed by financial services expansion.
________________________________________
📊 STWP Trade Analysis – BAJAJFINSV
Bajaj Finserv has delivered a breakout candle with momentum and above-average volume 🚀
👉 For me, my entry zone is around 2089, aligned with the breakout structure and a stop loss level of 2024.95.
👉 If the stock dips towards the level of 2041, I will treat it as a conservative re-entry with tighter risk.
🔑 Key Levels I’m Watching
Invalidation Level: A sustained move below 2012 will negate my bullish view.
My Levels (if momentum continues): 2102 → 2122 → 2156 → 2135 → 2217 → 2236
This is my swing trading approach as long as supports hold and is not a buy/sell recommendation.
________________________________________________________________________________
________________________________________________________________________________
HAL – 4745.60 (▼ –3.59%)
📊 Technical Indicators Explained
Hindustan Aeronautics (HAL) has given a breakout candle with strong volume confirmation 🚀 after a corrective downtrend. HAL witnessed trading volumes nearly 2.6x higher than its 20-day average, reflecting strong participation in the stock. Such elevated volumes often highlight rising institutional or retail activity, adding credibility to the ongoing price momentum.
The stock shows powerful bullish signals — Bullish Marubozu candle, RSI breakout ⚡, Bullish Engulfing setup, VWAP support, backed by a SuperTrend reversal and Bollinger Band breakout 📊. The BB squeeze-off suggests a potential trending move is just beginning.
With supports at 4634 / 4523 / 4465, the stock looks cushioned for momentum continuation. On the upside, immediate resistances lie at 4803 / 4861 / 4972, with higher Fibonacci-based levels stretching towards 5074 → 5399 → 5723 if momentum sustains. There is a possible demand zone around 4634 – 4544.30
________________________________________
📰 Recent Updates
HAL has received its third GE-404 engine from the US for the LCA Tejas Mark-1A programme, with a fourth expected later this month (Economic Times).
The company also signed a technology transfer agreement with IN-SPACe, ISRO, and NSIL for the Small Satellite Launch Vehicle (Economic Times).
HAL’s HJT-36 trainer jet is being evaluated for conversion into a light-attack fighter aircraft, with basic weapon trials already completed (Navbharat Times).
________________________________________
📈 Investment Outlook & Conclusion
📈 Bullish Case – Strong momentum with volume support may push towards higher resistances.
📉 Bearish Case – A drop below 4576 can attract downside pressure.
⚡ Momentum Case – Aligned with momentum; good for short-term swings.
📅 Perspective – Short-term breakout play; long-term supported by defence growth.
________________________________________
📊 STWP Trade Analysis – HAL
Hindustan Aeronautics has delivered a breakout candle with strong volume and momentum 🚀
👉 For me, my entry zone is around 4750, aligned with the breakout setup and my stop loss level at 4425.35.
👉 If the stock dips towards the 4634 – 4544.30, I will consider it as a conservative re-entry with tighter risk.
🔑 Key Levels I’m Watching
Invalidation Level: A sustained move below 4425 will negate my bullish view.
My Levels (if momentum continues): 4803 → 4861 → 4972 → 5074 → 5399 → 5723
This is my swing trading approach as long as supports hold and is not a buy/sell recommendation.
________________________________________________________________________________
________________________________________________________________________________
⚠️ Disclaimer – Please Read Carefully
The information shared here is meant purely for learning and awareness. It is not a buy or sell recommendation and should not be taken as investment advice. I am not a SEBI-registered investment advisor, and all views expressed are based on personal study, chart patterns, and publicly available market data.
Trading — whether in stocks or options — carries risk. Markets can move unexpectedly, and losses can sometimes exceed the money you have invested. Past performance or past setups do not guarantee future results.
If you are a beginner, treat this as a guide to understand how the market works — practice on paper trades before risking real money. If you are experienced, always assess your own risk, position sizing, and strategy suitability before entering trades.
Consult a SEBI-registered financial advisor before making any real trading decision. By engaging with this content, you acknowledge full responsibility for your trades and investments.
💬 Found this useful?
🔼 Give this post a Boost to help more traders discover clean, structured learning.
✍️ Drop your thoughts, questions, or setups in the comments — let’s grow together!
🔁 Share with fellow traders and beginners to spread awareness.
👉 “If you liked this breakdown, follow for more clean, structured setups with discipline at the core.”
🚀 Stay Calm. Stay Clean. Trade With Patience.
Trade Smart | Learn Zones | Be Self-Reliant 📊
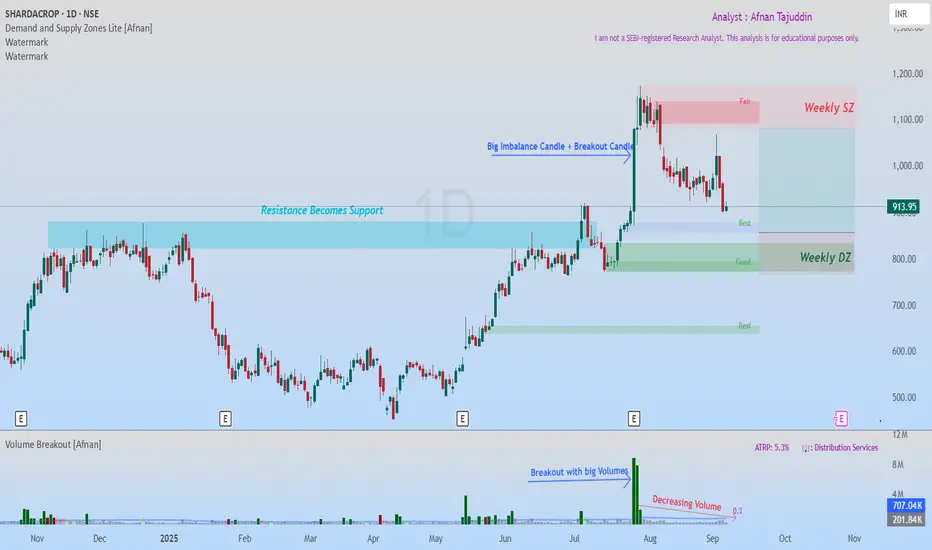
SHARDACROP: Smart Money Demand Zones Align with Classic BreakoutI've been tracking SHARDACROP, and what I'm seeing is honestly one of those setups that doesn't come around too often. There's something brewing here that caught my attention—and it's not just one signal, but two completely different analytical approaches pointing to the exact same conclusion.
Today, I'm breaking down this chart using the modern supply & demand approach that tracks institutional footprints, and the classic technical analysis. When these two methodologies start singing the same tune? That's when you know it's time to pay attention.
What makes this SHARDACROP setup special? Both methods are screaming the same message. And in my experience, that's usually when the big moves happen.
💡 Supply & Demand Analysis - Reading the Smart Money Trail 💡
Let's start with the supply and demand zones. Think of these as crime scenes—they're where the big players left their fingerprints. These aren't random levels; they're areas where massive institutional orders are sitting, waiting to be filled.
🎯 How the Big Players Play 🎯
Here's what most retail traders don't get: when institutions want to buy or sell millions of dollars worth of stock, they can't just hit the market buy button like we do. They'd move the price against themselves instantly. Instead, they layer in orders over time, creating these demand and supply zones.
So when price comes back to test a demand zone, we're betting that the same smart money players who were buying there before still have unfilled orders waiting. It's like they've set a trap—and price is walking right into it.
🔥 What Jumped Out at Me with SHARDACROP 🔥
Solid Weekly Foundation : There's a weekly demand zone that's been acting like a fortress
Stacked Daily Zones : Inside that weekly zone, we've got 1 daily demand zone and another demand zone is latest layered on top of each other.
Leg-out Candle Signature : That leg-out candle? Breaking to new highs, Pure smart money. The size of that imbalance tells me this wasn't retail traders getting excited
📈 The Setup That's Unfolding 📈
Now here's where it gets interesting. Price is drifting back toward our demand zone, and everything's lining up perfectly:
Entry Sweet Spot : Right within that established demand zone
Clean Risk Level : Stop goes below the zone—simple
Clear Target Path : Measured move up to the next supply zone
What I love about this risk-reward setup is the clean path to our 1:2.5 target. There's no major supply zone standing in our way, and the weekly trend is up.
⚡ Traditional Technical Analysis ⚡
Now let's flip the script and look at this through classic technical analysis. And you know what? The story gets even better.
🏗️ The Resistance That Finally Cracked 🏗️
This chart's telling a story I've seen a thousand times, but it never gets old:
The Struggle Phase : Price kept banging its head against the same resistance level, over and over
The Explosion : When it finally broke, it didn't just break—it demolished that level with a massive candle and huge volume
Volume Don't Lie : That breakout volume spike? That's confirmation the move was real
The Polarity Play : Now that old resistance is getting ready to flip into support—textbook price action
📊 Volume Tells the Real Story 📊
What really caught my eye is how volume's behaving on this pullback. As price drifts down toward our support zone, volume's drying up. That's not weakness—that's actually bullish. It means the selling pressure is fading, and when volume contracts like this during a retest, it often sets the stage for the next leg higher.
🎯 When Two Worlds Collide - The Confluence Magic 🎯
Here's where things get really exciting. I'm not just seeing one good setup—I'm seeing two completely different analytical methods pointing to the exact same opportunity:
Supply & Demand Says : Smart money demand zone with layered institutional support
Technical Analysis Says : Classic breakout retest with polarity support and volume confirmation
The Bottom Line : Both methods identify the same zone as the high-probability entry point
When this happens, I call it a "confluence setup." It's like having two different GPS systems both telling you to take the same route—you can be pretty confident you're heading in the right direction.
🌟 Putting It All Together 🌟
SHARDACROP's showing me: institutional footprints perfectly aligned with classic technical patterns. The Multiple Timeframe demand zones, the breakout retest setup, the volume behavior—it's all coming together in a way that makes me sit up and take notice.
But remember, even the best setups can fail. The market doesn't owe us anything, and it certainly doesn't care how confident we are. Trade smart, manage risk, and let the probabilities work in your favor over time.
💪 "The best traders aren't the ones who are right the most—they're the ones who make the most when they're right and lose the least when they're wrong." 📈
Disclaimer: This analysis is purely for educational purposes and isn't meant as trading or investment advice. I'm not a SEBI registered analyst. Always consult with qualified financial advisors before making investment decisions.
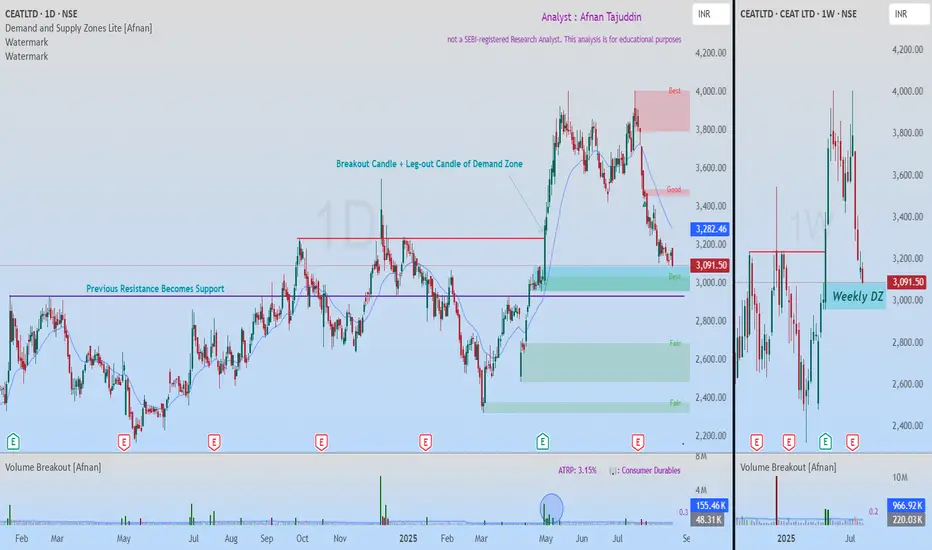
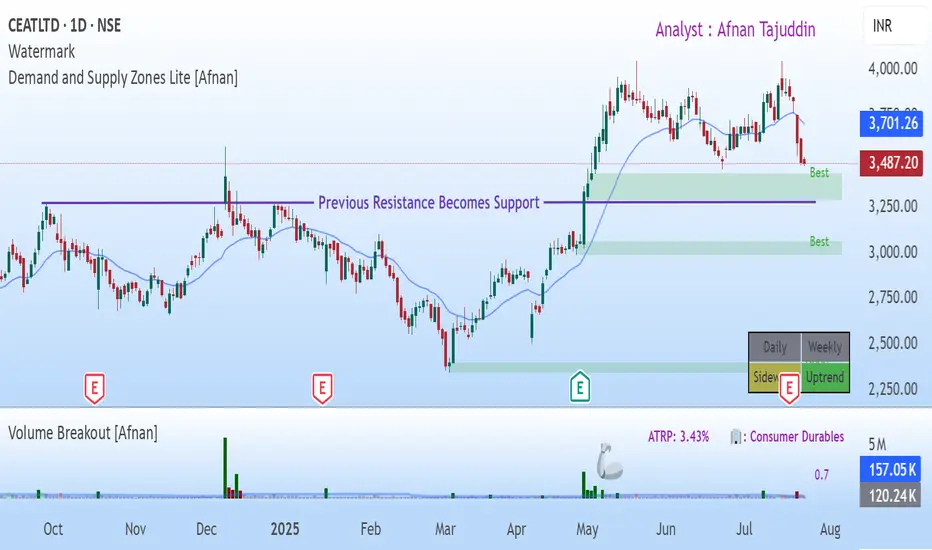
Smart Money Footprint Visible: Ceat Testing Powerful Demand ZoneBack on 24th July , I shared an idea on Ceat. That call didn’t play out and the Stop Loss (SL) got hit . No surprises there—SLs are simply the cost of doing business in this market. hitting SL is part of trading . The key is discipline – once SL is hit, we must exit without hesitation.
Now, Ceat seems to be offering us another opportunity . Let’s break it down.
📊 Why This Demand Zone Stands Out
The stock is approaching a very strong demand zone visible clearly on the weekly & Daily timeframe .
The leg-out candle that created this demand zone was powerful – it broke past previous resistance with a strong bullish move .
Follow-through from that breakout candle even took the stock to all-time highs . This tells us it’s not just an ordinary zone but one with institutional footprints.
Institutions often leave behind pending buy orders in such zones, or they may look to accumulate more here to defend their earlier positions.
This level first acted as resistance , then flipped into support —a classic price-action rotation.
📉 Volume Behavior 📉
On the breakout candle, volume was massive. But now, as price is pulling back, we can see volume exhaustion . To me, that signals a lack of real selling pressure. When supply dries up, it leaves the door open for demand to kick back in.
🔎 Confluences Adding Strength 🔎
Weekly demand zone lining up with a daily demand zone .
Traditional support level overlapping at the same price area.
Volume analysis confirming lack of strong selling.
🎯 Trading Plan 🎯
SL should be placed just below the support level to manage risk.
First target should be the nearest supply zone .
Till first target, the Risk-to-Reward (RR) ratio is about 1:3 , which makes it attractive.
If SL gets hit, simply exit the trade . No second thoughts.
What I find compelling here is the overlap: weekly demand, daily demand, and a long-tested support line all converging. That kind of alignment doesn’t come around every day. The probability of a bounce looks strong—but at the end of the day, risk management is what separates setups from disasters .
“Trading is not about being right every time. It’s about managing risk smartly and surviving long enough to catch the big moves.”
💡 The market will always offer another opportunity—our job is to stay disciplined, manage risk, and be ready when it comes. 🚀📈
⚠️ This analysis is purely for educational purposes only and is not a trading or investment recommendation . I am not a SEBI registered analyst .
Jindal Steel Breakout Study | Momentum, Volume & Key Levels📊 STWP Stock Analysis – JINDAL STEEL (3rd Sept 2025)
Price Action:
Jindal Steel surged to a CMP of ₹1028.35, marking an impressive +5.46% gain on the day. The stock is currently riding on strong momentum with a clear bullish crossover trend, signaling further upside potential. However, traders must remain cautious as the risk level is high, fueled by sharp price swings. What adds conviction to the move is the heavy volume participation, showing strong market interest and active participation by investors.
Volume & Participation
Jindal Steel witnessed a massive trading volume of 45.2 lakh shares today, almost 2x its 20-SMA average of 19.9 lakh shares (Volx: 1.98x ). This sharp surge in participation clearly highlights the presence of strong hands in action, adding weight to the bullish move and reinforcing market conviction.
Indicator Check
The indicators are painting a mixed yet insightful picture for Jindal Steel. The RSI at 61.1 shows strong momentum, while the CCI at 109 confirms a bullish bias. However, the MACD at -1.07 signals a slight bearish crossover, which needs monitoring. Meanwhile, the Stochastic at 98 suggests the stock is overbought, hinting at possible short-term profit booking. Importantly, prices remain above all key EMAs, reinforcing the broader bullish structure.
Key levels
Resistance: 1048/1067/1105
Support: 991/953/934
📰 Latest News Snapshot — JINDALSTEL
Jindal Steel & Power is making headlines on multiple fronts. In its Q1 FY26 results (Aug 12, 2025), the company delivered a strong turnaround with net profit at ₹1,494 crore, aided by a 32% QoQ jump in EBITDA and healthier margins at 24.4%, though revenues softened to about ₹12,294 crore. On the operational side, JSPL commissioned its first continuous galvanising line (CGL-1) at Angul, Odisha, enhancing its ability to supply value-added coated steel for automobiles, appliances, infrastructure, and construction — a big step in product diversification. Meanwhile, the market responded positively as the stock surged 4–5% on heavy volumes on September 3, 2025, also factoring in its recent ₹2/share final dividend declaration.
🧭 Sentiment Outlook & Investment Perspective
Jindal Steel & Power is showing a moderately positive outlook, backed by a strong turnaround in profitability with margins and EBITDA improving, while its new galvanising line at Angul adds valuable capacity in coated steel for autos, appliances, and infrastructure — a move that strengthens its long-term product mix and earnings potential. The recent surge in trading volumes and price action highlights strong market participation, which can attract further momentum buying in the near term. However, risks remain in the form of softer revenues, exposure to the cyclical swings of steel prices and exports, and the possibility of short-term corrections after sharp rallies. In the short term, volatility may stay elevated as the stock digests its recent gains, but in the long term, the focus on higher-margin products and disciplined capacity expansion positions the company constructively for sustainable growth — making it a stock to watch with cautious optimism.
🚀 Bullish Momentum
The stock is also riding on strong technical momentum, with a Bullish Marubozu candle and an Open = Low setup, both pointing to firm buying support. A Bollinger Band breakout following a BB squeeze indicates the potential for sharp price expansion. Adding to the momentum, an RSI breakout, combined with a powerful bullish candle structure, confirms the strength of the move. The setup even aligns with a possible Buy Today, Sell Tomorrow (BTST) opportunity, making the near-term trend look decisively bullish.
📊 STWP Trade Analysis – JINDAL STEEL
JINDAL STEEL is showing strong momentum supported by volume. I will consider my entry near ₹1030 as part of a breakout setup. If the stock dips closer to ₹1015, I will look at that as a more conservative entry with tighter risk, which suits my swing trading approach.
For me, the pullback level around ₹954.25 is an important support zone where buyers might re-enter, while the invalidation level near ₹910 would signal that my bullish view has failed. On the upside, I will be watching ₹1117 and ₹1205 as possible target zones if momentum continues. 🚀
⚠️ Disclaimer – Please Read Carefully
The information shared here is meant purely for learning and awareness. It is not a buy or sell recommendation and should not be taken as investment advice. I am not a SEBI-registered investment advisor, and all views expressed are based on personal study, chart patterns, and publicly available market data.
Trading — whether in stocks or options — carries risk. Markets can move unexpectedly, and losses can sometimes exceed the money you have invested. Past performance or past setups do not guarantee future results.
If you are a beginner, treat this as a guide to understand how the market works — practice on paper trades before risking real money. If you are experienced, always assess your own risk, position sizing, and strategy suitability before entering trades.
Consult a SEBI-registered financial advisor before making any real trading decision. By engaging with this content, you acknowledge full responsibility for your trades and investments.
💬 Found this useful?
🔼 Give this post a Boost to help more traders discover clean, structured learning.
✍️ Drop your thoughts, questions, or setups in the comments — let’s grow together!
🔁 Share with fellow traders and beginners to spread awareness.
👉 “If you liked this breakdown, follow for more clean, structured setups with discipline at the core.”
🚀 Stay Calm. Stay Clean. Trade With Patience.
Trade Smart | Learn Zones | Be Self-Reliant 📊

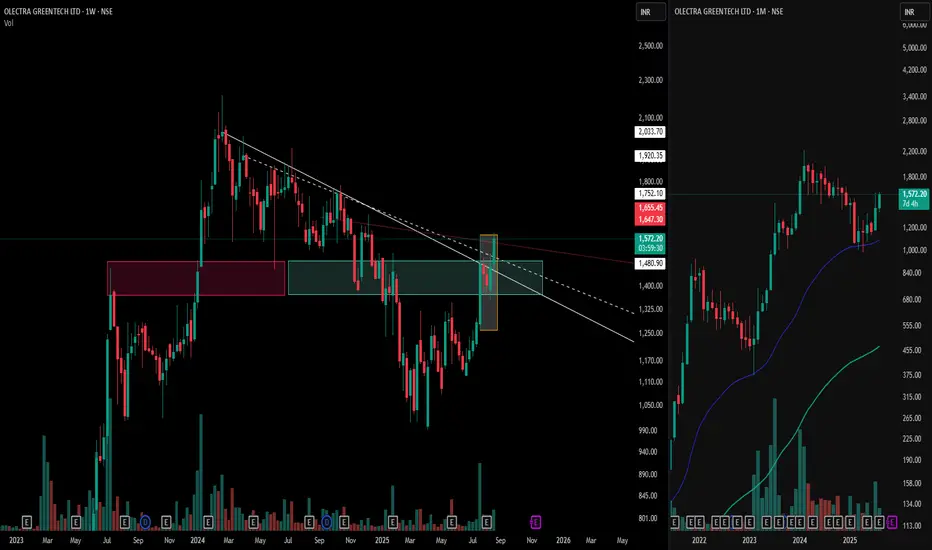
Olectra Greentech: Power of the Mother Candle & Zone Flip📊 White trendlines mark the crucial control trend and resistance levels.
🕯️ The bold Mother Candle (highlighted in the orange box) is marked .
💗 Notice the Pink Zone — formerly a tough resistance area — now flipped into strong support after the breakout, a classic supply-to-demand flip!
💎 The Cyan Box highlights an emerging demand zone, where buying interest gathers
⚡ Right side is a Representation of Market structure on the Biggest Time frame ( Monthly time frame ) showcasing a Higher high and Higher low formation and respecting the EMA plotted .
This is a stellar example of price structure and supply-demand dynamics in action—perfect study material for keen market observers.
⚠️ Disclaimer: This post is for educational and research purposes only. It does not constitute financial advice or a forecast. Always do your own analysis before making trading decisions.
From a correction to a potential impulse on Bitcoin.Bitcoin has corrected significantly after making all time highs and is not coming into a high probability Demand Zone on the higher time frames. I expect to see a potential bounce in Bitcoin from the marked Demand Zone on the chart

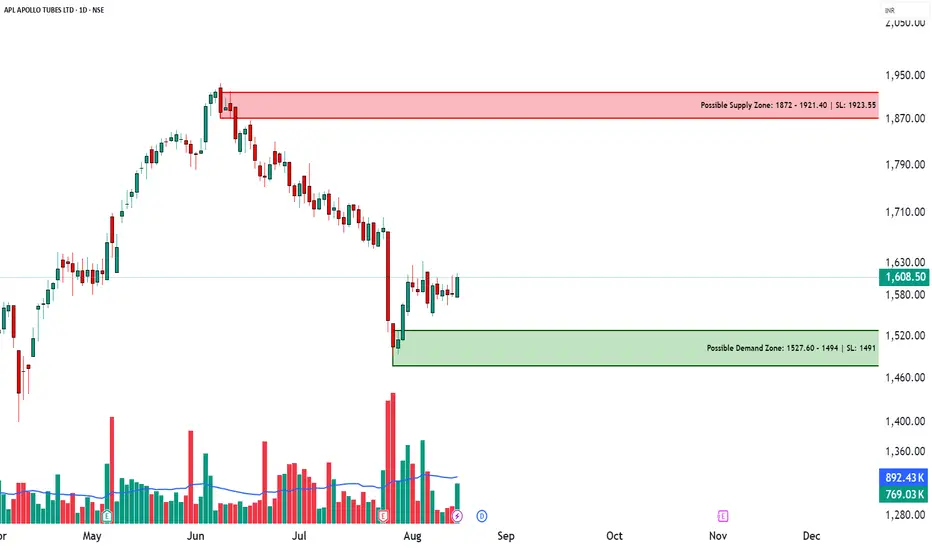
APLAPOLLO – Technical & Educational Snapshot📊 APLAPOLLO – Technical & Educational Snapshot
Timeframe: Daily / Weekly / Monthly
Overall Bias (for learning): ⭐⭐⭐⭐ Moderately Bullish – supply & demand zones identified, breakout study in progress
🔹 Candlestick Observations
Daily Bullish Piercing → Bullish Engulfing Buyers showing short-term strength
Weekly Three Black Crows → Bullish Engulfing Bearish pressure absorbed; case study of reversal attempt
Monthly NA No clear signal on higher timeframe
🔹 Supply & Demand Zones (Learning Reference)
Supply Zone (Resistance area): ₹1872 – ₹1921.40
(Stop Loss Ref: 1923.95 → possible invalidation if breached)
Demand Zone (Support area): ₹1494 – ₹1527.60
(Stop Loss Ref: 1491 → possible invalidation if broken)
🔹 Technical Observations
✅ Strong bullish candles forming
✅ Bullish Engulfing → buyer dominance visible
✅ Open = Low → intraday bullish bias illustration
✅ Double Wick → rejection from lower levels
✅ Breakout probability higher if weekly channel is cleared
📊 Volume Study
Any breakout is more reliable when supported by higher-than-average volume.
Traders typically wait for volume confirmation alongside bullish candlestick follow-through before validating a breakout.
📌 Summary (Learning View Only)
APLAPOLLO is a useful case study in demand-supply dynamics and bullish engulfing setups.
Lesson: Breakouts above consolidation + volume confirmation often strengthen trend continuation.
⚠️ Disclaimer (SEBI-Compliant)
This post is for educational & informational purposes only. It is not a buy/sell recommendation, not research, and not investment advice.
I am not a SEBI-registered advisor. Examples are for learning through chart patterns and public market data. Please consult a SEBI-registered financial advisor before making investment decisions.
💬 Found this useful?
🔼 Tap Boost so more traders can learn from structured analysis.
✍️ Share your views in the comments — let’s grow together.
✅ Follow @simpletradewithpatience for clean, zone-based setups & beginner-friendly market education.
🚀 Stay Calm. Stay Clean. Trade With Patience.
Trade Smart | Learn Zones | Be Self-Reliant 📊
Inside My Charts: A Trader’s PerspectiveI make educational content videos for swing / positional trading

KAYNES TECHNOLOGY IND LTD – Price Action + ZonesKAYNES TECHNOLOGY IND LTD – Price Action + Zones
Ticker: NSE:KAYNES | Sector: Electronics & Semiconductors
Timeframe: 15-Min | Current Price: ₹6,200.00 ▲ (+0.49%)
Technical View: ⭐⭐⭐⭐ | Chart Setup: Breakout with Zone-Based Trade Planning
Kaynes Technology (NSE:KAYNES) has exhibited strong directional momentum following a structured breakout above a prior consolidation range, as seen on the 15-minute chart. The price surged past intermediate resistance near ₹5,990 and is currently stabilizing around ₹6,200, suggesting trend continuation if supported by further volume. Marked zones like the Top Range (₹6,284) and Bottom Range (₹5,405) provide a visual framework to understand price behavior—where strength above upper resistance may invite bullish setups, while failure to hold could signal re-entry into the lower band. A clearly defined demand zone (₹5,850–₹5,764.50) with an example SL near ₹5,755 offers a contextual learning area to study zone-based entries with risk-reward alignment. Observing volume expansion on the breakout and contraction during consolidation is key for interpreting trend strength. The annotation “Trade as per Trend + Supporting Setup” reinforces the importance of directional bias and confluence. All observations are shared to help learners understand breakout structure, demand zones, and price-volume correlation in a real-world context.
⚠️ Disclaimer & Educational Note
This content is strictly intended for educational and research purposes related to the technical study of Kaynes Technology (NSE:KAYNES). I am not a SEBI-registered advisor, and no buy/sell recommendations are being made. All insights are based on personal chart analysis, price-action interpretation, and educational zone-mapping — not financial advice.
📘 The visual setup in this post demonstrates how traders and learners can study breakout structures, demand/supply zones, price-volume behavior, and risk levels in a controlled technical environment. Tools like support/resistance mapping, volume confirmation, and structure-based SL planning help illustrate disciplined trade preparation. However, trading — particularly in leveraged instruments like options or intraday setups — involves substantial risk, and losses can exceed the initial investment.
👉 Always do your own due diligence and consult a SEBI-registered investment advisor before taking any positions in the market.
👉 Practice strict risk management, and only trade with capital you can afford to lose.
The author assumes no responsibility for financial decisions based on this educational content. By engaging with this content, you acknowledge and accept these terms.
💬 Found this helpful?
Drop your thoughts, questions, or insights in the comments below ⬇️ — let’s learn together!
🔁 Share this post with your trading friends and community — help them discover clean charts, structured setups, and zone-based learning.
✅ Follow simpletradewithpatience for clear setups, educational content, and a no-nonsense approach to price action, supply-demand zones, and risk-managed trades.
🚀 Trade with patience. Trust your charts. Stay clear-headed.
Because the goal is not just to trade — it's to trade better.
Be Self-Reliant | Trade with Patience | Learn with Charts & Zones 📊

GODREJ CONSUMER PRODUCTS – Price Action + ZonesGODREJ CONSUMER PRODUCTS – Price Action + Zones
Ticker: NSE\:GODREJCP | Sector: FMCG
Timeframe: 15-Min | Current Price: ₹1,259.00 ▼ (−0.08%)
Technical View:⭐⭐⭐⭐ | Chart Setup: Range Bound Structure with Demand Zone Revisit in Focus
Godrej Consumer Products (NSE\:GODREJCP) is currently trading within a well-defined short-term range, with resistance capped near ₹1,265.50 and an anchored demand zone around ₹1,224.40–₹1,216.90. The stock has shown prior strength with a breakout above ₹1,244.35, but price is now consolidating between the orange mid-range and red supply zone, reflecting indecision. A clean zone-based structure is visible: the Top Range (₹1,265.50) may trigger bullish momentum if breached with volume, while failure to sustain may invite short setups within the range. The mid-structure zone (₹1,244.35) acts as a trend filter, while the green Demand Zone provides a case study for risk-managed entries — with example SL at ₹1,215.75 and mapped risk of ₹8.65. The Bottom Range (₹1,202.20) defines a lower band, and annotations like “Trade as per Trend + Supporting Setup” guide the learner to wait for trend + confluence. This setup is ideal for understanding how price reacts at key zones, how to frame directional bias within ranges, and how demand zones aid structured trade planning with logical stop-loss levels.
---
⚠️ **Disclaimer & Educational Note**
This content is strictly intended for educational and research purposes related to the technical study of Godrej Consumer Products (NSE\:GODREJCP). I am not a SEBI-registered advisor, and no buy/sell recommendations are being made. All insights are based on personal chart analysis, price-action interpretation, and educational zone-mapping — not financial advice.
📘 The visual setup in this post demonstrates how traders and learners can study breakout structures, demand/supply zones, price-volume behavior, and risk levels in a controlled technical environment. Tools like support/resistance mapping, volume confirmation, and structure-based SL planning help illustrate disciplined trade preparation. However, trading — particularly in leveraged instruments like options or intraday setups — involves substantial risk, and losses can exceed the initial investment.
👉 Always do your own due diligence and consult a SEBI-registered investment advisor before taking any positions in the market.
👉 Practice strict risk management, and only trade with capital you can afford to lose.
The author assumes no responsibility for financial decisions based on this educational content. By engaging with this content, you acknowledge and accept these terms.
---
💬 **Found this helpful?**
Drop your thoughts, questions, or insights in the comments below ⬇️ — let’s learn together!
🔁 Share this post with your trading friends and community — help them discover clean charts, structured setups, and zone-based learning.
✅ Follow **simpletradewithpatience** for clear setups, educational content, and a no-nonsense approach to price action, supply-demand zones, and risk-managed trades.
🚀 *Trade with patience. Trust your charts. Stay clear-headed.*
Because the goal is not just to trade — it's to trade better.
**Be Self-Reliant | Trade with Patience | Learn with Charts & Zones 📊**
---

GBPJPY GJ is continuing its decline and is approaching a key demand zone around 194.800, which previously initiated bullish order flow.
I’ll definitely be monitoring this area closely for potential buy setups, as I’m anticipating a possible retracement. As always, confirmation will come from observing the 15-minute structure—once that aligns, I’ll adapt accordingly.

Supply & Demand + Patterns: A Simple Yet Powerful Swing StrategyExplore how supply-demand zones interact with patterns to create high-probability setups. This session breaks down rallies, pullbacks, and a simple process to start building a reliable swing trading strategy . Clear, structured, and beginner-friendly.

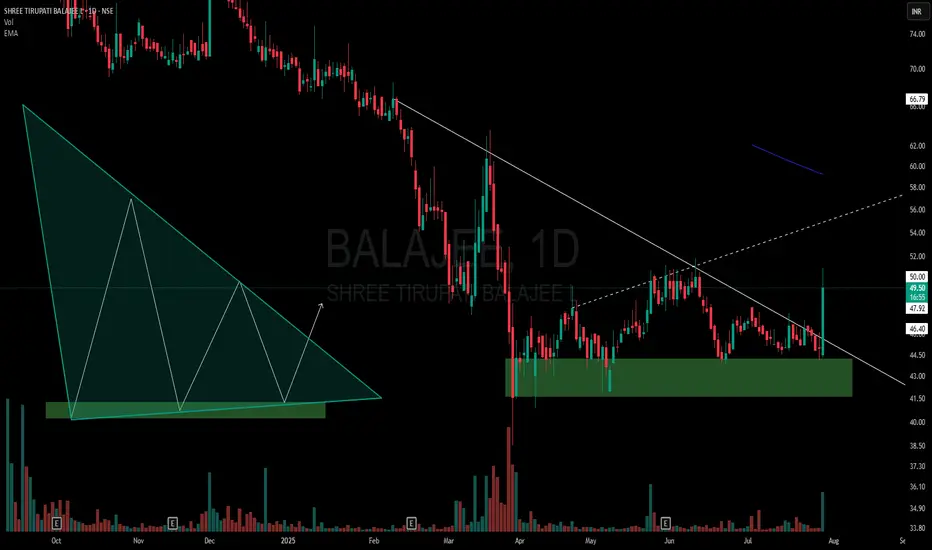
BALAJEE - Descending Triangle Meets Multi-Pattern ConfluenceOn the daily chart of Balajee, price action has formed a descending triangle right at the lower end of the trend:
🔻 Lower highs consistently pressuring horizontal support.
🟩 Price sitting within a clear demand zone, adding significance to the structure.
📊 Volume tapering off through consolidation, a classic triangle trait.
📐 Presence of a hidden counter-trend line (dotted) hinting at a potential broadening formation — showing a rare multi-pattern overlap.
Such setups are important not for predicting price, but for understanding how multiple structures can interact.
⚠️ Purely educational observation — no buy/sell advice.
CEAT Ltd: Is a Rebound on the Horizon? A Confluence of TechnicalTraders — let’s dig into CEAT Ltd NSE:CEATLTD . where both demand-supply dynamics and classic technical signals are flashing something worth watching. What’s setting up here isn’t just noise — there’s real structure underneath the surface.
Demand Zone & Institutional Footprints
Let’s start with the core of this setup: the Demand Zone. CEAT’s price is inching toward a daily timeframe Rally-Base-Rally zone — and not just any zone, but one that stands out in terms of quality.
Why does this matter? Because these aren’t retail-driven bounces. These are often the hidden footprints of institutions quietly building positions.
On June 23rd, price came close to this very demand zone — and without even touching it, we saw a sharp bounce. That’s a strong tell. There’s clear demand waiting just below.
Institutions don’t throw their entire order book at the market in one go. They scale in. So when price comes back to this area, it’s likely to trigger those leftover buy orders — potentially leading to another move higher.
Zooming out to the broader view : Both weekly and monthly charts are still in an uptrend. There are no obvious supply zones on the higher timeframes That clears the runway for bullish continuation.
💡 Traditional Technical Analysis Perspective 💡
Now let’s switch gears for a moment and take a look through the lens of classic technical analysis. What’s the chart telling us in plain sight?
CEAT spent months coiling within a consolidation range — nothing impulsive, just sideways chop.
But that changed on April 30th with a decisive breakout. And this wasn’t on light volume — it came with strong participation, a real sign of conviction.
Post-breakout, we’ve seen consistent volume buildup alongside price progression. This isn’t a one-day wonder — it’s been developing.
Act of Polarity at Work: The breakout level had previously acted as firm resistance multiple times. Now that price is retesting it from above, it’s doing exactly what we expect — flipping that resistance into potential support.
Interestingly, this retracement is happening on declining volume. That’s key. It often suggests a healthy retest rather than a breakdown — a potential “buy the dip” scenario, if you will.
🤝 The Confluence: Where Two Worlds Meet 🤝
Here’s where things get really compelling — that demand zone we highlighted? It aligns perfectly with the same level that’s being retested post-breakout. That overlap — this confluence — is no coincidence.
It dramatically increases the odds of a strong bounce, because we’re getting validation from two independent analytical frameworks. When price, psychology, and institutional footprints all point to the same zone — you pay attention.
We could consider a tactical Stop Loss just below the demand zone. And in terms of upside? The previous swing high near ₹4000 stands out as a logical first target.
"Success in trading is a marathon, not a sprint. Consistency, discipline, and effective risk management are your true North Stars."
Stay sharp. Even the cleanest setup can fail — and that’s why managing risk isn’t optional. If price violates the zone and closes below your SL, step out without hesitation.
Thanks for reading — your support, feedback, and questions always help drive this community forward. Let’s keep sharpening our edge together.
🚀 Trade smart, stay disciplined, and let your journey be one of continuous learning! 🚀
Disclaimer: This analysis is intended purely for educational purposes. It does not constitute investment advice or a trading recommendation. I am not a SEBI-registered advisor.
Demand & Supply Price Action Play – CMSINFO Price Structure & Market Context
CMSINFO’s recent price action has followed a textbook path, respecting clean structural levels driven by institutional order flow. It's one of those charts where the zones aren’t just technical—they're telling a story. And right now, that story is setting up a potentially meaningful long opportunity.
💡 Daily Timeframe – Big Picture Bias
The daily chart remains resolutely bullish . We're still seeing that healthy rhythm of higher highs and higher lows , signaling that the uptrend is very much intact.
📍 Daily Supply Zone: ₹540 – ₹546
That said, price did face some resistance recently—right where we’d expect it to. A fresh supply zone Rally Base Drop around ₹540–₹546 served up a rejection and sparked the current pullback. Nothing unusual there. In fact, in strong trends, these kinds of pullbacks often offer the best risk-adjusted entries —as long as we’re positioned at the right zones.
⏱️ 125-Minute Timeframe – Precision Entry Layer
Zooming into the 125-minute chart gives us a much clearer map for potential execution.
🟢 Demand Zone: Rally Base Rally ₹500 – ₹498
Here’s where things get interesting. This demand zone hasn’t been touched since it formed—making it a fresh zone , and by definition, high-probability for a first bounce. Price has just tapped into it, which could attract short-term buyers looking to ride the next leg up.
🔴 Supply Zone: Rally Base Drop ₹532 – ₹537
This zone sits just overhead and marks the first potential resistance . If price moves up from the current demand area, this is where traders may begin trimming positions or tightening stops.
🎯 Trade Blueprint 🎯
Entry: Between ₹500 – ₹498 (inside 125-minute demand zone)
Stop Loss: Below ₹498 (conservative buffer: ₹495)
Target 1: ₹532 – ₹537 (nearest 125min supply)
🧩 Why This Setup Deserves Attention 🧩
Daily Trend Structure Remains Bullish – higher timeframe bias supports a continuation upward.
Fresh LTF Demand Zone – first touch makes this zone statistically favorable.
Defined Risk-Reward Parameters – tight stop with layered targets for flexible management.
Pure Price Action Logic – just clean, institutional footprints.
🚀 “Opportunities don’t come from chasing— they come from waiting in the right places.” 💡 Stay patient, respect your zones, and let the market come to you.
This analysis is purely for educational purposes and does not constitute a trading or investment recommendation. I am not a SEBI registered analyst.
Lastly, thank you for your support, your likes & comments. Feel free to ask if you have questions.

KIRLOSBROS – A Demand-Supply Sweet Spot? My Take!🔍 What Got My Attention
We’re seeing price approach a well-formed Rally-Base-Rally demand zone, and to me, it’s got the fingerprint of institutional activity written all over it. These zones don’t just appear randomly—this kind of structure often suggests that big players may have unfinished business here, footprint of pending orders.
📐 The Demand-Supply View
Price is entering a daily demand zone —a clean RBR structure .
Just yesterday, we saw a bullish reaction candle form right off that zone. For a demand-supply trader, that’s confirmation—plain and simple.
Stop-loss placement? : just below the demand zone. And the logical target? The next known supply zone on the chart.
What’s more, the weekly chart already confirmed strength. Price bounced from weekly demand zone and powered through a traditional daily resistance—clear signs of momentum shift.
Encouragingly, there's no higher-timeframe supply standing in the way. That clears the runway.
From a demand-supply lens, this is the kind of setup we wait for—strong zone, confirmation signal, no conflicting zones above. It’s not about chasing; it’s about reacting when price comes to us.
📈 What Traditional Technical Are Saying 📈
Now, if we set aside the supply-demand lens for a moment and look at it through a more traditional view, things still line up nicely.
stock was clearly in a downtrend earlier—but that changed when it hit the weekly demand zone or say support area and reversed with strength.
What followed was a period of consolidation. That’s normal—markets pause before deciding on direction.
Then, on June 25th, the trend shifted. Price broke out above both horizontal resistance and a sloping downtrend line— and it did so with volume.
This wasn’t a fake breakout either. Price held above the resistance.
The current pullback? Honestly, it's healthy. After a move up, a dip into support (especially when it lines up with demand) often builds the base for the next leg higher.
And guess what—price is taking support from 20 EMA, which just adds to the confluence.
So even if you’re not a die-hard supply-demand trader, the technicals are telling a similar story: breakout, volume, support holding, pullback into structure—it all points toward potential continuation.
🧠 Why This Setup Stands Out 🧠
What I find compelling here is the alignment across both schools of thought which is not necessary but whether you're supply demand trader or tracking breakouts, both giving positive signal.
It's the kind of scenario where you don’t need to overcomplicate things. You’ve got:
Structure that makes sense.
Clear reaction at a proven level.
No HTF supply zone to kill the momentum.
Now, does that mean it's guaranteed to rip higher? Of course not. But when technical logics all align—this is where probability starts leaning in your favor.
🚀 Fuel for Your Trading Mindset 🚀
"You don’t need to catch every move. You just need to position yourself where risk is small and the story makes sense. 🎯"
📌 Disclaimer 📌
This analysis is shared strictly for educational purposes . It is not a recommendation to buy or sell any security. I am not a SEBI registered analyst .
Lastly, thank you for your support, your likes & comments. Feel free to ask if you have questions.
