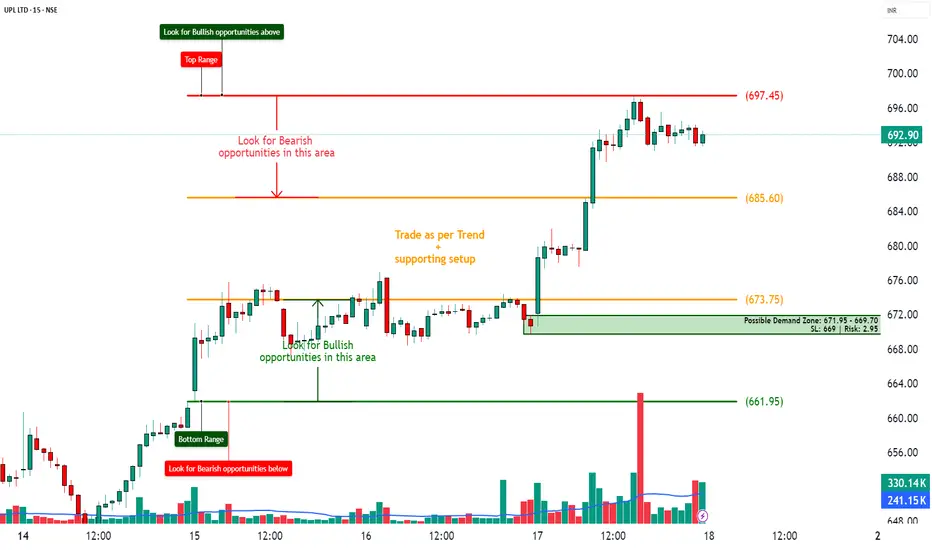
UPL – Demand Zone Based Trade Setup________________________________________________________________________________📈 UPL – Demand Zone Based Trade Setup
🕒 Chart Type: 15-Min | 🗓 Date: 17th July 2025
🔍 Simple and Structured Setup for New Traders
________________________________________________________________________________
🚦 Key Zones to Watch
🔴 Top Range (Resistance) – 697.45
🟠 Mid-Level Zones – 685.60 | 673.75
🟢 Bottom Range (Support) – 661.95
📦 Possible Demand Zone – 671.95 to 669.70 (SL: 669 | Risk: 2.95)
________________________________________________________________________________
💡 What’s Happening on the Chart?
✅ Strong price rally from the demand area 📈
✅ Price is now consolidating just below major resistance (697.45)
✅ Volume spikes indicate strong participation
✅ Market respecting zones cleanly — ideal for zone learners 📚
________________________________________________________________________________
🎯 How to Plan Trades (For Educational Use Only):
🔼 Best Buy Setup:
• Entry: Near 671.95–669.70 (Demand Zone)
• Stoploss: 669
• Target: 685 / 697
• Why: Tested demand zone + strong uptrend + low-risk trade
🔽 Best Sell Setup:
• Entry: Near 697.45 (Resistance Zone)
• Stoploss: 699
• Target: 685.60 / 673.75
• Why: Top zone tested + price may reverse with exhaustion
________________________________________________________________________________
🧠 Learning Points for New Traders:
• ✅ Always trade with trend until you hit opposite zone
• 🧱 Focus on buying near support and selling near resistance
• 📊 Use volume and structure for entry confirmation
• 🧠 Risk should always be smaller than reward
________________________________________________________________________________
📦 Zone Summary for Quick Reference:
• 🔴 Resistance Zone: 697.45
• 🟢 Demand Zone: 671.95 – 669.70 (Risk only ₹2.95!)
⚠ Disclaimer (Please Read):
• These Trades are shared for educational purposes only and is not investment advice.
• I am not a SEBI-registered advisor.
• The information provided here is based on personal market observation.
• No buy/sell recommendations are being made.
• Please do your own research or consult a registered financial advisor before making any trading decisions.
• Trading involves risk. Always use proper risk management.
I am not responsible for trading decisions based on this post.
________________________________________________________________________________
💬 Found this helpful?
Drop your thoughts or questions in the comments below ⬇️
🔁 Share this post with your trading community – let them benefit from clean charts, structured setups, and zone-based learning.
✅ Follow simpletradewithpatience for charts, clean setups, and educational content based on price action, zones, and risk-managed trades.
🚀 Trade with patience, trust your charts, and stay clear-headed!
Be Self-Reliant | Trade with Patience | Learn with Charts & Zones 📊
________________________________________________________________________________
Demand Zone
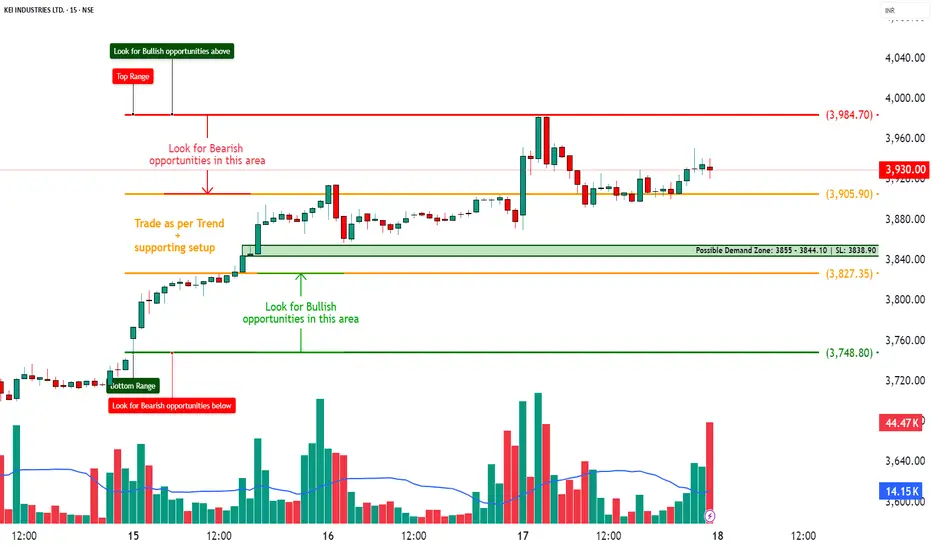
KEI – Bullish Continuation Setup with Breakout Potential________________________________________________________________________________
🚀 KEI – Bullish Continuation Setup with Breakout Potential
📅 Setup Date: 18.07.2025 | ⏱ Timeframe: Daily
📍 Strategy: Defined-Risk Bullish Spread (Short-Term Swing with OI Confirmation)
________________________________________________________________________________
🔍 Overview
Overall Bias: Bullish with supportive Put buildup
Spot Price: ₹3933.3
Trend: Sustained uptrend with OI buildup on CE/PE sides
Volatility (IV): 40–42%, stable with light compression
Ideal Strategy Mix: Defined-risk bullish strategy like vertical call spread
________________________________________________________________________________
1️⃣ Bullish Trade (Naked options as per trend)
Best CE: Buy 3900 CE @ ₹145.05
Why:
• Highest OI among CEs (7.05L) with strong Long Buildup
• Good volume and premium correction (▼16.32%) = cheaper entry
• Spot just above strike → early breakout zone
• Stable IV (40.34) gives clean delta tracking
________________________________________________________________________________
2️⃣ Bearish Trade (Naked options as per trend)
Best PE: Sell 3850 PE @ ₹82.65
Why:
• Long Buildup (OI ↑10.3%) on PE shows bullish support
• Strike sits just below spot → safety buffer
• IV stable and theta erosion beneficial
• Rich premium for selling with bullish bias intact
________________________________________________________________________________
⚙️ 3️⃣ Strategy Trade (As per trend + OI data)
Strategy: Bull Call Spread → Buy 3900 CE / Sell 4100 CE
Net Debit: ₹145.05 - ₹62.35 = ₹82.70
Max Profit: ₹200 - ₹82.70 = ₹117.30
Max Loss: ₹82.70
Risk:Reward ≈ 1 : 1.42 ✅ Within range
Lot Size: 175
Total Risk: ₹14,472.50
Max Profit: ₹20,527.50
Breakeven Point: ₹3982.70
Reversal Exit Level: Exit if Spot < ₹3879.32 (bullish spread invalidation below support)
________________________________________________________________________________
Why:
• Strong Long Buildup on 3900 CE and 4100 PE creates clean structure
• Risk:Reward = 1:1.42 fits strategy filters
• IV cooling supports call spread entry
• Breakout continuation likely with defined risk
________________________________________________________________________________
📘 My Trading Setup Rules
Avoid Gap Plays
→ Check pre-open price action to avoid trades influenced by gap-ups/gap-downs.
Breakout Entry Only
→ Enter trades only if price breaks previous day’s High (for bullish trades) or Low (for bearish trades).
Watch Volume for Confirmation
→ Monitor volume closely. No volume = No trade.
Enter on Strong Candle + Volume
→ Execute the trade only if a strong candle appears with increasing volume in the direction of the trade.
Defined Risk:Reward Only
→ Take trades only if R:R is favorable (ideally ≥ 1:2).(Safe R:R – 1:1)
Premium Disclaimer
→ Option premiums shown are based on EOD prices — real-time premiums may vary during execution.
Time Frame Preference
→ Trade with your preferred time frame — this strategy works across intraday or positional setups.
________________________________________________________________________________
⚠ Disclaimer (Please Read):
• These Trades are shared for educational purposes only and is not investment advice.
• I am not a SEBI-registered advisor.
• The information provided here is based on personal market observation.
• No buy/sell recommendations are being made.
• Please do your own research or consult a registered financial advisor before making any trading decisions.
• Trading involves risk. Always use proper risk management.
I am not responsible for trading decisions based on this post.
________________________________________________________________________________
💬 Found this helpful?
Drop your thoughts or questions in the comments below ⬇️
🔁 Share this post with your trading community – let them benefit from clean charts, structured setups, and zone-based learning.
✅ Follow simpletradewithpatience for charts, clean setups, and educational content based on price action, zones, and risk-managed trades.
🚀 Trade with patience, trust your charts, and stay clear-headed!
Be Self-Reliant | Trade with Patience | Learn with Charts & Zones 📊________________________________________________________________________________
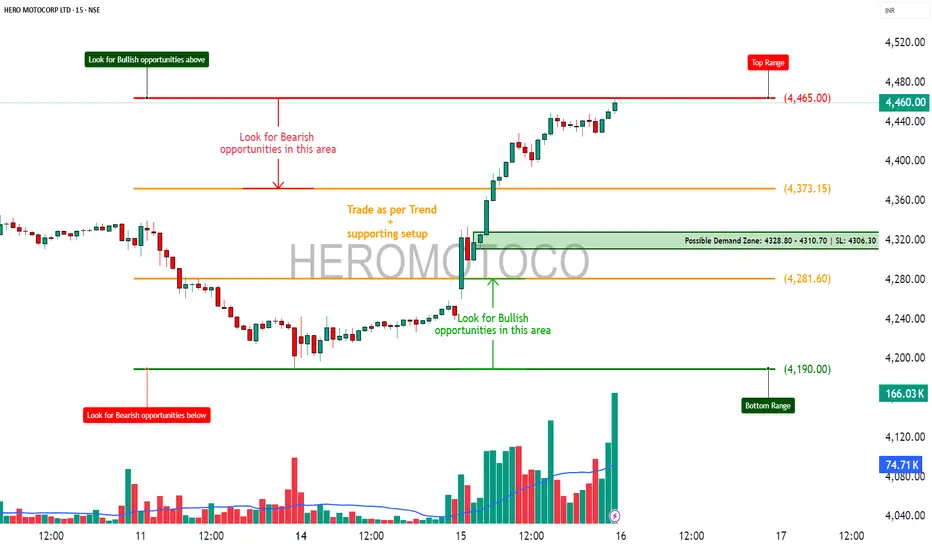
HEROMOTOCO – Option Chain + Price Action Intraday Setup________________________________________
📊 HEROMOTOCO – Option Chain + Price Action Intraday Setup
🕒 Chart Type: 15-Min Timeframe
📅 Date: July 15, 2025
🎯 For Educational Purpose Only
________________________________________
🔍 Chart Observations:
• Clean rally supported by increasing volume.
• Price nearing the Top Range / Resistance at ₹4465.
• A visible Demand Zone formed between ₹4328.80–₹4310.70 with a strong bounce.
• Volume spike confirms strong buying interest near demand levels.
________________________________________
🔢 Option Chain Insights:
🔼 Call Side Activity:
• 4500 CE: Massive Long Build Up — OI +111.76%, premium ₹52.3 → Suggests strength.
• 4450 CE: Also saw strong Long Build Up with rising premium.
• 4400 CE: Witnessed aggressive Short Covering, adding fuel to bullish momentum.
📈 Interpretation: Option writers are unwinding shorts on 4400, and 4500 is seeing heavy buildup — bullish sentiment.
🔽 Put Side Activity:
• 4400 PE: Sharp Short Build Up, IV at 34.5 → Puts being sold aggressively = Bullish bias.
• 4300 PE: Also saw strong Short Build Up, with OI rising despite falling premiums.
📉 Interpretation: Put writers are confident on downside support holding.
________________________________________
✅ Trade Plan Breakdown:
🔼 1. Best Buy – "Buy on Dip to Demand"
• Entry: ₹4328 – ₹4310 (Demand Zone)
• SL: ₹4306
• Risk Reward: 1:1 | 1:2 +
• Logic: Re-entry near demand zone + strong put writing + bullish volume = trend continuation
________________________________________
🔽 2. Best Sell – "Fade the Supply"
• Entry: ₹4460 – ₹4465 (Supply Zone)
• SL: ₹4475
• Risk Reward: 1:1 | 1:2 +
• Logic: Price near resistance with possible exhaustion. CE premiums elevated → good short-risk area
________________________________________
🟢 3. Best CE – "Momentum Play Above ₹4465"
• Strike: 4500 CE
• Trigger: If price breaks above ₹4465 with volume
• Logic: LTP ₹52.3 with Long Build Up, high delta (0.47) → Ready for breakout rally
________________________________________
🔴 4. Best PE – "Rejection Trade Below ₹4430"
• Strike: 4400 PE
• Trigger: If spot breaks below ₹4430
• Logic: LTP ₹95.75, Short Build Up suggests hedge-unwinding or trap possibility on failure
________________________________________
📦 5. Applicable Demand and Supply Zones
• Demand Zone: ₹4328.80 – ₹4310.70 (SL: ₹4306.30)
• Supply Zone: ₹4460 – ₹4465
• Mid-level Zones:
o Watch for support at ₹4373.15
o Breakdown area at ₹4281.60
• Bottom Range Support: ₹4190.00
________________________________________
💬 STWP Summary View:
The sentiment is strongly bullish, backed by long buildup in calls and short buildup in puts. If price breaks above ₹4465, momentum CE trades can fly. But supply pressure could give quick fade setups for scalpers too.
________________________________________
⚠️ Disclaimer (Read Before Trading):
• This setup is shared for educational purposes only.
• No investment advice or trade recommendation is being made.
• Always use proper risk management.
• STWP is not a SEBI-registered advisor.
• Markets involve risk. Trade with a plan, not with emotions.
________________________________________
💬 Found this helpful?
Drop your thoughts or questions below ⬇️
🔁 Share with your trading circle to help them navigate zone-based trades.
✅ Follow @simpletradewithpatience for smart charts, clean setups & demand-supply backed analysis.
📊 Let the price guide you — trade with patience, charts, and clarity!
________________________________________
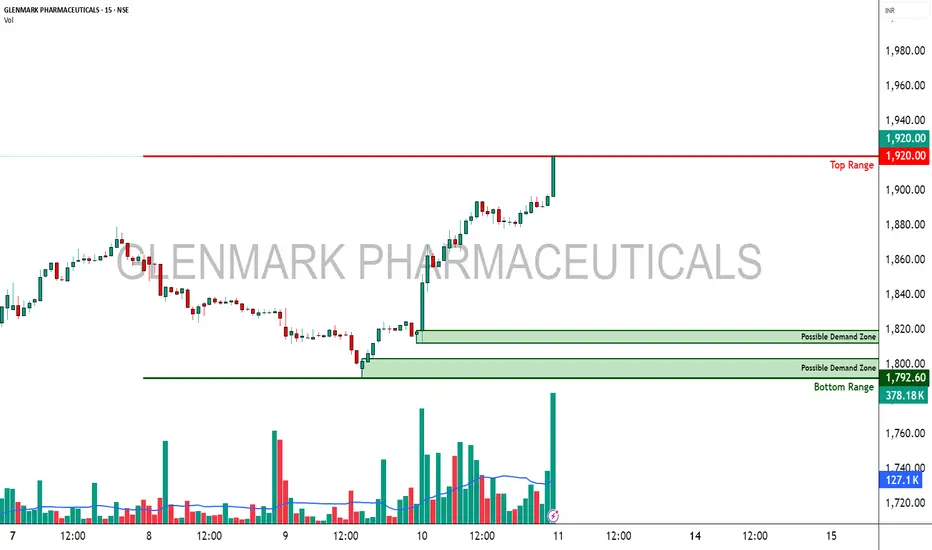
GLENMARK - Strong Option Chain Signals for Potential Trade SetupBias:
Bullish Bias with Aggressive Call Writing Unwinding and Strong Call Long Build-Up
Strong OI additions in OTM Calls; downside Put writing limited
________________________________________________________________________________
Best CE:
Strike: 2000
LTP: ₹42.1
OI: 28,83,750 (+12,32,625 | +74.65%)
Volume: 15,350
Build-Up: Long Build-Up
Interpretation: Strong aggressive buying; potential breakout above 2000
________________________________________________________________________________
Best PE:
Strike: 1700
LTP: ₹10.0
OI: 9,27,000 (+3,60,750 | +63.71%)
Volume: 4,059
Build-Up: Short Build-Up
Interpretation: Put writing — indicates strong support near 1700
________________________________________________________________________________
Best Strategy:
Bull Call Spread
(Buy 2000 CE, Sell 2120 CE)
- Capitalizes on upward momentum
- Defined risk & reward
- High probability based on CE buildup from 1920 to 2120
________________________________________________________________________________
Why:
- Multiple strikes (1920, 1960, 2000, 2120) with **Long Build-Up in Calls**
- Lower strikes (1860–1900) showing **Short Covering**, confirming up-move strength
- No significant Put Long Build-Up — bearish bets not seen
- 2000 CE has highest bullish action → Key breakout level
- Spot at ₹1904 is very close to these active strikes
________________________________________________________________________________
⚠️ Disclaimer (Please Read):
• This chart is shared for educational purposes only and is not investment advice.
• I am not a SEBI-registered advisor.
• The information provided here is based on personal market observation.
• No buy/sell recommendations are being made.
• Please do your own research or consult a registered financial advisor before making any trading decisions.
• Trading involves risk. Always use proper risk management.
________________________________________________________________________________
💬 Found this helpful?
Drop your thoughts or questions in the comments below ⬇️
🔁 Share this post with your trading community.
✅ Follow simpletradewithpatience for price-action backed technical setups.
🚀 Let’s trade with patience, logic, and clarity!
Be Self-Reliant | Trade with Patience | Learn with Logic
________________________________________________________________________________
Maruti - Strong Option Chain Signals for Potential Trade Setups________________________________________________________________________________
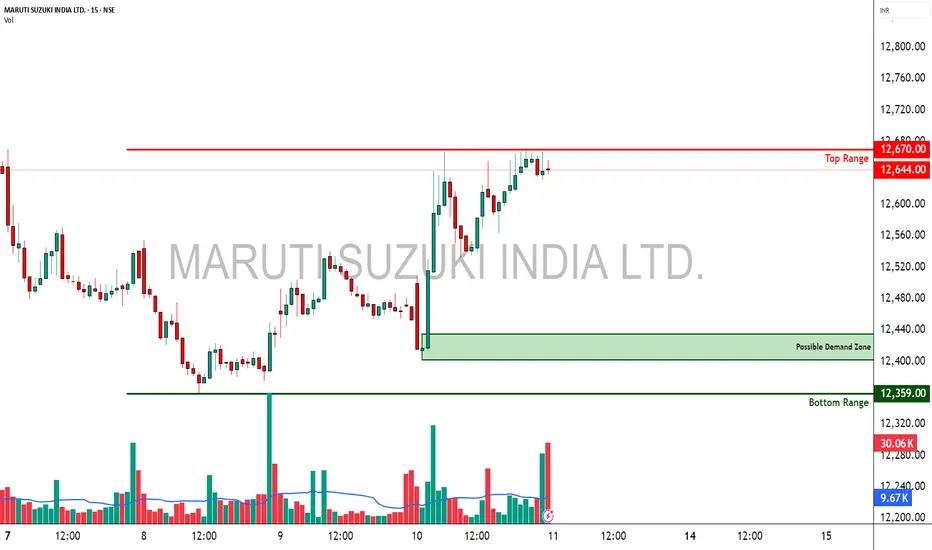
MARUTI
Bias: Bullish Bias
Strong Long Build-Up across Call strikes (12700–13500)
Simultaneous Short Build-Up on Puts — classic bullish confirmation
________________________________________________________________________________
Best CE:
Strike: 12800
LTP: ₹138.3
OI: 5,14,100 (+78,350 | +17.98%)
Volume: 17,570
Build-Up: Long Build-Up
Interpretation: High OI addition + price rise = active bullish bets at 12800
________________________________________________________________________________
Best PE:
Strike: 12600
LTP: ₹159
OI: 1,05,700 (+76,600 | +263.23%)
Volume: 10,114
Build-Up: Short Build-Up
Interpretation: Strong put writing at 12600 suggests immediate support here
________________________________________________________________________________
Best Strategy:
Bull Call Spread or Naked Call Buy
(Buy 12800 CE, Sell 13200 or 13500 CE for risk-defined play)
- Directional bullish play
- Room to run till 13200–13500 zone based on fresh CE buildup
- Ideal if Spot sustains above 12600
________________________________________________________________________________
Why:
- Long Build-Up seen from 12700 CE to 13500 CE
- Spot = ₹12650, and 12600 PE has heavy Put writing → firm base
- Call Short Covering seen at 12500, 12600 → unwinding resistance
- IVs are rising on PEs, falling on CEs → supports bullish sentiment
- 12800 CE has highest Long Build-Up + Volume → key upside breakout strike
- Above 12800, next resistance zones visible around 13200–13500 based on CE action
________________________________________________________________________________
⚠️ Disclaimer (Please Read):
• This chart is shared for educational purposes only and is not investment advice.
• I am not a SEBI-registered advisor.
• The information provided here is based on personal market observation.
• No buy/sell recommendations are being made.
• Please do your own research or consult a registered financial advisor before making any trading decisions.
• Trading involves risk. Always use proper risk management.
________________________________________________________________________________
💬 Found this helpful?
Drop your thoughts or questions in the comments below ⬇️
🔁 Share this post with your trading community.
✅ Follow simpletradewithpatience for price-action backed technical setups.
🚀 Let’s trade with patience, logic, and clarity!
Be Self-Reliant | Trade with Patience | Learn with Logic
METROPOLIS – Big Volume Breakout + Price Action + Momentum___________________________________________________________________________
📈 METROPOLIS – Big Volume Breakout | Strong Momentum Building |
Price Action | Volume Structure
🕒 Chart Type: Daily Chart
📆 Date: July 9, 2025
___________________________________________________________________________
Price Action: METROPOLIS HEALTHCARE LTD has delivered a strong breakout on the daily chart, moving out of a multi-week consolidation zone between 1880–1910 with a wide-range bullish candle on July 9. This breakout above the key resistance of 2110.9 comes with a clean structure, strong closing, and sharp momentum — now placing the stock near its 52-week high. The accumulation phase is likely over, and this price action suggests the beginning of a new trend. As a key player in the diagnostics sector, METROPOLIS is gaining renewed attention post-COVID, with the healthcare space showing strong tailwinds and fresh investor interest.
___________________________________________________________________________
Chart Pattern: The chart is showing a Flat Base Breakout following a multi-week consolidation, indicating the potential beginning of a new momentum leg within the broader structure. Notably, the base was tight and shallow, which is considered a strong bullish signal as it reflects controlled accumulation and limited profit-booking. This clean breakout hints at renewed strength and the possibility of sustained upside if volume and structure hold.
___________________________________________________________________________
Candlestick Pattern: NA
___________________________________________________________________________
Volume Analysis: The volume analysis strongly supports the breakout, with trading volume on the breakout day soaring to over 5 times the average of the past 20 sessions. This surge was not just in quantity but also in delivery volume, signaling that the move was backed by genuine long-term accumulation rather than intraday speculation. As the classic saying goes, “volume precedes price” — and this sharp spike clearly points to smart money entering the stock, lending credibility to the breakout and hinting at further upside potential.
___________________________________________________________________________
Technical Indicators: The technical indicators paint a strongly bullish picture. The RSI on the daily timeframe is at 84, which, while overbought, reflects strength and momentum rather than exhaustion. The MACD has triggered a bullish crossover, with a steadily rising histogram indicating a healthy momentum buildup. Both CCI and Stochastic oscillators are deep in bullish territory — CCI above 300 and Stochastic over 88 — highlighting the intensity of the current uptrend. Additionally, the price has expanded beyond the upper Bollinger Band, suggesting the start of a volatility expansion phase, which often accompanies strong directional moves.
___________________________________________________________________________
Support & Resistance: The stock has given a decisive breakout above ₹2110.9, which now acts as a strong reference point and the official top of its recent consolidation range. This level was pierced by a bullish candle backed by high volume, confirming strength and conviction in the move. Ahead, the stock faces its first hurdle at ₹2157, a short-term resistance just above the breakout zone where minor profit-booking may emerge. Beyond that, ₹2256.1 marks a key medium-term resistance aligned with a previous swing high — a level to watch closely if the rally continues on solid volume. For positional traders, ₹2401.3 stands as a distant resistance zone that, while weak, could be relevant if momentum accelerates. On the downside, ₹1912.7 offers immediate support, being the level that held firm during base formation. If deeper retracements occur, ₹1767.5 and ₹1668.4 are layered supports where the price previously showed strength. At the very base lies ₹1315, the major long-term demand zone — a structural support that triggered the prior trend and serves as the final defence in case of any broad weakness.
___________________________________________________________________________
What’s Catching Our Eye: The price has decisively broken above a multi-week resistance zone, and what makes this move stand out is the massive volume backing it. This isn't just a random spike — it's a structured breakout with all the internals lining up beautifully. Momentum indicators like RSI, MACD, CCI, and Stochastic are all in bullish alignment, confirming that the strength is real and not a one-off event. This kind of confluence often signals the start of a meaningful trend, not just a short-lived rally.
___________________________________________________________________________
What We’re Watching For: The key question now is whether the price can sustain above ₹2110.9, the breakout level, without slipping back into the previous range — a crucial sign of breakout validation. We're also keeping an eye out for a healthy pullback toward the ₹1880–₹1910 zone, which could offer a far better risk-reward entry if the uptrend remains intact. Most importantly, the bigger picture is in focus: Is this the beginning of a larger trend aiming for ₹2400+, or are we simply witnessing a short-term momentum burst? The next few sessions will be critical in answering that.
___________________________________________________________________________
Best Buy Level for Equity (Low Risk Idea): A low-risk buying opportunity opens above ₹2110.9, but only if the price sustains this breakout for a day or two — confirming strength and avoiding a false breakout scenario. Alternatively, a pullback to the ₹1880–₹1910 zone could offer an excellent risk-reward setup, especially if accompanied by a clear bullish reversal signal (like a strong candle or volume spike). In both cases, keep a strict stop loss at ₹1839 on a closing basis to protect against deeper downside.
___________________________________________________________________________
Sector Tailwinds: The diagnostic sector continues to build long-term strength in the post-COVID landscape, as healthcare awareness and preventive testing become mainstream. Investors are increasingly allocating capital toward healthcare services, recognizing their structural growth potential. Add to that the rising urban demand for quality diagnostics and the company's strong brand trust, and you get a solid layer of fundamental support fueling this rally — making the technical breakout even more meaningful.
___________________________________________________________________________
Risk to Watch: If the price fails to hold above ₹2110 and starts slipping below ₹1910, there’s a real risk of this breakout turning into a false move. While the current momentum is strong, indicators are overheated, which increases the chances of a short-term pullback or shakeout. Most importantly — no confirmation means no trade. Avoid chasing blindly; let the price action validate the move before committing capital.
___________________________________________________________________________
What to Expect Next: The stock may see a sideways move or a minor pullback toward the ₹1910 zone as it digests the breakout. However, if the price holds above the breakout level, we could see a continuation move toward ₹2157–₹2256 in the near term. The key to watch is volume — if the stock holds near highs with rising volume over the next 2–3 sessions, it could trigger a strong trending move, confirming that smart money is firmly in control.
___________________________________________________________________________
How to Trade METROPOLIS (For Educational Use Only):
Here’s a simple Breakout Trade Plan based on current structure and volume confirmation:
🔹 Entry: Above ₹2110.9 — either on a successful retest of the breakout level or a clean follow-through candle with strength
🔹 Stop Loss: ₹1839 (on closing basis) to protect capital in case of breakdown
🔹 Risk-Reward: Aim for 1:1 initially, then trail for 1:2+ if momentum holds
🔹 Position Sizing: Adjust based on your capital, risk appetite, and SL range — avoid going all-in; stay disciplined with allocation
📌 Always follow your trading plan. This setup is for educational and analysis purposes only.
___________________________________________________________________________
⚠️ Disclaimer (Please Read):
• This chart is shared for educational purposes only and is not investment advice.
• I am not a SEBI-registered advisor.
• The information provided here is based on personal market observation.
• No buy/sell recommendations are being made.
• Please do your own research or consult a registered financial advisor before making any trading decisions.
• Trading involves risk. Always use proper risk management.
___________________________________________________________________________
💬 Found this helpful?
What would be your ideal entry in this METROPOLIS setup — breakout follow-through or demand zone pullback?
Drop your thoughts or questions in the comments below ⬇️
🔁 Share this with your trading community
✅ Follow STWP for clean technical setups backed by price action and volume
🚀 Let’s trade with patience, logic, and clarity!
Be Self-Reliant | Trade with Patience | Learn with Logic
___________________________________________________________________________

NAUKRI - Demand Zone + Key Levels________________________________________________________________________________
📊 INFO EDGE (NSE: NAUKRI) – Beginner Chart Study | Demand Zone + Key Levels
🕒 Chart Timeframe: 15-Min | 📆 Updated: July 8, 2025
________________________________________________________________________________
🔍 What the Chart Shows:
NAUKRI recently bounced from a clearly defined demand zone and is now trading near a key mid-level. This educational post is meant to help understand how price behaves around such zones.
________________________________________________________________________________
✅ Zones to Observe for Strength (Upside):
• Above 1489.00: Price sustaining above this top range may indicate strength.
• Between 1432.35 and 1404.10: This broader zone has acted as support earlier. If revisited, watch how price behaves here.
________________________________________________________________________________
⚠️ Neutral / Observation Area:
• Around 1459.40 (near 1460.65): Price is consolidating near this level. It’s better to observe and wait for more clarity from price movement and volume.
________________________________________________________________________________
🔻 Zones to Observe for Weakness (Downside):
• Between 1460.65 – 1489.00: If price reacts negatively here (e.g., rejection candles or high supply volume), observe how it develops.
• Below 1402.85: This would invalidate the previous demand zone. Further weakness could be possible if price closes below.
________________________________________________________________________________
🧠 Learning Takeaways for Traders:
• Avoid trades in the middle zone without clear confirmation.
• Always wait for bullish or bearish patterns and supporting volume before considering action.
• Structure and levels help guide observation – not prediction.
________________________________________________________________________________
📌 Levels Recap:
• Top Range (Resistance): 1489.00
• Mid Resistance: 1460.65
• Mid Support: 1432.35
• Bottom Range: 1404.10
• Demand Zone Reference: 1414.20 – 1404.90 | SL Reference Level: 1402.85 (used for structure observation only)
________________________________________________________________________________
⚠️ Disclaimer (Please Read):
• This chart is shared for educational purposes only and is not investment advice.
• I am not a SEBI-registered advisor.
• The information provided here is based on personal market observation.
• No buy/sell recommendations are being made.
• Please do your own research or consult a registered financial advisor before making any trading decisions.
• Trading involves risk. Always use proper risk management.
________________________________________________________________________________
💬 Join the Discussion (Comments):
✅ Was this chart structure easy to understand?
✅ How do you look at such supply and demand zones in your charting?
✅ Want more beginner-focused educational charts? Drop a 💬 below.
✅ If you're learning technical analysis, follow for more such breakdowns.
________________________________________________________________________________

HINDUNILVR – TECHNICAL ANALYSIS________________________________________
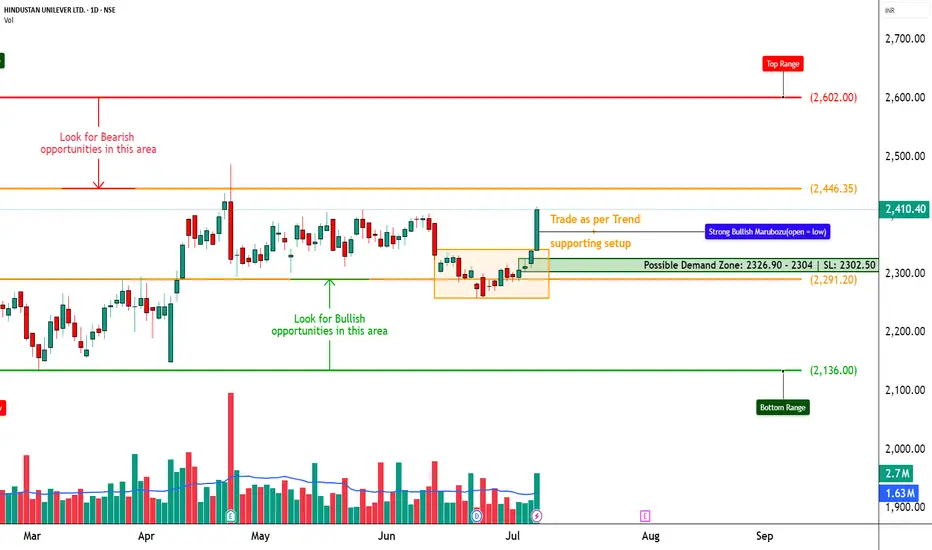
📈 HINDUNILVR – TECHNICAL ANALYSIS
📆 Date: July 8, 2025 | ⏱ Timeframe: Daily Chart
🔍 Educational Breakdown – For Learning & Study Use Only
________________________________________
🔹 Price Action Zones
• 🔴 Top Range: 2602
• Resistance: 2437.07 – 2463.73 – 2511.77
• 🟢 Bottom Range: 2136
• Support: 2287.67 – 2314.33 – 2362.37
________________________________________
🔹 Chart Pattern: ✅ Bullish Marubozu Breakout
Price bounced from a demand zone near 2326.90 – 2304| SL: 2302.50 with a powerful Marubozu candle and reclaimed structure strength. This breakout aligns with STWP’s HNI setup and suggests the beginning of a strong bullish leg.
________________________________________
🔹 Reversal Candlestick Patterns:
✅ Bullish Marubozu
✅ Strong follow-through near support
✅ High conviction breakout from base – Open = Low
________________________________________
🔹 Volume Footprint:
✅ Volume spiked to 2.7M (vs average 1.63M)
✅ Indicates institutional participation backing the breakout
🚨 Watch for continuation volume above 2415 to confirm momentum
________________________________________
🔹 Trend Bias: ✅ Bullish
Clear bullish trend forming after breakout. Supports are holding, and resistance levels are now being tested with strength.
________________________________________
📌 What’s Catching Our Eye:
• STWP HNI Setup triggered at 2400–2415 range
• Breakout above strong support near 2300–2320
• OI Data and Option Chain analysis supports upward continuation
________________________________________
👀 What We’re Watching For:
• Sustained close above 2415 = bullish continuation
• Option build-up hints at possible follow-through toward higher zones
• Strong CE activity at 2420, 2440, and 2460 levels
________________________________________
🔹 OPTION CHAIN ANALYSIS – KEY TAKEAWAYS
💥 CALL Side (Bullish Builds):
• 2420 CE: 40.05 – 📈 OI up +158%, Long Build-Up
• 2440 CE: 31.25 – 📈 OI up +182%, Long Build-Up
• 2460 CE: 24.50 – 📈 OI up +345%, Long Build-Up
• 2500 CE: 14.45 – 📈 OI up +22%, Long Build-Up
🚀 Indicates participants are positioning for extended upside toward 2460–2500
📉 PUT Side (Writers in Control):
• 2300 PE: Down -60%, Short Build-Up
• 2400 PE: Down -52%, Short Build-Up
💡 Suggests confidence that price will hold above 2400
🧠 Conclusion from OI Data:
Strong bullish sentiment — Call Writers/Buyers increasing exposure at higher strikes, Puts being shorted. Volume + OI = directional strength.
________________________________________
⚠️ Risks to Watch:
• Close below 2390–2395 = early weakness sign
• Bearish divergence + volume fade risk
• Watch 2460–2512 for rejection
________________________________________
🔮 What to Expect Next:
• ⚡ Price retesting 2460 zone likely
• 🔄 Pullbacks toward 2395–2405 may offer low-risk re-entry
• ⚠️ Watch for spikes in volatility near 2500
________________________________________
📊 Trade Plan (Educational Only – Based on Logic + Volume Confirmation)
🔼 Breakout Long Setup
• Entry: Above 2415
• Stop Loss: 2339.30
• Risk–Reward: 1:1 to 1:2 +
📌 Why:
• Bullish Marubozu + Volume
• OI Long Build-Up at 2420–2460
• STWP HNI Setup alignment
🔁 Pullback Long Setup
• Entry Zone: 2395–2400
• Stop Loss: 2365
• Risk–Reward: 1:1 to 1:2 +
📌 Why:
• Breakout retest zone
• Tight SL with continuation logic
🔽 Bearish Setup (Only on Failure)
• Entry: Below 2360
• Stop Loss: 2410
• Risk–Reward: Flexible (trader-defined)
📌 Why:
• Only valid on strong breakdown with volume
• Reversal below structure
________________________________________
📊 Option Trade Ideas – For Learning Purpose Only
🔼 Best CE (Bullish Bias)
➡️ 2420 CE @ 40.05
• Risk–Reward Potential: 1:1 to 1:2+
🛑 SL: 26
📌 Why: Clean momentum zone, well-aligned with breakout
🟡 Alternate CE (Momentum Extension)
➡️ 2440 CE @ 31.25 – if expecting further move toward 2490–2510
• Slightly lower Delta, higher risk-reward
🔽 Best PE (Only if Breakdown)
➡️ 2400 PE @ 34.40
• Use only below 2390 with high-volume reversal
• Risk–Reward Potential: 1:1 to 1:2 +
🛑 SL: 21
________________________________________
❌ Invalidation Triggers:
• Daily close below 2360
• Long unwinding on CE strikes
• PE Long Build-Up + Volume = Bearish Shift
________________________________________
⚠️ Disclaimer:
This analysis is for educational purposes only.
“STWP HNI Setup” is a proprietary internal model shared for study and learning.
STWP is not a SEBI-registered advisor.
This is not a buy/sell recommendation.
Please consult your financial advisor before taking any action.
STWP is not responsible for trading decisions based on this post.
________________________________________
💬 Found this helpful?
Did the STWP HNI Setup help you anticipate the move?
💭 Drop your thoughts in the comments ⬇️
🔁 Share this with fellow traders
✅ Follow STWP for volume-based, logic-driven setups
🚀 Be Self-Reliant | Trade with Patience | Learn with Logic
________________________________________
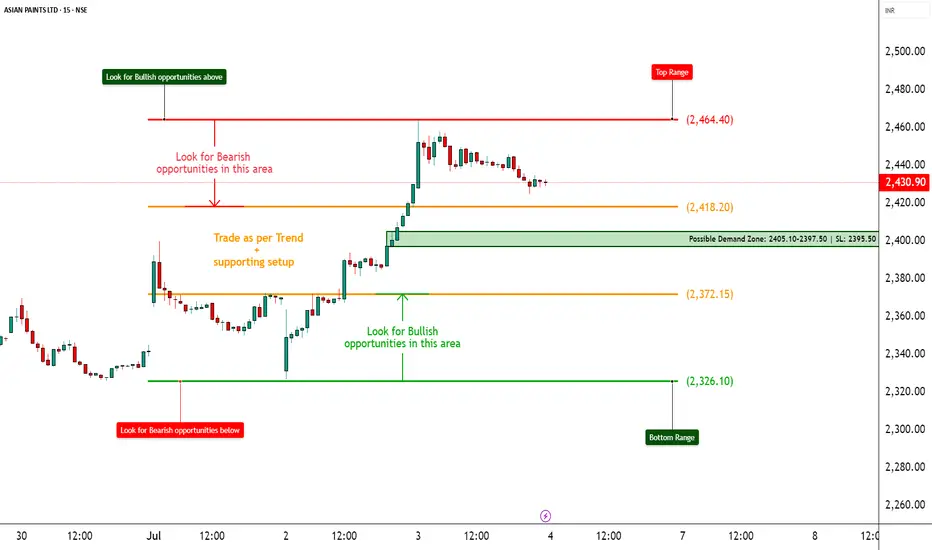
ASIANPAINT – Strong Bounce from Demand Zone________________________________________________________________________________📈 ASIANPAINT – Strong Bounce from Demand Zone | Option Chain + Price Action Breakdown
🕒 Chart Type: 15-Minute
📆 Date: July 3, 2025
________________________________________________________________________________
🔍 What’s Catching Our Eye:
ASIANPAINT saw a sharp intraday rebound from its marked demand zone at ₹2405–₹2397.50, with price closing near ₹2,430.90. The reversal occurred on higher volume and in the presence of long build-ups across multiple Call strikes. This suggests institutional interest and a potential shift in short-term sentiment.
________________________________________________________________________________
📌 What We’re Watching For:
The key observation is that ASIANPAINT respected its demand zone and bounced with strength. If the price sustains above ₹2,440, it could trigger continuation toward the top range of ₹2,464.40. On the downside, any failure to hold the demand zone may bring back pressure toward ₹2,400. Option chain data supports the bullish bias, with fresh long positions across ATM and OTM calls.
________________________________________________________________________________
📊 Volume Footprint:
Today’s volume was 1.55M, higher than the previous 1.36M, signaling strong participation during the bounce. A continuation move with volume > 1.5M may validate breakout setups.
________________________________________________________________________________
📈 Option Chain Highlights:
The 2,500 CE, 2,460 CE, and 2,440 CE all witnessed strong long build-ups, confirming bullish positioning. Even the deep OTM 2,600 CE showed healthy open interest increase. Meanwhile, 2,400 PE showed short build-up, suggesting put writers are confident that the ₹2,400 level will hold. Notably, 2,400 CE also saw short covering, adding further weight to the bullish narrative.
________________________________________________________________________________
🔁 Trend Bias:
🟢 Bullish above ₹2,440, especially if volume confirms a clean move
________________________________________
🧠 Trade Logic / Reasoning:
The bounce from demand was technical and backed by derivatives activity. The presence of long build-ups across multiple Calls and the short covering at 2400 CE suggests strength. Since price closed above key EMA zones and respected the lower boundary, it builds a solid case for an upward move, unless volume suddenly drops or a fresh supply emerges.
________________________________________________________________________________
📍 Important Levels to Mark:
🔺 Top Range Resistance: ₹2,464.40 – Watch for bullish breakout or reversal candlestick
🔻 Bottom Range Support: ₹2,326.10 – Deeper support; unlikely to come into play unless 2400 breaks
________________________________________________________________________________
🎯 Trade Plan (Educational Purpose Only):
✅ Best Buy (Cash/Futures):
Buy above ₹2,440 with bullish price action and volume confirmation. Reversal from the demand zone is valid as long as price holds above ₹2,405.
✅ Best Sell (Cash/Futures):
Sell only below ₹2,405 if the price breaks the demand zone with high volume and bearish structure. Downside may open toward ₹2,380–₹2,360.
💼 Best CE to Long:
2,440 CE or 2,460 CE – Both strikes show strong Long Build-Up; ideal for directional continuation above ₹2,440.
📉 Best PE to Long:
2,400 PE – Consider only if price breaks and sustains below ₹2,405 with heavy volume and weak candle close. Risk-reward turns favourable for downside hedging.
🟢 Demand Zone: ₹2405.10 – ₹2397.50 | SL: ₹2395.50
🔴 Supply Zone: Not clearly visible yet (watch ₹2464+ for fresh seller emergence)
⚠️ Invalidation Below:
Bullish bias invalid if price closes below ₹2,395 with strong volume and momentum.
________________________________________________________________________________
⚠️ Disclaimer:
This post is for educational purposes only.
STWP is not a SEBI-registered advisor.
This is not a buy/sell recommendation.
Please consult your financial advisor before trading.
STWP is not responsible for any trading outcomes.
________________________________________________________________________________
💬 Found this helpful?
Drop your thoughts in the comments ⬇️
🔁 Share this with fellow traders
✅ Follow STWP for zone-based price action & option chain insights
🚀 Let’s grow awareness for structured & patient trading!
________________________________________________________________________________
TRENT LTD – INTRADAY ZONE ANALYSIS________________________________________________________________________________
📈 TRENT LTD – INTRADAY ZONE ANALYSIS
📆 Date: July 1, 2025 | ⏱ Timeframe: 15-Minute Chart
🔍 Educational Analysis for Learning Purposes Only
________________________________________________________________________________
📊 Zone Breakdown:
• 🔴 Top Range Resistance – 6,261
Marked in Red: This is a key supply zone where the price has previously stalled. Traders should watch for bearish reversal candlestick patterns like a bearish engulfing, evening star, or long upper wick rejection. A lack of follow-through volume here may indicate exhaustion.
• 🟠 Neutral Zone – Avoid Trade Area (6,155 – 6,210)
Marked in Orange: Price tends to be indecisive here. This is a “no trade zone” unless supported by a strong trend direction and setup. Historically, it has shown sideways movement and choppy behaviour.
• 🟢 Demand Zone – 6,105 to 6,066.50 | SL: 6,058.10
Marked in Green: Price reacted sharply from this zone with rising volume. A bullish engulfing candle confirmed demand here. Ideal for watching pullback opportunities on re-tests, supported by bullish confirmation candles.
• 🟩 Bottom Support – 5,968
A strong base level. A breakdown below this zone may signal a shift in short-term structure. Look for volume spike and wide-bodied red candle for bearish confirmation.
________________________________________________________________________________
🔍 Candlestick Observation:
At the Top Resistance Zone (6261), recent candles show upper wicks and indecision, but no strong bearish reversal yet. Volume is elevated, signaling activity, but candles show hesitation.
🧠 Interpretation: This could be an early sign of supply pressure. A follow-up bearish engulfing or strong rejection candle may validate a reversal. Until then, price may consolidate within the zone.
________________________________________________________________________________
⚙️ Educational Trade Ideas (Study Purpose Only)
▶️ Reversal Setup – Bearish Bias
• Entry: Below ₹6,190 on confirmation candle from resistance zone
• Stop Loss: Above ₹6,265
• Risk-Reward: 1:1 | 1:2 +
• 🧠 Ideal for learning how price reacts to supply after a sharp rally
________________________________________________________________________________
▶️ Pullback Setup – Bullish Bias
• Entry: Near ₹6,100–₹6,110 on bullish confirmation from demand zone
• Stop Loss: ₹6,058
• Risk-Reward: 1:1 | 1:2 +
• 🧠 A classic “Breakout–Retest–Continuation” setup with proper risk management
________________________________________________________________________________
⚠️ Disclaimer (SEBI-Compliant):
This content is shared strictly for educational and informational purposes only. It does not constitute investment advice or a trading recommendation. Always consult a SEBI-registered financial advisor before making investment decisions.
STWP | Learn. Trade. Grow.
________________________________________________________________________________
💬 What do you think about this TRENT setup?
Did you observe any volume divergence or trendline reaction?
👇 Drop your insights in the comments — let’s grow together!
________________________________________________________________________________
Bonus:

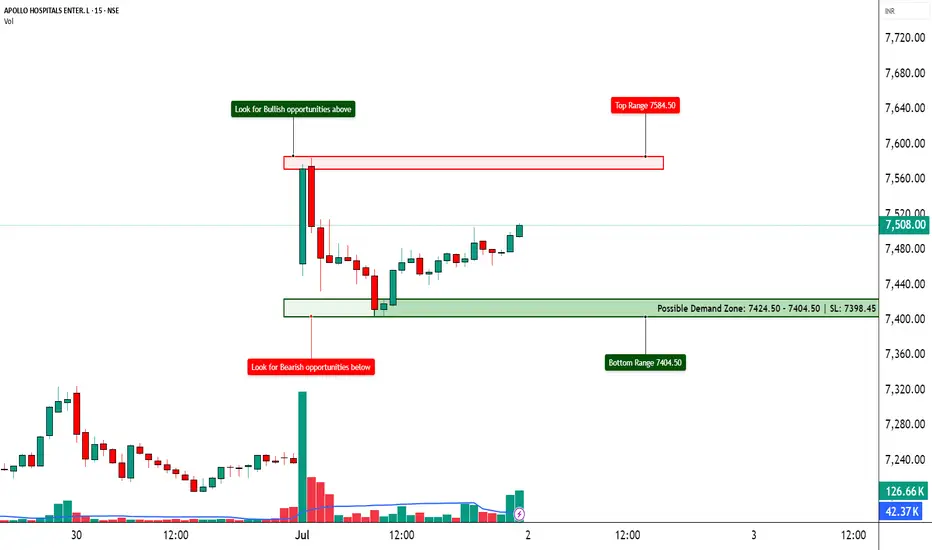
APOLLOHOSP – Preparing for the Next Breakout ?📈 APOLLOHOSP – Preparing for the Next Breakout?
🔍 Bullish Setup Unfolding | Option Chain + Price Action Analysis
Chart Type: 15-min / 1H / Daily
Indicators: STWP Zones, Volume, Demand-Supply, Price Action
🔹 What’s Catching Our Eye?
✅ Strong Long Build-Up across 7500–8000 Calls
✅ Heavy Put Writing at 7500, 7400, and even 7000
✅ Volatility Expansion + Rising OI = Possible Range Expansion Move
✅ Clean Demand Zone at 7400–7450 with a Morning Star Bounce (if visible)
✅ ATM Call (7500 CE) up 124% with +38% OI – Institutions possibly preparing for an up move!
📊 What We’re Watching for:
📍 Trigger Level: 7520–7550 Breakout
📍 Targets: 7600 → 7700 → 7800
📍 Invalidation Below: 7420
📍 Momentum Confirmation: Price closing above 7550 with volume spike
📍 Option Chain Support: 7000–7400 (Heavy PE writing)
📌 Trade Plan (Educational Purpose Only):
🔹 Bullish: Buy on breakout above 7550 with SL below 7440
🔹 Options: Consider 7600 or 7700 CE based on risk profile
🔹 BTST Type: If price holds 7500–7520 till close
⚠️ Disclaimer:
This post is for educational and learning purposes only.
It does not constitute buy/sell advice or investment recommendation.
Always consult your financial advisor before taking any positions.
STWP is not liable for any financial decisions based on this content.
📚 "Let Data Drive the Trade – Not Emotion!"
💬 What's your take on ApolloHosp? Bullish ride or trap zone?
BRITANNIA INDUSTRIES LTD. – INTRADAY ZONE ANALYSIS📈 BRITANNIA INDUSTRIES LTD. – INTRADAY ZONE ANALYSIS
📆 Date: July 1, 2025 | ⏱ Timeframe: 15-Minute Chart
🔍 Educational Breakdown – For Learning & Study Use Only
________________________________________
🔹 Price Action Zones
🔴 Top Range (Resistance): ₹5869.50
🟢 Bottom Range (Support): ₹5721
⚪ Neutral Zone: Between ₹5732 – ₹5804 (No clear directional bias until breakout from either zone)
________________________________________
🧩 Chart Pattern: No
There’s no prominent chart pattern (e.g., flag, wedge, triangle) seen in the current snapshot. This is primarily a demand-supply structure with price action analysis.
________________________________________
🔁 Reversal Candlestick Patterns:
🔴 Top Range: No textbook reversal candle observed yet. However, the previous rejection from ₹5822–₹5804 still makes this zone valid for bearish observation.
🟢 Bottom Range: ✅ Morning Star pattern identified near ₹5721.
This is a strong bullish reversal pattern indicating potential buyer strength emerging from the demand zone.
________________________________________
🧠 1. Trade Plan (Based on Reason and Logic)
🔼 Bullish Trade:
Idea: Go long if price retests ₹5732–₹5721 and holds with bullish confirmation (preferably another higher low or volume spike).
Stop Loss: Below ₹5715
Risk-Reward: 1:1 | 1:2+
Logic: Presence of a valid Morning Star reversal at demand zone suggests buyer strength and potential upside toward ₹5800+.
________________________________________
🔽 Bearish Trade:
Idea: Short if price rallies to ₹5822–₹5804 and shows rejection (bearish wick, reversal candle, volume drop).
Stop Loss: ₹5827.25
Risk-Reward: 1:1 | 1:2+
Logic: Previously reacted supply zone with strong rejection. If tested again without volume confirmation, short setup is valid.
________________________________________
📦 2. Trade Plan Based on Demand/Supply Zones
🟥 Supply Zone: ₹5822 – ₹5804
SL: ₹5827.25
Plan: Enter short only if price rejects the zone again with bearish confirmation.
Risk-Reward: 1:1 | 1:2+
🟩 Demand Zone: ₹5732 – ₹5721
SL: ₹5715.60
Plan: Enter long if the zone holds, ideally using the Morning Star as confirmation.
Risk-Reward: 1:1 | 1:2+
________________________________________
📌 Disclaimer
This analysis is shared for educational and study purposes only. It does not constitute investment advice. The author is not SEBI-registered. Please consult a SEBI-registered advisor before making trading decisions. Always use proper risk management and trade only with confirmation.
________________________________________
💬 Comments
What’s your view on Britannia?
Will the Morning Star at the demand zone lead to a reversal, or will supply pressure dominate again?
Drop your thoughts and chart setups below 👇
________________________________________

SIEMENS LTD. – INTRADAY ZONE ANALYSIS________________________________________
📈 SIEMENS LTD. – INTRADAY ZONE ANALYSIS
📆 Date: July 1, 2025 | ⏱ Timeframe: 15-Minute Chart
🔍 Educational Analysis for Learning Purposes Only
________________________________________
📊 Zone Breakdown:
• 🔴 Top Range Resistance – 3,271.90
Marked in Red: This is a clearly defined supply zone where the price faced sharp rejection after testing highs. Bearish opportunity zone if a reversal pattern appears — watch for signs like bearish engulfing, double top, or rising volume + long upper wicks.
• 🟠 No Trade Zone – Around 3,225–3,260
Marked in Orange: This range has seen volatile, choppy action without clear bias. Traders may avoid fresh positions here unless directional strength emerges with volume confirmation.
• 🟢 Demand Zone – 3,182.60 to 3,165 | SL: 3,160.35
Marked in Green: Price reversed sharply from this area in the past with strong bullish candles. Acts as a low-risk buying area on retest with bullish confirmation. Risk-managed entries possible here.
• 🟩 Bottom Support – 3,101.10
Marked in Dark Green: Crucial structural support zone. Breakdown below this level could change the short-term trend to bearish. Currently a “last line of defense” for bulls.
________________________________________
🔍 Candlestick & Chart Pattern Observation:
✅ Bearish Rejection Near Top Zone:
A strong upper rejection candle (long wick) appeared right at the top resistance (3,271.90), followed by consistent lower highs and lower closes. This confirms seller presence. No double top yet, but early signs of a potential short-term top formation are visible.
✅ Bullish Reversal from Demand Zone:
The candle near 3,170 zone shows a sharp bullish engulfing move on higher volume — signaling potential institutional interest. This zone has repeatedly offered bounce opportunities.
📉 Volume Clue:
Volume expanded during the bounce from demand zone and tapered near resistance — confirming participation during dips and caution near highs.
________________________________________
⚙️ Educational Trade Ideas (Study Purpose Only)
▶️ Reversal Setup – Bearish Bias
• Entry: Below 3,245 on bearish continuation candle
• Stop Loss: Above 3,272 (Top Range)
• Risk-Reward: 1:1 | 1:2+
________________________________________
🧠 Ideal for studying exhaustion after a resistance test and confirmation through lower highs.
▶️ Pullback Setup – Bullish Bias
• Entry: Between 3,170–3,182 (Demand Zone)
• Stop Loss: 3,160.35
• Risk-Reward: 1:1 | 1:2+
🧠 Classic demand zone bounce setup. Strong volume + engulfing candle supports bullish case.
________________________________________
⚠️ Disclaimer (SEBI-Compliant):
This content is strictly for educational and informational purposes. It is not investment advice or a recommendation to buy/sell any securities. Always consult a SEBI-registered financial advisor before making any financial decisions.
STWP | Learn. Trade. Grow.
________________________________________
💬 Do you think the top is strong enough for a short? Or will bulls take control at demand again?
Drop your thoughts and analysis below ⬇️
________________________________________

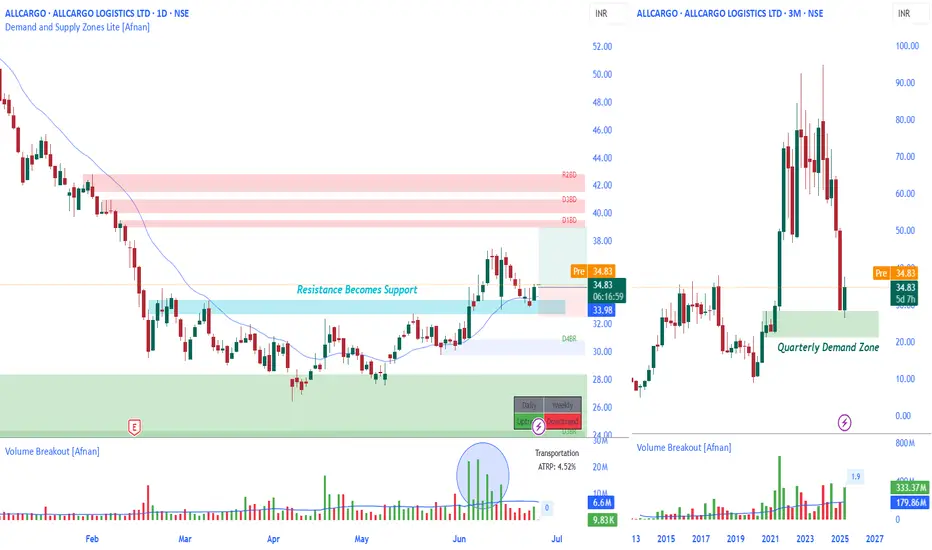
Quarterly Demand Zone + Daily Breakout = Strong ConfluenceLet’s talk about a setup that checks almost every box for a technically sound trade— NSE:ALLCARGO .
This isn’t just any breakout. It’s one of those rare moments when multiple timeframes are pointing in the same direction... and when that happens, smart traders pay attention.
🧱 Quarterly Demand Zone – The Foundation of the Setup
This isn’t just a technical level—it’s a potential stronghold for smart money activity. Price has just entered and reacted from a well-defined Quarterly Demand Zone, which historically tends to be the playground of institutions, not retail noise.
What I find especially compelling is how the reaction from this Quarterly Demand Zone isn't just visible—it’s meaningful. The current quarterly candle is green, forming on increasing volume, and there are only 3 days left until it closes. That’s not random—it’s calculated accumulation.
🧱 Daily Price Action Breakdown
On the Daily timeframe, the stock had been in a tight sideways range for a while. That consolidation wasn’t random—it was accumulation. We saw repeated tests of a clear resistance zone, gradually weakening that level... and then?
Boom. Breakout.
And not a weak or fake-out move either. This one came with conviction and volume. Now the price is pulling back slightly, retesting the breakout zone—which, by the way, is now acting as support thanks to the Polarity Principle . The most recent daily candle? Showing signs of price respecting this level.
💡 When price responds to a higher timeframe demand zone and then breaks out on the lower timeframe with strength, that’s a serious signal of institutional activity and trend continuation. you’re not just chasing momentum—you’re trading with alignment .
📊 Technical Highlights
Quarterly Demand Zone Reacted : Price reversed from a higher timeframe zone—classic smart money footprint.
Quarterly Candle Turned Bullish : Green candle forming with rising volume, hinting at a potential long-term reversal.
Daily Breakout From Consolidation : Resistance was tested multiple times, finally gave way.
Volume Confirmation : Breakout candle printed on above-average volume—always a good sign.
Polarity Flip : Resistance has turned into support, and price seems to be holding it for now.
📍 My Take on This Trade
For a swing trader who values structure and confirmation, this setup is about as clean as it gets. The Quarterly Demand Zone is doing the heavy lifting here , giving you that deep, institutional-level context. And the daily breakout? The story is unfolding right in front of us.
I’m bullish on this setup. Entry at CMP 34.83, Place stop-loss just below yesterday's ’s candle low (with a bit of a buffer). First target? The daily supply zone—which could offer a solid 1:2 risk-to-reward. If the rally continues, consider trailing your stop loss to lock in gains. But let’s be real: any setup can fail. Price could easily dip back into the range or break lower. That’s why risk management isn’t optional—it’s essential. This isn’t financial advice—just an analytical perspective for educational purposes.
🧠 Final Thoughts
If the Quarterly chart is your tide, the Daily is just the wave. And right now, both are flowing in the same direction. That’s not the time to hesitate—that’s the time to execute (with proper risk, of course).
✨ “Price reacts where smart money acts. Your job is to listen, not predict.” 🔍
🎯 Remember, it’s not about predicting—it’s about aligning your trades with high-probability setups.
📈 Stay sharp, trade clean, and respect the zones.
Thanks for the read. Got thoughts or questions? Drop them below—I’m always happy to chat charts.
Thanks for the support—keep studying the charts, and keep sharpening your edge. 📈💬
This analysis is for educational purposes only. I’m not a SEBI-registered advisor and this is not a trading or investment recommendation.
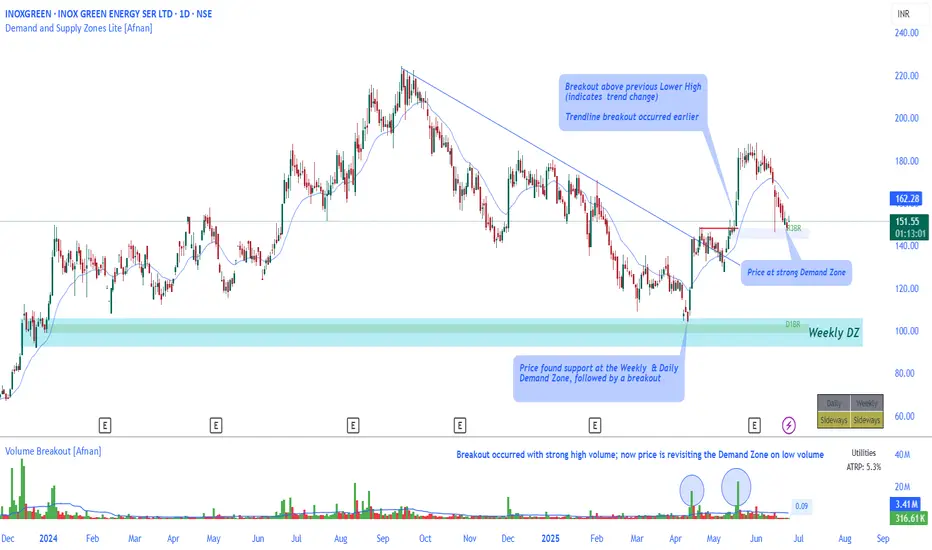
Demand Zone Retest After Breakout – Healthy Pullback NSE:INOXGREEN has been quietly setting up an interesting structure on the daily chart — one that could catch the attention of traders who follow clean trend reversals and demand zone dynamics.
The recent action is about patience and structure — the kind of move that often builds the foundation for the next big move.
📊 What’s Happening on the Chart?
Trendline Breakout: After months of trending lower, price finally broke above its falling trendline — a signal that sellers were starting to lose control.
Structure Shift: Not long after the trendline breakout, price took out a key lower high. That’s your textbook sign of a potential trend change from bearish to bullish.
Support Found at Demand: Before all this, the stock found solid footing at a strong Weekly + Daily Demand Zone — a level where buyers stepped in with confidence.
Now Back to Demand (But Quietly): After the breakout, price is now calmly pulling back into a nearby demand zone — and it’s doing so on low volume. That’s typically a good thing; it shows there’s no panic selling, just a quiet retracement.
🧠 Why This Matters
This kind of setup often catches traders off guard. The breakout already happened, the volume confirmed it — but now the market is “retesting” the move, checking if the breakout is for real.
Here’s why this zone is worth watching:
Pullbacks on low volume into demand are often healthy — it means sellers aren't in control.
If buyers show up again, especially with a bounce or bullish candle, it could confirm the next move higher.
As long as this demand zone holds, the larger structure stays positive.
🔍 My Closing Take
It’s easy to get caught up in the breakout hype, but sometimes the real opportunity is in the retest — when most people stop watching. If this zone holds and price starts moving with momentum again, it could be a sign of strength returning.
🔥 "Patience and preparation turn market uncertainty into opportunity." 🔥
This analysis is shared for educational purposes only and is not a trading or investment recommendation , as I am not a SEBI registered Analyst.
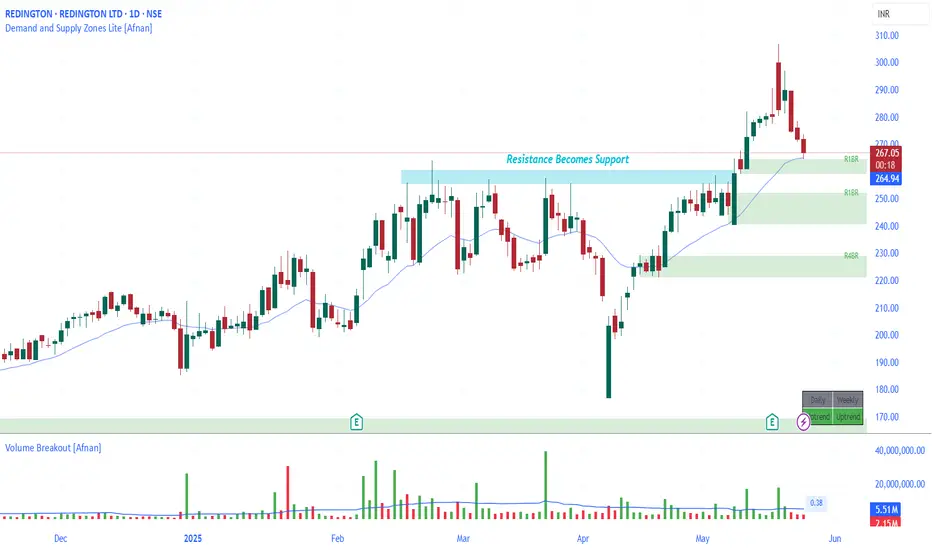
Strong Confluence Setup : REDINGTON at Crucial Demand Zone
REDINGTON is showing signs of a promising technical setup — something that can catch the attention of demand and supply zone traders. Let’s break down the analysis in simple words so that even a beginner can understand why this stock might be at an interesting level.
🔥 The Demand Zone Setup 🔥
The stock is currently hovering around a Rally-Base-Rally demand zone. This is a price area where big institutions may have left pending buy orders before pushing the price higher.
📉 Confluence of EMA and Support Flip
Here’s where the setup gets even more interesting. Apart from the demand zone:
REDINGTON is trading near its 20 EMA — a dynamic support level that often helps price bounce in uptrends.
There was a recent resistance breakout — price struggled to go above a certain level, broke through it with heavy volume, and is now returning to retest that same level.
Resistance turns into support : This classic law of polarity increases the odds of a bounce from here.
💡 Volume Analysis Matters
The breakout candle had heavy volume. Now, as the price pulls back to the demand zone, volume is dropping — this is a healthy sign. It suggests the sellers are weakening and the buyers might soon step in again.
👣 Smart Money Footprints & Pending Orders
Demand zones reflect unfilled institutional orders. If smart money had previously bought here, they may defend this zone to protect their positions. That could mean more buying at this level, pushing the price higher once again.
⚠️ But Wait — Risk Management is Key!
Even high-probability setups can fail — and that’s just the nature of trading. Always use a stop-loss. The goal isn’t to be right all the time — it’s to manage risk smartly and survive long enough to be consistently profitable.
📊 Setup Summary
Price near RBR demand zone Strong case for smart money entry
Confluence of 20 EMA support
Polarity principle : Resistance turned into support
Volume drop on pullback — bullish signal
Always place stop-loss — risk management matters
📌 "In trading, confidence comes from preparation — not prediction."
Lastly, Thank you for your support, your likes & comments. Feel free to ask if you have questions.
⚡ Stay focused, trade smart, and let the charts do the talking! ⚡
This analysis is for educational purposes only and is not intended as a trading or investment recommendation. I am not a SEBI registered analyst.
DEMAND ZONE TRADE SETUP📈 AVENUE SUPERMARTS (DMART) – DEMAND ZONE TRADE SETUP
📆 Date: June 5, 2025
🔍 Timeframe: 15-Minute Chart
Chart Overview:
DMART witnessed a sharp breakout supported by rising volume and faced resistance near 4240. After this move, the price is retracing, offering a possible re-entry near a fresh demand zone.
Wait for price action confirmation inside the zone
Volume analysis adds confidence to the reversal
Risk management is key – always use SL
👉 Found this useful? Hit Follow to stay updated with breakout setups, educational content, and trade-ready ideas.
Let's grow smarter, together! 💡📊
Leave your comments/feedback(it will help)

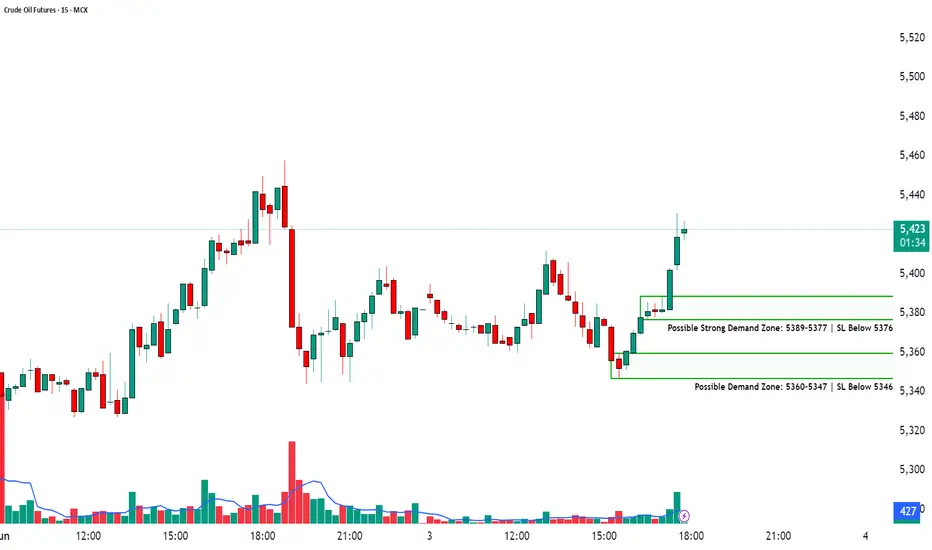
Demand Zone Breakdown + Trade Strategy📈CRUDE OIL FUTURES | 15-Min Chart Analysis
📆Date: June 3, 2025
Ticker: MCX:CRUDEOIL!
Chart Overview:
The chart highlights a bullish reversal from previously marked demand zones. Price sharply bounced with volume confirmation, indicating renewed buying interest.
Two demand zones have been marked for observation:
Possible Strong Demand Zone: ₹5389–5377 | SL Below ₹5376
Possible Demand Zone: ₹5360–5347 | SL Below ₹5346
Price is currently trading around ₹5,425, showing a significant up move post-demand zone test, suggesting buyer dominance in the short term.
Demand Zone Breakdown:
🟩🟩 Strong Demand Zone (₹5389–5377):
Strong volume-backed bullish engulfing formed after price dipped here.
Ideal zone for aggressive long entries with SL below ₹5376.
🟩 Lower Demand Zone (₹5360–5347):
Acts as deeper support and a conservative re-entry zone.
Long entries possible with SL below ₹5346 if retested.
How to Trade Demand Zones (Long Trade):
Wait for a retest of the zone.
Watch for bullish confirmation candles (hammer, bullish engulfing, etc.).
Enter long near the bottom of the zone.
Place SL just below the demand zone.
Stop-Loss Placement:
For Strong Demand Zone: SL below ₹5376
For Lower Demand Zone: SL below ₹5346
Targets: Use Risk-Reward Ratio
🎯 Use a 1:2 or 1:3 RRR to set logical target levels.
📌 Example: If risk is ₹10, target should be ₹20–₹30 above entry.
💡 Why Use Risk-Reward?
Sets clear and objective targets
Keeps emotions out of trading decisions
Helps maintain long-term profitability with disciplined risk control
⚠️ Risk Management Tip:
Always trade with a clearly defined stop-loss. Avoid impulse entries. Start with small quantities and increase size only with confirmation. Capital protection comes first.
📢 Disclaimer
This post is intended for educational and informational purposes only. It does not constitute investment advice or trade recommendations. Trading in commodities and financial markets involves risk. Please consult a SEBI-registered advisor before making financial decisions. The author is not SEBI registered and shall not be liable for any losses. Always use proper risk management and do your own research.
👉 Follow for more trade setups, chart breakdowns, and educational content to improve your trading edge. Stay informed. Trade smart. 📊📈
$ETH BULLS HAVE ENTERED ALREADY?From the chart we can say the bulls have entered around the green zone and trying their hard to push through the above red zone and and after every FUD the bulls just don't give up. What I see here is bulls would soon overpower the bears around the red zone and give a crazy upside spike clearing all shorts above. Now the question is how soon would that happen ?? Maybe a day or maybe a week or month. Sooner or later this would be cleared :). View is negated once closed below the green zone and broken the low of that candle. Rest you guys are smart enough to plan a trade and minimize your risk and enjoy the gains / learn with losses.
DISCLAIMER : VIEWS ARE PURELY EDUCATIONAL AND NOT AN INVESTMENT ADVICE IN ANY SENSE. PLEASE CHECK WITH YOUR FINANCIAL ADVISOR BEFORE FOLLOWING MY IDEAS BLINDLY

New opportunity; Nupur Recyclers ltd: 70% Roi ; SwingAdd this to watchlist and wait for entry.👁️🗨️
For short term investment ;
Leave a " Like If you agree ".👍
.
Wait for small retracement & daily candle to close above - "66".
Trade carefully untill ENTRY level.
.
Entry: 66
target:75-90-100-110-121
sl:57
major stoploss/ support: 50
.
.
Enter only if market Sustains above
"Yellow box" mentioned.
.
.
Don't make complicated trade set-up.📈📉
Keep it " simple, focus on consistency "💹
Refer our old ideas for accuracy rate🧑💻
Follow for daily updates👍
.
Refer old posted idea attached below.

Nifty Reversal Watch: Key Demand Zones & Moving Average in FocusAs a pure technical analyst, I rely solely on what the charts reveal, ignoring the noise of news and fundamentals. Charts tell the story in advance.
As a demand and supply zone trader, my primary focus is on identifying key areas where institutional activity is likely to drive price action. Today, we’ll analyze the Nifty 50 through the lens of demand zones and then complement it with traditional technical analysis using moving averages. This analysis aims to provide clarity on potential reversal zones and market behavior.
📊 Demand Zones: The Foundation of Analysis
Monthly & Quarterly Demand Zones : On the monthly timeframe, I’ve identified a critical demand zone. When we zoom into the quarterly timeframe, this zone aligns perfectly, creating a high-confluence area. These zones represent institutional footprints (Banks, mutual funds, etc. ), indicating where smart money is likely to step in. These are not just traditional lines or boxes on the chart; they are the footprints of institutions that control the market.
Significance of Demand Zones : Demand zones are areas where buyers are expected to dominate, often leading to price reversals. The confluence of monthly and quarterly demand zones increases the probability of a strong support level.
Current Price Action : Nifty is currently hovering near these demand zones, suggesting a potential bottom formation.
📊 Traditional Technical Analysis: Moving Averages
Now, let’s analyze the market through the lens of traditional technical analysts who rely on moving averages.
EMA 20 on Monthly Timeframe : The 20-period EMA on the monthly chart acts as a reliable support level historically. Since 2004, price reversals have consistently occurred near this moving average, marked by green circles on the chart.
EMA 20 as a Magnet : The EMA 20 on the monthly timeframe is equivalent to the 400-period EMA on the daily timeframe, representing the average price of almost 400 days. In trending markets, price always reverts to its average, making this a critical level to watch.
Historical Exceptions : While there are rare instances (marked by red circles) where Nifty has broken below the monthly EMA 20, the presence of demand zones adds an extra layer of support, reducing the likelihood of a significant breakdown.
Current Price Action : Nifty is currently near the monthly EMA 20, which coincides with the monthly and quarterly demand zones.
📊 Combining Both Approaches
High-Confluence Area : The alignment of monthly and quarterly demand zones with the monthly EMA 20 creates a high-confluence area. This increases the likelihood of a strong support level and a potential Bottom.
Risk Management : While the setup appears promising, it’s crucial to manage risk effectively. Always use strict stop-loss orders and avoid over-leveraging. Even high-probability setups can fail, especially when market sentiment is overwhelmingly negative.
📊 Conclusion
The Nifty 50 is at a critical juncture, with multiple technical indicators pointing towards a potential reversal or consolidation. The confluence of demand zones and the monthly EMA 20 provides a high-probability setup. However, always remember that no setup is foolproof, and risk management is crucial, it’s essential to remain cautious as markets can sometimes defy all technical setups.
This analysis is purely for educational purposes and is not intended as trading or investment advice. I am not a SEBI-registered analyst.
Lastly, thank you for your support.
"The market is a master of patience; trade with discipline, not emotion." 🚀📊

OPTIEMUS: A Powerful Demand Zone with Breakout Retest ConfluenceNSE:OPTIEMUS is setting up for something very interesting — both from a traditional technical perspective and through the lens of the supply and demand concept. If you're a trader who loves high confluence zones and clean structures, this analysis is definitely worth your attention!
Let’s break it down in a step-by-step, top-down format.
🔥 Weekly Chart Analysis – The Bigger Picture 🔥
When we zoom out to the weekly chart, something really striking stands out. The stock was in a tight consolidation phase for nearly 3 years. During this period, volume was consistently high — an early sign that big players were possibly accumulating.
Then came the breakout — massive volumes , strong momentum, and a sharp move to the upside. This rally gave exceptional returns to early entrants. But as expected, after such a move, the price pulled back.
Here’s where it gets exciting: the stock has now returned to the very same zone it broke out from. This level acted as a strong resistance multiple times in the past. And according to the Law of Polarity , a broken resistance often flips to become a strong support.
Not only is the price back to that breakout level, but it's also doing so with very low volume — a classic indication of a healthy retest rather than panic selling.
🧠 Supply and Demand Concept – Strong Confluence Zone 🧠
Now let's apply the demand and supply perspective — and this is where the setup gets really juicy.
A fresh and powerful weekly demand zone has formed exactly where the breakout took place. This zone has a clear imbalance — a strong leg-out candle with strong follow through. It’s a textbook demand zone with high conviction .
Even better, this demand zone is sitting right on the old resistance (now support) level — giving us double confluence .
And guess what? There is no supply zone visible on the weekly timeframe above the current price. That means the sky is clear — the price has room to fly, if it starts moving up from here.
🔎 Daily Chart Analysis – Zooming Into the Details 🔎
Moving down to the daily timeframe, we find even more reason to stay excited.
There’s a daily demand zone nested inside the weekly demand zone — a perfect case of multi-timeframe confluence . While this daily zone has been tested once, the follow-through was strong, indicating buyers are still active.
There is a nearby supply zone on the daily chart, but it’s already been tested. The next significant supply zone is about 42% above the current market price, while the risk to the distal line of the demand zone is just 9% .
That gives us a very attractive Risk to Reward ratio of 1:4.5 — which is highly valuable in technical setups.
📊 Key Technical Highlights
Weekly breakout retest with low volume pullback
Strong weekly demand zone with strong follow through
Demand zone formed at previous resistance – high confluence
No supply zone on weekly – open upside
Daily demand zone inside weekly – excellent multi-timeframe setup
Nearby tested supply on daily, next fresh supply 42% away
Risk to Reward ratio: 1:4.5
⚠️ Risk Management Reminder ⚠️
Even though this is a high-conviction setup, remember: no setup is guaranteed . Always use proper risk management, stop-loss strategies, and position sizing. Protect your capital — it's your trading ammo.
✨ Final Thoughts ✨
This NSE:OPTIEMUS chart is a great learning opportunity for anyone studying supply and demand or traditional breakout structures. Whether you’re new or experienced, setups like these reinforce the value of patience and technical clarity.
Lastly, Thank you for your support, your likes & comments. Feel free to ask if you have questions.
💡 "The market rewards those who wait patiently with a plan, not those who rush in with hope." 💡
🚫 This analysis is for educational purposes only. I am not a SEBI registered analyst and this is not a trading or investment recommendation.

A very good buying opportunity in pi network coin.PI coin is in a very good demand zone in daily time frame. Legout of the demand zone is very good. We can target 2.8 level in pi which is a supply zone. Trade has good risk to reward ratio of 1:4. Follow risk management
