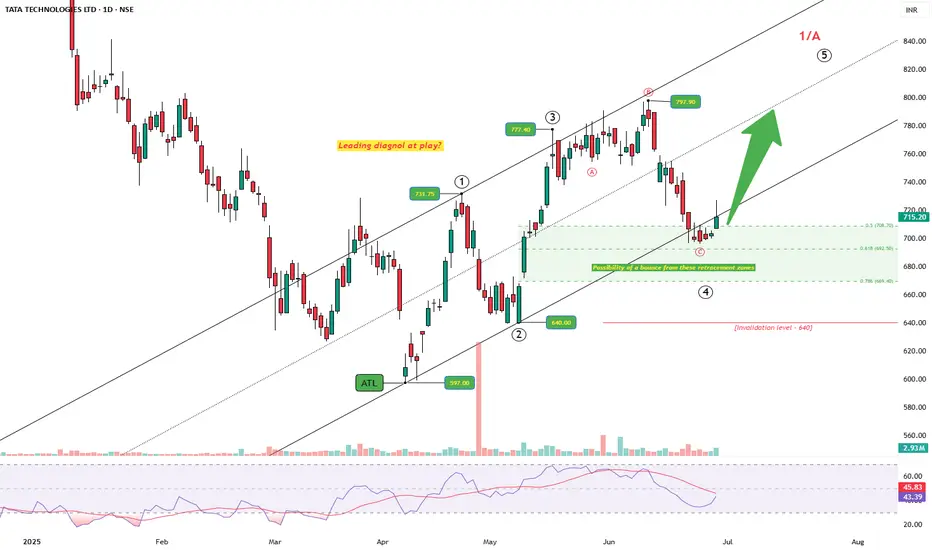
TATA TECH: Messy But Intentional — Diagonal at Work?After tagging the all-time low at 597, price started a steady climb. The structure unfolding looks like a potential leading diagonal, not a typical impulsive sprint. Wave 1 pushes up to 731.75, followed by a sharp drop to 640 — a classic deep Wave 2, but still holding above the origin. From there, Wave 3 stretches to 777.4, slightly longer than Wave 1, keeping things in check.
Then comes the messy drop — choppy, overlapping, three-legged, as Wave 4 of a diagonal. It lands right into the golden retracement zone, finding support between 0.5 and 0.786.
Now the price is bouncing back and is above 715, nudging towards the upper channel. If it sustains, Wave 5 could unfold next, aiming to breach the 797 high. But — and this is crucial — if price falls below 640, this structure breaks down. That would kill the diagonal count and force a rework.
RSI is curling up from oversold, hinting at renewed strength. Price, structure, and momentum — all are beginning to align. Let's see how the price strcuture unfolds in the coming week.
Diagonals
BankNifty - Possible Ending Diagonal Scenario with Twist Ending Diagonal with a twist.
As identified support zone 39550-39600. Index post falling from 40073 highs slipped to 39759 first / did some sideways & fall continued below 39759 to very important support zone & day low in the zone as 39564
Holding in support zone we expect Index to push once again 40K + target zone where you have to be careful.
---------------Not a trading call -------Consult your financial advisor before trading----------------

a hit is getting ready in ONGCa fall is getting ready may give a little raise or it can fall directly from here.
disclaimer : m not a semi advisor . plan ur trade accordingly to ur strategy. this video is for sharing knowledge and educational purpose only..

UBL Disinvestment & Downtrend Start !!TREND ANALYSIS & TRADE SETUP !
WAVE ANALYSIS !!
Follow Chart Instruction.
Do not be Hurry for entry.
Wait for Proper Entry Setup.
Buy/Sell with Best Risk Reward.
Educational Chart Only.
Wait for ENTRY CONFIRMATION !
Risk:Reward: 8-10 times.

TITAN : CASE OF ENDING DIAGONALThis is the most common diagonal that can be found out at the ending of a main trend or main correction. It consists of all the waves 1-2-3-4-5 in a single or multiple zigzags. They can be found placed at 5th wave of an impulse wave or can been seen as a wave ‘C’ of a corrective waves zigzags or flat. After the termination of the ending diagonal, a swift & a sharp reversal takes place which bring the prices back to the level from where the diagonal began.
Here in the stock of TITAN, this ending diagonal is placed as a wave-C of a corrective move.
As you can see in the chart, this pattern looks like an ending diagonal having wave-1 wave-2 wave-3 wave-4 & wave-5 . Each of these five waves are having an internal structure of three waves. So as per the wave analysis we can say the stock price of TITAN are going to fall . It has been seen that the target level of ending diagonal wave is the origin of the diagonal or the wave 2. So one should see a selling opportunity in this stock & look for the target zone as mentioned in the chart.
Bajaj FinservIt has given a diagonal breakdown which indicates 4900/4400 as possible areas before any major respite comes. On the other hand immediate resistance is at 6250 above that 6800.
