HINDALCO double top detectedDouble top with divergence detected in the Hindalco daily chart.
Bearish invalidation above 864.
Bearish continuation below 847.50 with downside targets of 838, 829 and 822 as early supporting key levels.
Double Top or Bottom

Kross cmp 176.22 by Daily Chart view since listedKross cmp 176.22 by Daily Chart view since listed
- Support Zone 156 to 166 Price Band
- Resistance Zone 180 to 192 Price Band
- Volume attempting sync with avg traded qty
- Bullish Double Bottom "W" with Support Zone base
- Falling Resistance Trendline Breakout has well sustained
- Resistance Zone neckline acting as good hurdle for Breakout
- Majority of the Technical Indicators seen trending fairly positive

NVIDIA: Double Bottom Flat at Support — Bounce Setup in PlayNVIDIA is currently testing a well-defined support zone near the prior lows, where price action is starting to compress rather than accelerate lower. The structure forming at this level resembles a double-bottom flat , suggesting that selling pressure is gradually losing momentum.
From an Elliott Wave perspective, the ongoing decline fits well as the final leg of a corrective phase. As long as this support zone holds, the odds favor the development of a Wave C move higher , which would mark a relief rally within the broader structure. The repeated defense of this level strengthens the case for a near-term bounce rather than an immediate breakdown.
That said, this is a decision zone . A clean hold keeps the upside scenario alive, while a decisive break below support would invalidate the flat structure and open the door for deeper downside. Until then, patience is key — let price confirm before committing.
Key Level to Watch: ~170
Above it: bounce potential
Below it: structure fails
Disclaimer:
Disclaimer: This analysis is for educational purposes only and does not constitute investment advice. Please do your own research (DYOR) before making any trading decisions.

Hindalco looking bewildered. Plan to trade either side.Hindalco is forming a double top formation on the weekly charts, showing some weakness in the stock as the market is more time in recoverying the fall of one week.
The stock has been in a good up trend and has reached 850 levels forming a base around 560-600 level zone i.e. Approx 30-35% return in 9 months.
Since June 2022, Hindalco has not taken out the previous low and recent gave the break out of the previous ATH and retested it.
Major trend for the stock is still bullish and there is a probability of continuing the same if the recent is taken out with good volumes, support the bullishness of the stock.
Bullish Scenario (A good HLHH formation is there in the stock).
Enter above 870 levels
Stop loss :- 825 (5%)
Target :- 1012 (16%)
R:R = 1:3
Buying a stock above 870 gives a bullish signal and can captured with proper SL and target.
Bearish Scenario (A double top pattern, bearish RSI divergence and Weekly 20 EMA break down).
Entry below 830 levels
Stop Loss :- 866 (4%)
Target :- 770 (7%)
R:R = 1:1.75
The targets can be trailed upto the levels of 740 levels while trailing the SL logically.
Wait for the stock to form some setup for the either side momentum and trade in the direction of the market.

ANANDRATHI Price ActionANANDRATHI trades at elevated valuations with strong earnings growth but is showing short-term weakness after recent peaks, making it a hold for positional traders with resistance ahead.
## Current positioning
Price hovers around 2900-2950 after a +1.9% daily gain, but sits below the 50-day MA near 3015, signaling mild distribution pressure in what remains a multi-year uptrend from 1600 lows.
## Momentum & structure
Bullish bias intact with price above 200-day MA (2440), healthy EPS growth supporting 70x P/E, but RSI cooling from overbought suggests consolidation or pullback toward 2800-2850 support before next leg.

#ADANIPOWER – Double Top Danger Zone!📉⚡ #ADANIPOWER 🚨
ADANIPOWER has formed a monthly double top 🔝 near the 179–183 (ATH) zone and is now slipping toward its rising trendline 📉
Price is also trading inside the September monthly candle (182.70–120.00). MCB or sustained close below 120 will signal major weakness ⚠️👇
If selling continues, price may head toward 112.50–124, 92–96 , and the breakout retest supports at 83–87 .
Bulls must defend the trendline to avoid a deeper correction 🛡️🔥
Resistances: 151.20 / 179–183 (ATH)
#ADANIPOWER #PriceAction #DoubleTop #ChartPattern #InsideBar #CandlestickPattern
📌 #Disclaimer: This analysis is shared for educational purposes only. It is not a buy/sell recommendation. Please do your own research before making any trading decisions.

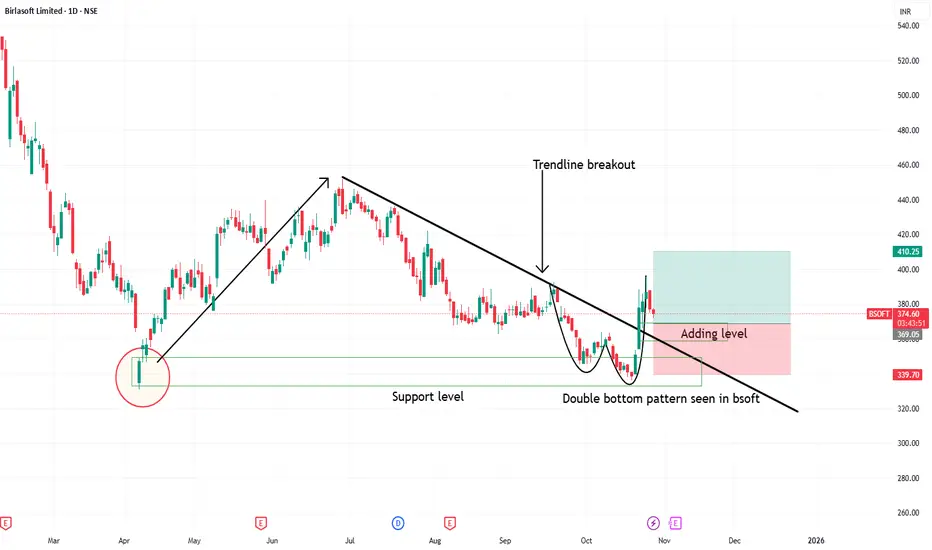
Double bottom in BSOFT1. Double bottom seen on support level
2. Trendline breakout seen with double bottom
3. Good fundamental stock can see upside movement in upcoming weeks
TVSMOTOR's DOWNTREND OVER? NSE:TVSMOTOR
Price was in a clear downtrend earlier with lower lows. But notice the change in behaviour :
The last big down-leg was not able to break the previous low – sellers lost strength.
From that low, price bounced up with strong volume, showing fresh buying interest.
After that, price has been holding around the same zone for ~15 days, moving in a tight range instead of falling back. This looks like supply getting absorbed near resistance.
NSE:CNXAUTO chart also gave initial breakout from tight range.
Heres the 30 min chart
For me this is a potential range-breakout setup:
Entry: Above the range high around ₹3,505 on a strong candle.
Stop-loss: Below the range low near ₹3,460.
First target: Around ₹3,560.
Extended target: Near the next resistance zone around ₹3,600+ if momentum continues.
Plan is simple – as long as price stays above the breakout level, bias is bullish. A breakdown back inside the range or below ₹3,460 will invalidate the idea.
Study the chart and then act with probabilities.
Keep Learning
Happy Trading.

Nifty - Expiry day analysis Dec 2The price faced resistance at 26320 and fall down towards support. Now the price is testing the double bottom support at 26120.
If the price opens gap down and shows a bullish sign around the 26040 zone, buy above 26060 with the stop loss of 26010 for the targets 26100, 26140, 26180 and 26220. Channel resistance will be there at the 26200 zone.
If the price opens flat, check how it is reacting around 26200 and if it shows bullish strength, buy above 26240 with the stop loss of 26190 for the targets 26280, 26320, 26360 and 26400.
Sell below 25980 with the stop loss of 26030 for the targets 25940, 25900, 25860 and 25820.
Please note if the price opens at the 25300 zone or 25200 zone and shows bearish strength, then it is a sell.
Expected expiry day range is 25900 to 26300.
Always do your analysis before taking any trade.

NIFTY MIDCAPNIFTY MIDCAP formed with DOUBLE TOP with DIVERGENCE with first target 14,403, and next support at 13,995. If it didn't take supports at 13,995 we can see further downside with FINAL TRAGET 13,900.

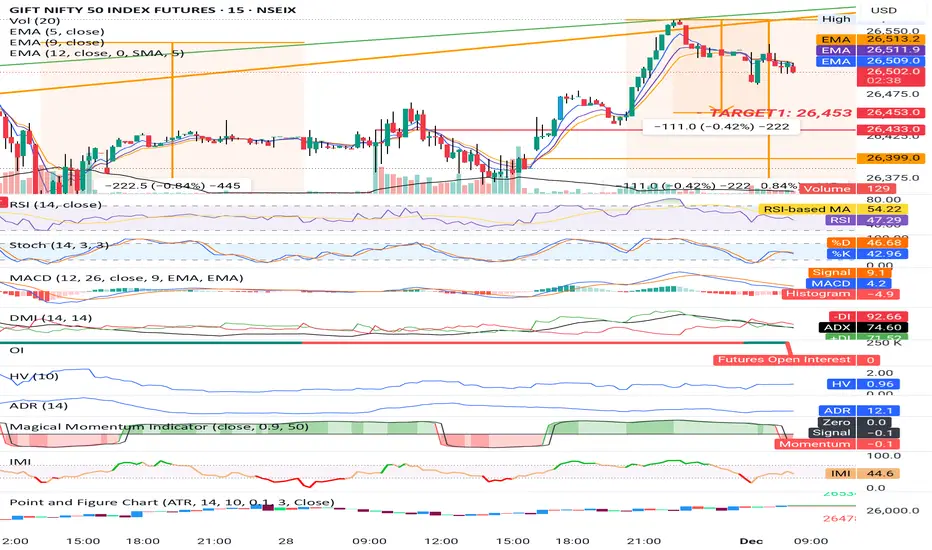
GIFT NIFTYGIFT NIFTY is moving at high but with very less volume. Which shows the correction in market. Gift nifty is showing bearish in short term view with target 26,400 and strong support atbsame level, if support was not taken we can expect further downside with a target of 26,120. If Gift Nifty took support and moves above 26,600 we can see upside target 26,800.
This is just my analysis
FLUENCE ENERGYFLUENCE ENERGY MADE DOUBLE BOTTOM with DIVERGENCE in monthly chart and also in process of forming CUP & HANDLE FORMATION, and it is at resistence level at $24, if it breaksout resistance at $24 we can expect to reach $30 & $44.
Chart analysis done on best of my knowledge, it may reach or may not reach targets :-)

Zcash Formed Triple TopZcash Formed Triple Top And Ready For Breakdown.
But Twist is, 0.38 retracement level. trend still strong
Ready short for setup
Reverse Scenario:
Break That Triple Top High
Any Bullish Pattern breakout in smaller time frame.
🧠 Always DYOR (Do Your Own Research)
⚖️ This is not financial advice or suggestion
👉 “Risk Is Real 💸 Stay Practical🚀”
💬 Please feel free to ask any questions (It's Free)

SOL DUMP TO THE $40YES, YOU SEEN RIGHT
CRYPTO:SOLUSD
SOL ready with multiple negative patterns.
1. all time resistance
2. triple top
3. cup and handle failure
First pattern is already activated and triple top near to active.
Reverse scenario
take support from major strong support. cup and handle breakout
🧠 Always DYOR (Do Your Own Research)
⚖️ This is not financial advice or suggestion
👉 “Risk Is Real 💸 Stay Practical🚀”
💬 Please feel free to ask any questions (It's Free)

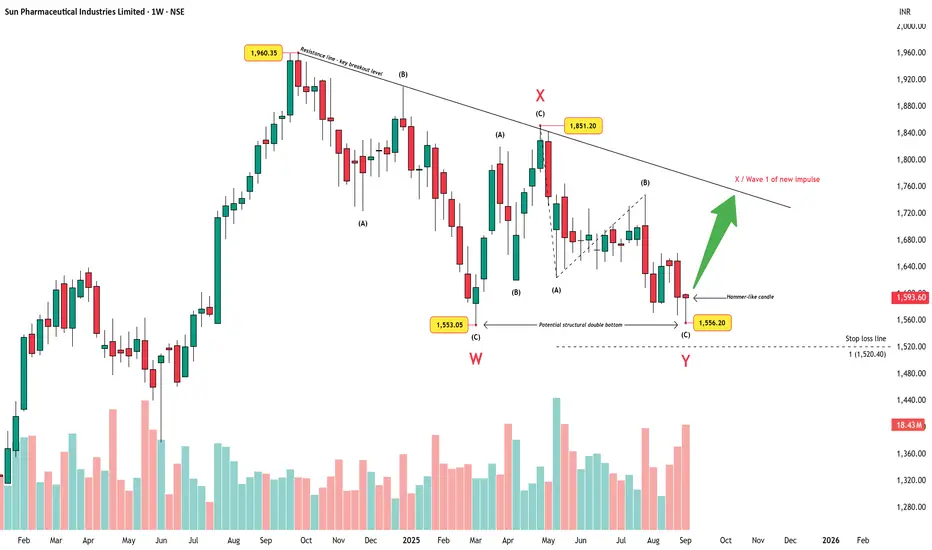
Sun Pharma – Double Bottom and Trendline Test AheadChart Summary
Sun Pharma’s weekly chart shows a completed W–X–Y corrective structure. Wave W bottomed near ₹1,553.05, followed by a corrective X at ₹1,851.20, and Wave Y terminating at ₹1,556.20. This final Y-leg has unfolded as an abc zigzag, respecting the larger corrective framework.
Price Action Highlights
A potential structural double bottom has formed around the ₹1,553–₹1,556 zone, hinting at possible exhaustion of the correction.
The latest candle is a hammer-like bar, suggesting demand stepped in around support levels.
Overhead, a major downtrend resistance line connecting the highs (₹1,960.35) to the swing X (₹1,851.20) remains the decisive breakout level.
A clear stop-loss line sits near ₹1,520.40, aligned with the 100% extension of Wave A inside Y. A break below this level invalidates the bullish case.
Volume Perspective
Recent selling has come with a volume spike, often seen during exhausation selling phases. If volume eases on follow-up candles while price holds above the support zone, it strengthens the case for a reversal.
Outlook
If price can sustain above the ₹1,553–₹1,556 support cluster and eventually break the trendline resistance, it may confirm the end of the corrective phase and open the door for a new impulsive sequence higher. Failure to hold the stop-loss zone, however, would negate this view and suggest further downside.
Disclaimer: This analysis is for educational purposes only and does not constitute investment advice. Please do your own research (DYOR) before making any trading decisions.
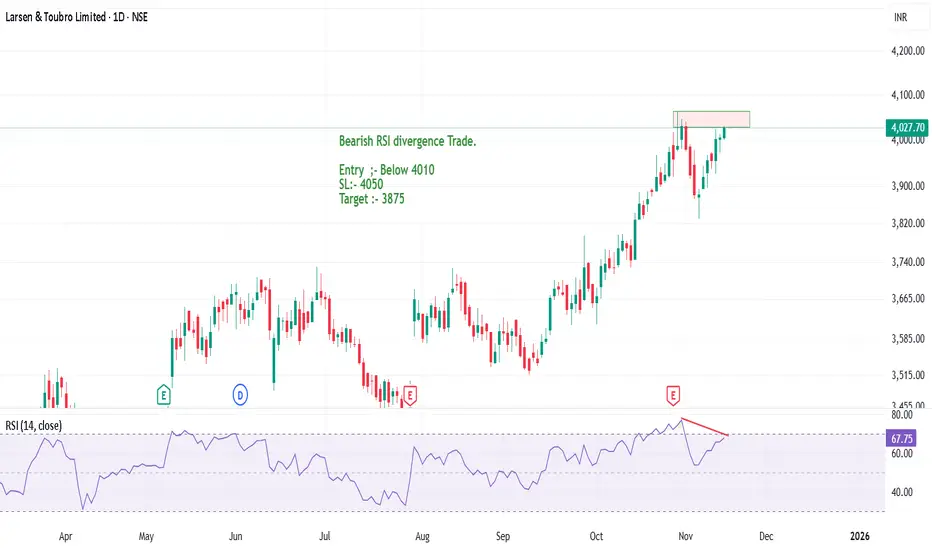
L&T forming a new high or Double Top pattern?Larsen & Toubro is showing a strong bearish RSI divergence on the daily charts. There can be an opportunity to sell the stock in coming trading sessions.
The stock has performed fabulously and good returns has been yeilded by the stock.
If there is a bearish price action, a double top pattern confirmation, good R:R trade can be capture in the stock.
Entry :- Below today's low (4000)
Stop Loss :- 4055
Target :- 3875
A swing trade can be initated in the stock with Target 1 as 3875 and trailing SL for next target upto 3780.
Target 2 can also be made with the help of the 50 EMA.
In case price tries to form a new high is can be shorted only when there is some negative sentiment and price action in the stock.
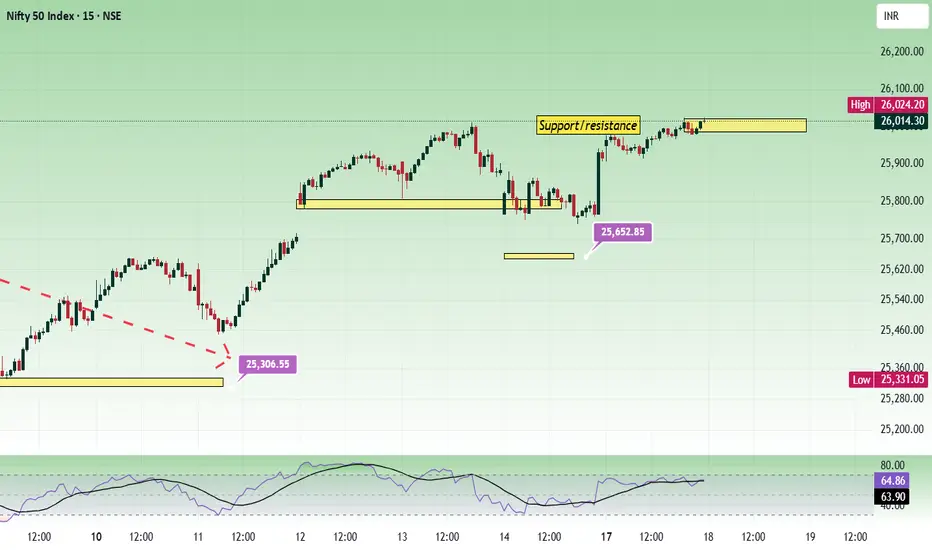
Nifty - Expiry day analysis Nov 18The price was bullish, but the movement was slow today as it was nearing the psychological zone of 26k. And we can see a small consolidation around this area, double top resistance. Sustaining above 26020 is important for further moves.
Buy above 26020 with the stop loss of 25960 for the targets 26060, 26100, 26160 and 26200.
Sell below 25860 with the stop loss of 25910 for the targets 25820, 25780, 25720, 25680 and 25640.
The expected expiry day range is 25800 to 26200.
Always do your analysis before taking any trade.
#Silver Alert: Double Top Breakdown Incoming?🚨 Double Top on XAGUSD daily chart:
1️⃣ First Top: Bearish Engulfing
2️⃣ Second Top: Dark Cloud Cover
Pattern confirms DCB 🔻 below $45.55 , 🎯 targeting $36.71 .
🚧 Resistance: $52.32 - $54.49
🛡 Support: $50.62, $49.38 - $48.91, $47.17 - $46.90
⚠️ Major sell-off potential. Longs only above Double Top high after 2 consecutive closes.
#Silver #XAGUSD #DoubleTop #TechnicalAnalysis #BearishReversal #ChartPatterns #CandlestickPatterns #PriceAction
📌 #Disclaimer: This analysis is shared for educational purposes only. It is not a buy/sell recommendation. Please do your own research before making any trading decisions.


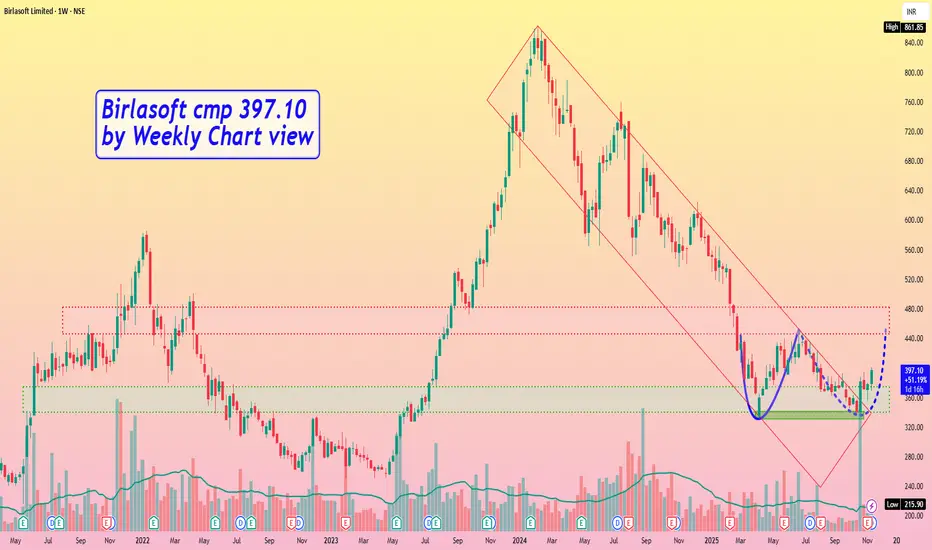
Birlasoft cmp 397.10 by Weekly Chart viewBirlasoft cmp 397.10 by Weekly Chart view
- Support Zone 340 to 375 Price Band
- Resistance Zone 446 to 482 Price Band
- Falling Price Channel Breakout seems been sustained
- Bullish "W" Double Bottom seems to be in the making process
- Fresh Breakout subject to Resistance Zone crossover and closure above it for few days
As posted earlier 1:2 done As posted earlier i was sitting long in Btcusdt, 1:2 is done and i am out of the trade with 70% qunatity.
BINANCE:BTCUSDT
Like and follow for these types of trade ideas !!
And Join me with my journey so you can make yours 👍
Disclaimer: This is not financial advice. Please consult your financial advisor before making any investment decisions.

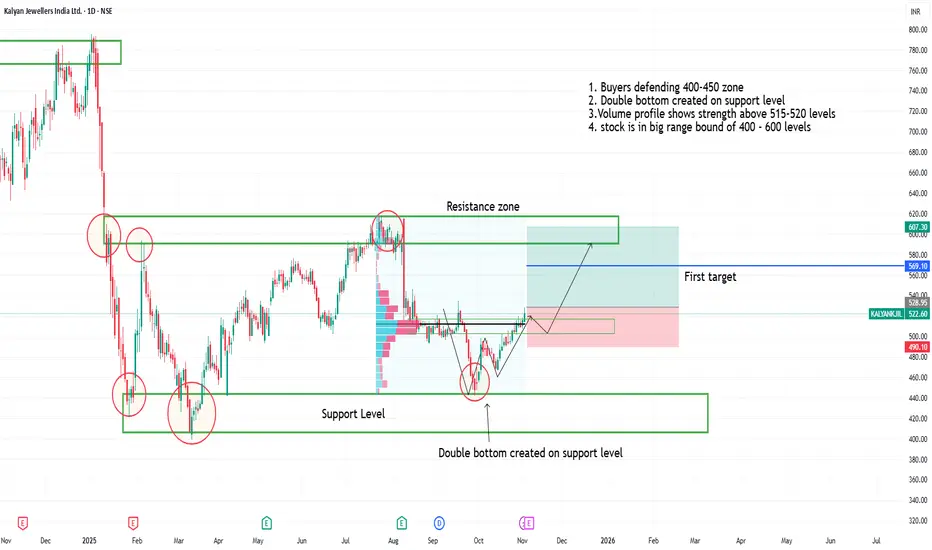
Double bottom in kalyan jwellers on support level1. Buyers defending 400-450 zone
2. Double bottom created on support level
3.Volume profile shows strength above 515-520 levels
4. stock is in big range bound of 400 - 600 levels
5. One can watch for upside movement
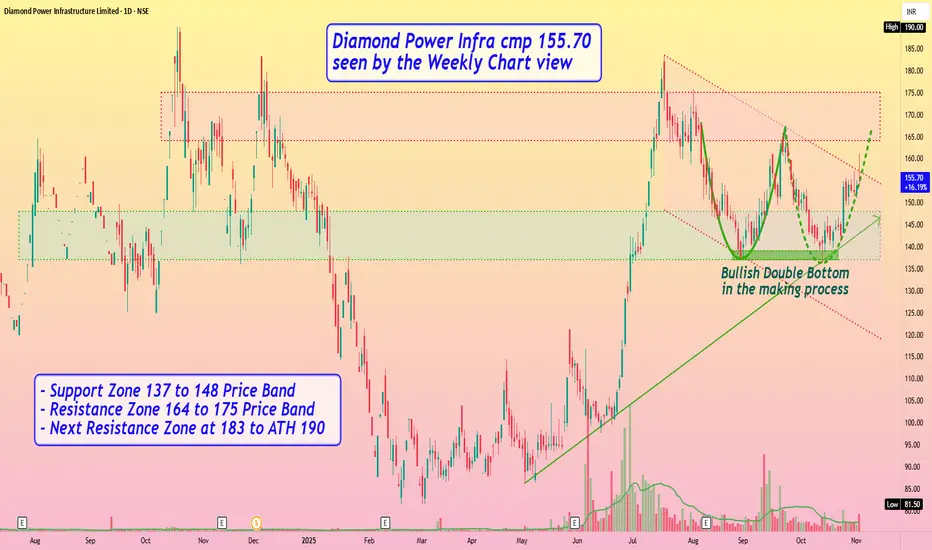
Diamond Power Infra cmp 155.70 seen by the Weekly Chart viewDiamond Power Infra cmp 155.70 seen by the Weekly Chart view
- Support Zone 137 to 148 Price Band
- Resistance Zone 164 to 175 Price Band
- Next Resistance Zone at 183 to ATH 190
- Bullish Double Bottom in the making process
- Rising Support Trendline seems well respected
- Volumes spiking regularly by close sync with avg traded qty
- Falling Price Channel Breakout seems to be in the making process