Powergrid inside Perfect Descending Parallel Channel PatternPowergrid seen travelling perfectly inside the descending channel pattern, taking perfect resistance and support at the channel (from April 2025 till now)
Now seen at the perfect crucial point where it can either move bullish or bearish in the upcoming days
Bearish view gets cancelled on getting past the red dotted line...till that we can't be bullish on Powergrid!!!
Just add to the watchlist and let's watch how its going to move!!!!
will update once the decider move occurs!!!!
Just Sharing my view ...not a tip nor Advice!!!
Thank you!!!
Dowtheory

Sbicards looks bullish?!!!yes!!!
Sbicards has been travelling inside a expanding channel pattern making successive highs and higher highs and lows and higher lows.
In daily time frame too stock is seen bullish
View changes to bearish on making the lower low(sl level- 829.65)
better to enter after 15 min Volume breakout out as shown
Nothing much more to explain as everything seems clear on looking @ chart!!!
Just my view...not a tip nor advice!!!!
Thank you,
mmjimm

Siemens Down to Support zone??!!Siemens has been travelling inside a Ascending Expanding Channel Pattern(bold yellow line) from March 2025( making higher highs and higher lows )
Now it is in the down move to making a higher low (to support level)
This down move is being done by market in the form of Descending channel pattern making lower highs and lower lows(shown as purple line)
There is also a Head & Shoulders pattern ...which has given BREAKDOWN with Good Volume support (yesterday-13-10-2025)
Siemens is looking to take support at 2900 levels(2920)
SL can be bit choppy (either the high of Breakdown candle/high of right shoulder)
Bearish view can be negated once the red dotted line breaks!!!
Let's wait and watch!!!
Thank you!!!!
Just my view...not a tip nor advice!!!!

Buy MCX#MCX (Multi Commodity Exchange) Technical Analysis Summary
Current Market Price : ₹8,051.50
Dow Theory Analysis
The chart perfectly demonstrates **Dow Theory principles** in action:
Bullish Structure
Higher Highs : Clear progression from previous peaks
Higher Lows : Each dip maintains above previous lows
Fresh Higher High : Recent peak establishing new uptrend confirmation
Key Technical Levels
Daily Resistance : 8,339.00
Weekly Resistance : 8,901.50
Previous ATH : 9,115.00
Multiple Pattern Confirmations
1. Flag & Pole Pattern : - Bullish continuation pattern Suggests upward momentum continuation
2. Harmonic Pattern :
- Trading near point B
- Activation Level : 8,148.50
- 1st Target : 9,115 (Previous ATH)
- 2nd Target : 9,964 (Current projection)
Do your own analysis before Initiating any Trades.

SchaefflerInd - Technical Analysis#Schaeffler India - Technical Analysis Report
Current Price: 4,141.10 / Prev ATH @4951.
Trade Setup Overview
Basic Dow Theory : Stock is making Higher High - Higher Low by Breaking previous ATH decisively and stock is down to strong Demand Zone for retracement.
Stock is in consolidation before breaking previous ATH & currently forming Flag & Pole Pattern.
Entry on breakout above resistance 4,200-4,300
Conservative Stop Loss at 3,800 | Tight SL near 4,000
Tgt 1: 4,602
Tgt 2: 4,776
Tgt 3: 5,026
Grand Flag & Pole Target: 5,495.
Technical Highlights:
- Trend Reversal confirmed by breaking previous High on May 2025 around 2,800
- Price consolidating after strong recovery rally
- Trading above key moving averages
- Breakout above 4,300 resistance could trigger momentum toward 4,600 / 5495
Risk-Reward:
Favorable R:R with potential 11-33% upside vs 3-8% downside to stop loss levels.

VBL Looking Bearish??!!!VBL - On Weekly timeframe,
Inverted cup&handle pattern and a breakdown visible!!! (shown below)
On Dailytimeframe,
VBL is travelling inside a Descending channel pattern making highs and lowerhighs...lows and lowerlows...
SL & Target levels shown @ chart!!!
Let's wait & watch!!!
Thank you!!!
Just my view...not a tip nor advice!!!!

NTPC seems Bearish !!NTPC technically is getting ready to take support at 310 range ....if 310 too gets broken, major support at 299.
Rounding top fits perfectly and as a result we can expect the down move in the next few days.
Let's wait and watch ...how it moves!!!!
Just my view...not a tip nor advice!!1
Thank you!!

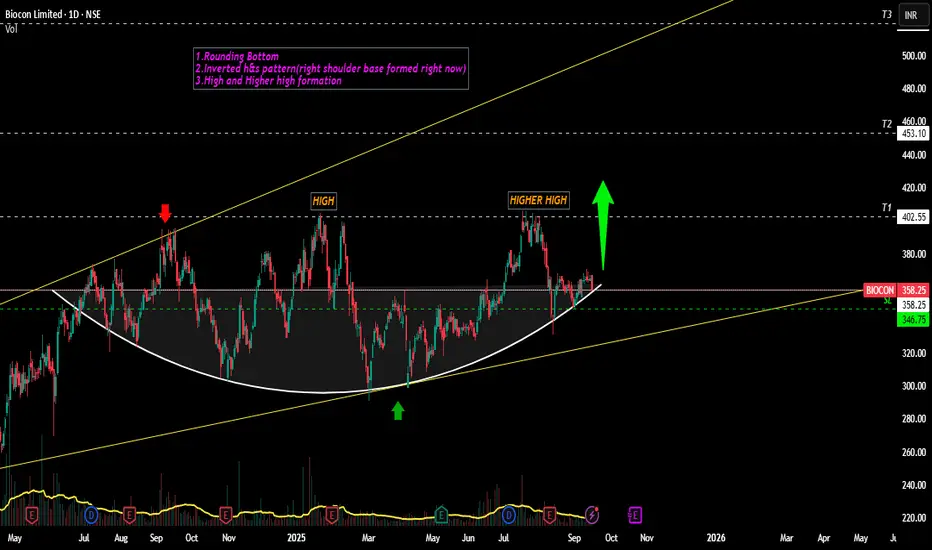
Biocon likely to see Bulls Surge!!!Yes, Charts give the indications for the upcoming long move in Biocon
Below is the daily timeframe wholesome look -
( Expanding Triangle pattern above chart)
(Inverted H&S pattern - above chart)
other points ,target, sl levels mentioned in the chart.
We can expect a Breakout (most likely)/Breakdown(less likely) by this week!!!!
Just sharing my view...not a tip nor advice!!!
Thank you,
mmjimm
Dow Theory Update and Nifty AnalysisIn this video, we have explained the following points -
* A new Dow Top "A1" has been created by Nifty50.
* The significance of the new Dow Top has been explained.
* The current structure of Nifty has been discussed.
* The importance of waiting for the next candle and the current key support level has been highlighted.

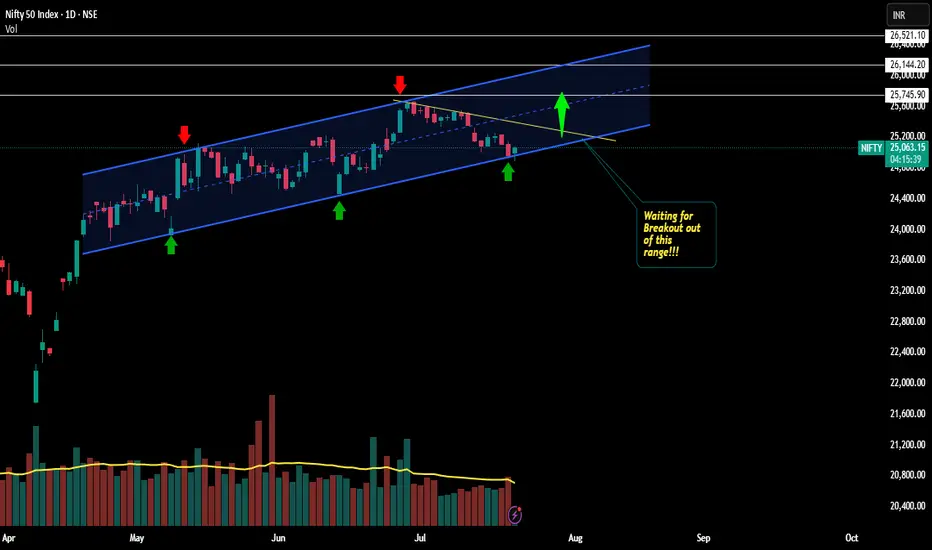
Nifty inside a Parallel channel !!!Yesssss!!!
Chart patterns depict me to go with the above titled view
Nothing much to explain here... .Nifty has been travelling in a parallel channel making higher highs and higher lows
Right now, its is at the bottom support of the parallel channel getting ready for the next leg of upmove...
If this holds good, it may break ATH!!!
Let's wait and watch!!!!
Target levels mentioned as white lines ,Day candle closing out of the channel welcomes bears into play.
We can wait for the 2 HR/DAILY breakout out of the yellow trendline and make our entry and setting SL at the low of the Breakout candle....
will update once it breaks out!!!
This is just my view...not a tip nor advice!!!
Thank you!!!
Powergrid - 10% Upmove possible?!!!Chart patterns suggest me the above titled opinion
1. Monthly chart shows a Mother baby candle (feb and march 2025)
2. Weekly chart too shows a good inside bar candle with good volume support and Breakout visible (shown below)
3. In daily time frame, there is an expanding channel pattern... . Higher high formed indicates a bulls edge .
4.Let's wait for the Breakout and enter the trade
5.Target levels mentioned @ chart.
This is just my opinion...not a tip nor advice...
Thank you!!!!

Gold Trading Strategy XAUUSD July 18, 2025
Yesterday's trading session, after a strong correction to the 3310 area, the gold price increased sharply again.
Basic news: FED Governor Christopher Waller supports a 25 basis point interest rate cut later this month. The number of weekly unemployment claims in the US fell to 221,000, lower than the forecast of 233,000 and the previous period's level of 228,000; data shows that the US labor market remains stable, strengthening the economic growth outlook.
Technical analysis: The M30 and H1 time frames have not clearly shown the trend of the gold price, when the tug-of-war between buying and selling is quite large. However, in the H4 and D1 frames, there are signs that the gold price will increase again. If the gold price continues to trade in the 3290 - 3300 area, it shows a new multi-frame compression process. This area is very important as it can be a trading point that brings us great profits.
Important price zones today: 3318 - 3323, 3287 - 3292 and 3352 - 3357.
Today's trading trend: BUY (hold).
Recommended orders:
Plan 1: BUY XAUUSD zone 3318 - 3320
SL 3315
TP 3323 - 3233 - 3343 - 3353.
Plan 2: BUY XAUUSD zone 3288 - 3290
SL 3285
TP 3293 - 3303 - 3320 - 3340 - Open.
Plan 3: SELL XAUUSD zone 3353 - 3355
SL 3358
TP 3350 - 3340 - 3330 - 3310.
Wish you a lucky, safe and profitable weekend trading day.🌟🌟🌟🌟🌟

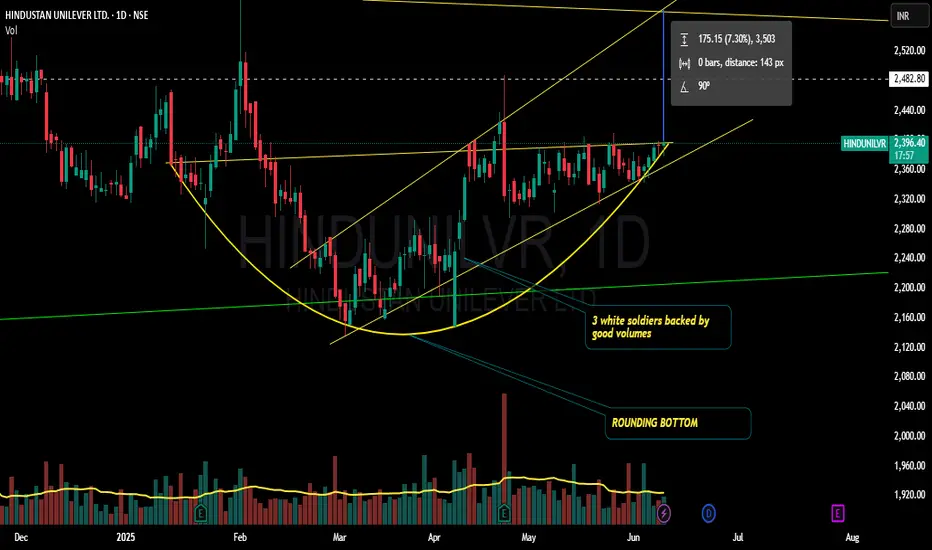
Hindunilvr longing for a breakout??!!Chart patterns inflict me the above titled opinion
Breakout can be expected as it has not breached the low made on 25th april 2025 and has been consistently making higher highs and higher lows(seen clearly on hourly charts)
Entry after the breakout.. ...
Godrejcp also seen for a up move!!!!
will update once it breaks out!!!!
Thank you.
This is just my opinion...not a advice!!!!
Nifty50 Dow TheoryDOW THEORY Update-
After New Dow Top "Y", now we have made new Dow Bottom "Z" as well.
* W is the previous significant swing high here.
* X is the current significant swing low here.
* Y is the current significant swing high here.
* Z is the current significant swing low here.

Dow Theory on Nifty50 chartDOW THEORY UPDATE-
After New Dow Bottom "X", now we have made new Dow Top "Y" as well. By seeing market condition, I feel X can be broken soon but if we cross the Dow top "Y" first then that will ends the downside officially.
W is the previous significant swing high here.
X is the current significant swing low here.
Y is the current significant swing high here.

Dow Futures Trading Strategy 05th December 2024Trading Strategy for Dow Futures:
Buy Strategy:
Entry Point: Enter a long position (buy) above the high of the candle that closes above 45230 on a one-hour timeframe. This means if a one-hour candle closes above 45230, you will buy once the price exceeds the high of that candle.
Stop Loss: Set a stop loss slightly below the low of the breakout candle to manage risk. For instance, if the breakout candle has a low of 45100, you might set your stop loss at 45090 to protect your capital.
Target: Determine your target based on historical resistance levels or a risk-reward ratio. For example, if you're risking 140 points (45230 to 45090), aim for a reward of at least 280 points (e.g., a target of 45510).
Sell Strategy:
Entry Point: Enter a short position (sell) below the low of the candle that closes below 44870 on a one-hour timeframe. This means if a one-hour candle closes below 44870, you will sell once the price drops below the low of that candle.
Stop Loss: Set a stop loss slightly above the high of the breakdown candle. For example, if the breakdown candle has a high of 45000, you might set your stop loss at 45010 to mitigate risk.
Target: Determine your target based on historical support levels or a risk-reward ratio. For example, if you're risking 140 points (44870 to 45010), aim for a reward of at least 280 points (e.g., a target of 44600).
Risk Management:
Use Stop Losses: Always use stop losses to protect your capital and limit potential losses.
Position Sizing: Never risk more than a small percentage (e.g., 1-2%) of your trading capital on a single trade.
Regular Review: Continuously monitor the market and adjust your strategy based on evolving conditions and new information.
Market Context:
Economic Indicators: Pay attention to key economic indicators such as employment data, GDP figures, and interest rate announcements that can impact Dow futures.
Geopolitical Events: Be aware of geopolitical events and developments that can cause significant market volatility.
Disclaimer:
Trading in financial markets involves substantial risk of loss and is not suitable for every investor. The strategies and opinions expressed are those of the author and do not necessarily reflect the views of Microsoft. Users should perform their own research and consult with a financial advisor before making trading decisions. Past performance is not indicative of future results.

SEQUENT SCIENTIFIC By KRS ChartsDate: 4th July 2024
Time: 10:42 AM
Why Sequent Scientific ?
LH- Lower High, LL - Lower Low
HH- Higher High, HL- Higher Low
1. Applied Simple Dow Theory from year 2022 , It was consistently making LHs and LLs and very first time in Feb 2024 it breaks previous high and makes new HH , which is considered as a beginning of reversal.
2. After that on 3rd June Price action made new HL for first time without breaking previous LL level and moving upwards with strong candles and volume.
3. Meanwhile, on weekly TF price took support from 100EMA too and makes strong upward moves.
Target 1 - ~203 Rs.
Target 2 - ~260 Rs.
SL- Weekly Closing below 100EMA

QUESS CORP By KRS ChartsDate: 23rd July 2024
Time: 7:20PM
Why Quess Corp?
1. Fundamentally Good Company with decent P/E Ratio.
2. Since Quess Corp listed it, movement is sideways within specific range if we check bird view of it.
3. According to Dow Theory, it was making LH LL (Downtrend) but very first time in 2023 it made Higher Low and moving continuously upside and now sustain price near All-time resistance.
Once it Break this resistance there is Buy Trade for Quess Corp for new Higher High ~1000Rs.
And for Early Entry individual can enter small Qty at current price with SL of 591 Rs.

Bandhan bank is in reversal mode.Bandhan Bank is giving reversal sign on chart, Dow theory change making Equal low to Higher Low. There is huge volume in reversal move. It may test 260 to 290 soon.

Trident NSE Date - 22 March 2024
Time - 10:30 AM
WHAT is,
1. VAH& VAL- The upper limit of the Value Area is called Value Area High (VAH), while the lower limit is referred to as Value Area Low (VAL). These levels can serve as potential entry and exit points for trades.
2. POC- The price level for the time period with the highest traded volume.
-As we can see, since last year Trident is doing HH and HL. (Bullish)
-After using Fixed Range Volume Tool for both long and medium time periods we have find that 36-37 Rs is where long term VAH volume and medium term POC + 100 Ema is also meeting at same price and creating strong support.
-Today's price movement is confirming strong support at 36-37 Rs.
So, with a SL of 32.40 (Prev HL) We can LONG Trident for Medium Term.
Thank You!
Have A Good Day!

MuthootFin Priceaction BullishMuthoot On a Higher Timeframe making significant
Higher High and Higher Low
Stock rejected from Previous High and came down for retracement.
Stock Retested the Previous Breakout level and currently forming a
Strong #PriceAction.
So the Stock shd move from Higher Low to Previous Swing High then New ATH.

#JSW ENERGY SHORTTERM BULLISH#JswEnergy moving strongly by making proper structure, Moving up without making much noise. Strong monthly breakout and Holding.
Good to hold for Swing to Shortterm trades.
Do ur own analysis with proper Stoploss

Breakdown occurredLast update There is now a break down of the dow theory it went back up from sup but still stuck in a range
