Bccl ipo day high 45 is next level of rally Today bccl made a debut and gave nearabout 90-100% of returns to there lucky investors.
Stock price made a high of 45 and then shown profit booking towards 40 rs level.
Now 45 is a good resistance, once that is taken out we may see more upside.
But looking at today's move after listing more profit booking and consolidation is anticipated.
Also looking at fundamentals stock is now trading near to 8-9 pe multiple which is close to it's parent coal India so doubling and all is not expected.
#BCCL
Earnings

ICICI Bank: Stable Results, Critical Technical TestICICI Bank Limited announced its Q3 FY26 results after market hours, delivering a quarter marked by stable core performance but profits below market expectations . While the balance sheet remains healthy, the earnings profile does not materially alter the broader technical structure visible on the chart.
This makes it important to assess earnings and price action independently , and then align them within a broader market structure.
Earnings Snapshot — Key Metrics Explained
Profit After Tax (PAT)
PAT: ₹11,318 crore
YoY comparison: Lower than ₹11,792 crore
Outcome: Below analyst expectations
What PAT means:
PAT represents the company’s net profit after all expenses and taxes . A miss here does not imply business weakness, but it does indicate that profits fell short of what the market had already priced in .
Net Interest Income (NII)
NII: ₹21,932 crore
Growth: +7.7% YoY
What NII means:
NII is the difference between interest earned on loans and interest paid on deposits . It reflects the core earning power of a bank . ICICI Bank’s NII growth confirms steady loan growth and healthy lending activity .
Net Interest Margin (NIM)
NIM: 4.30% (stable)
What NIM means:
NIM measures how efficiently a bank converts lending into profit . Stability here suggests no margin pressure and continued pricing discipline.
Provisions — The Key Drag
Total provisions: ₹2,556 crore
Includes ₹1,283 crore additional standard asset provision following an RBI supervisory review
What provisions mean:
Provisions are buffers set aside to absorb potential future losses . In this quarter, the increase was regulatory in nature , not driven by deterioration in credit quality.
However, higher provisions directly reduce reported profits , which is why markets tend to react cautiously.
Asset Quality
Gross NPA: 1.53%
Net NPA: 0.37%
Provision Coverage Ratio: 75.4%
What NPAs mean:
Gross NPA shows total stressed loans
Net NPA reflects stress after provisioning
These numbers confirm that asset quality remains strong , with no visible stress on the balance sheet.
Technical Structure — Where Price Stands
From a technical perspective, price continues to trade within a larger corrective structure after forming an all-time high near 1500.
The recent rally appears counter-trend , pushing price into a well-defined supply zone
The 1445 region is acting as resistance
Momentum has improved, but RSI remains below bullish expansion territory , indicating the absence of impulsive strength
What RSI tells us:
The Relative Strength Index measures momentum. Sustained bullish trends usually hold RSI above 60–65 . Readings below this zone often accompany corrective or relief rallies .
Wave Context (High-Level View)
The broader price action still fits a corrective W–X–Y structure
The current advance aligns with a counter-trend X-wave
Unless price accepts decisively above 1500 , the structure continues to allow for a Y-leg decline toward lower support zones
This keeps the risk-reward skewed toward patience rather than aggressive positioning at current levels.
Key Levels to Watch
Major resistance / bearish invalidation: 1500
Immediate supply zone: 1445
Target support – 1: 1325
Target support – 2: 1265
Final View
Fundamentally, ICICI Bank remains a high-quality franchise with improving asset quality, stable margins, and healthy loan growth. However, the profit miss driven by higher regulatory provisions does not provide a strong catalyst for a fresh impulsive breakout.
Technically, price is reacting exactly where it should — into resistance within a corrective structure . Until there is clear acceptance above 1445/1500 , the broader setup remains range-to-corrective , not trend-expansive.
Disclaimer: This analysis is for educational purposes only and does not constitute investment advice. Please do your own research (DYOR) before making any trading decisions.

TCS: Quietly ConstructiveQuarterly Results Snapshot
TCS reported a better-than-expected quarterly performance , with EPS of ₹37.14 versus Dalal Street expectations of ₹35.97 . Revenue also came in marginally higher at ₹670.9 billion compared to estimates of ₹668.3 billion .
While the beat is not outsized, it does clear a low expectations bar and provides a supportive fundamental backdrop as price trades near key technical levels.
Technical Structure
On the daily chart, price action continues to respect an impulsive Elliott Wave structure , with a clear extension in Wave 3 . The ongoing pullback remains orderly and corrective, fitting well as a Wave 4 consolidation rather than a trend failure.
The stock is holding support at the 50-DMA and closed above the 200-DMA , a combination that typically favors continuation.
RSI holding above the 50 zone suggests momentum remains biased to the upside, even as price pauses.
Levels That Matter
A sustained move above the recent swing highs would strengthen the case for a Wave 5 advance toward the 3,377 zone .
The bullish structure remains valid as long as price holds above the 3,070 invalidation level .
Conclusion
With earnings clearing expectations and the technical structure remaining constructive , TCS appears to be setting the stage for the next leg higher . While confirmation is still required, the balance of evidence currently leans in favor of continuation rather than reversal .
Disclaimer: This analysis is for educational purposes only and does not constitute investment advice. Please do your own research (DYOR) before making any trading decisions.

Indus Towers Ltd – Breakout Trade IdeaIndus Towers has given a breakout from a downward sloping trendline , indicating a possible trend reversal. The move is supported by increasing Put writing and Call unwinding at the 400 strike , showing strong support and bullish sentiment in the options data.
The stock is also backed by good quarterly results , adding strength to the price action.
Trade Setup
Buy: ₹408 (Current Market Price)
Target: ₹450
Stop Loss: ₹390 (Closing basis)
View: Bullish above ₹400
Risk–Reward: Favorable

Modern Insulators - Rounding Bottom PatternModern Insulator is heading towards a 100% gain. Factors:
1. Rounding Bottom Pattern on weekly time frame - look at last week's bullish candle
2. All Time High Breakout - ATH breakout from 2024 price, after so many rejections it has finally given a breakout
3. Company has shown growing revenue and profit trends, QoQ profits are increasing. 50% of revenue from exports.
4. Electrification of Indian Railways - Modern insulators is one of the largest supplier of insulators to railways.
Given the above, this stock looks strong!!
Keep following @Cleaneasycharts as we provide Right Stocks at Right Time at Right Price!!
Cheers!!

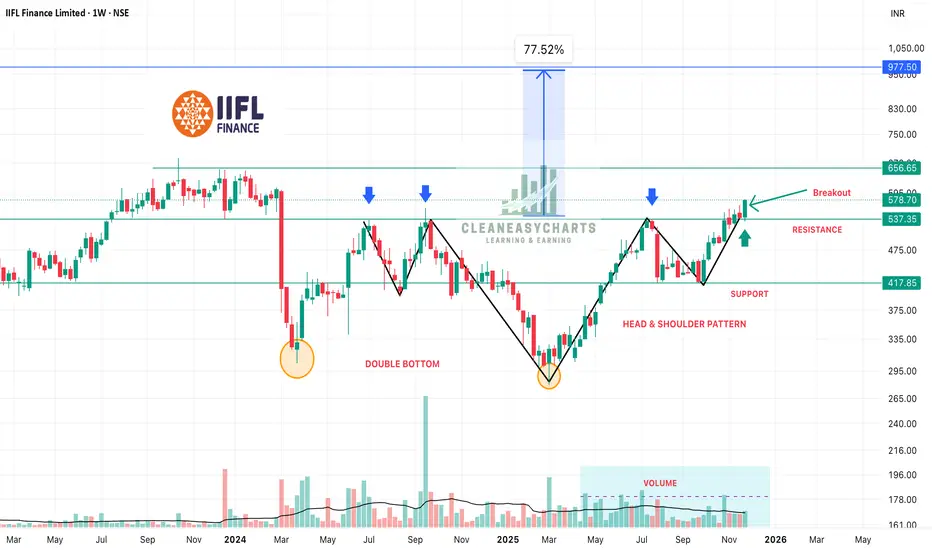
IIFL Finance - Double Bottom & Head & Shoulder PatternIIFL is read to rock by 70%-80% rise from current price on account of following:
1. 52% increase in QnQ profits
2. Double Bottom Pattern on Weekly Time Frame
3. Inverted Head & Shoulder Pattern on Weekly Time Frame
4. Weekly Breakout is already done - see last weeks candle
5. Volumes are steady
Keep following @Cleaneasycharts as we provide Right Stock at Right Time at Right Price.
Cheers!!!
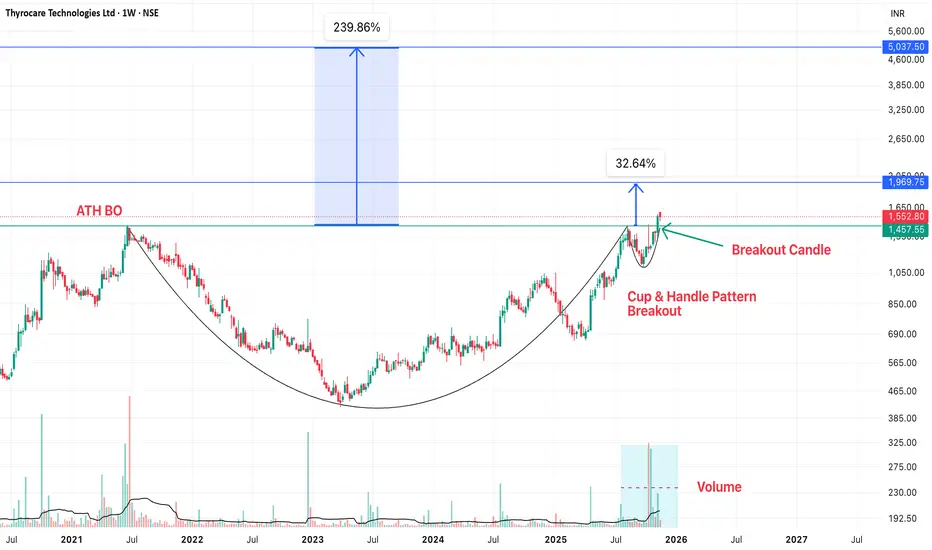
Thyrocare - Cup & Handle Breakout on Weekly Time FrameThyrocare has given a Cup & Handle Breakout on weekly time frame. Factors which will lead to 40%-200% return:
1. Cup & Handle breakout pattern
2. ATH Breakout
3. Volumes has picked up at Breakout
4. Fundamentally, super results in Q2 and best sales ever
Stock looks super fundamentally and technically. Must in your portfolio.
Keep following @Cleaneasycharts as we provide Right Stocks at Right Time at Right Price.
Cheers!!!
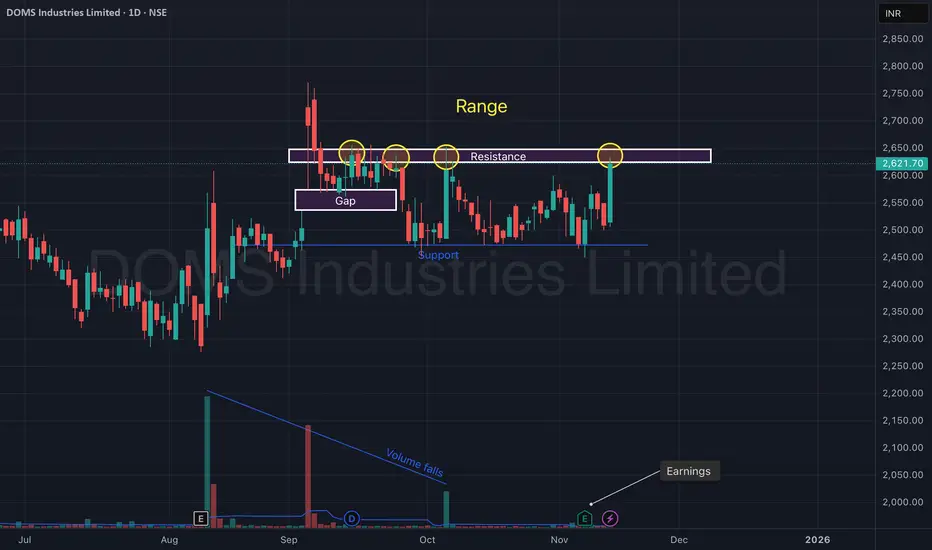
DOMS Industries Ltd – Range Breakout Attempt After Earnings.DOMS Industries continues to trade inside a well-defined range structure, with price repeatedly rejecting the ₹2,630–₹2,660 resistance zone. The recent strong bullish candle toward the upper boundary, combined with improving sentiment after earnings, signals a potential breakout attempt.
A clear gap zone retest around ₹2,520–₹2,550 provided a solid base. Support at ₹2,450 has held cleanly multiple times, validating the lower boundary of the range.
With volume slowly recovering from its multi-week decline and price pressing into resistance again, DOMS is approaching a decisive move.
🎯 Key Technical Levels
CMP: ₹2,621.70 (+4.49%)
Resistance Zone: ₹2,630 – ₹2,660 (Range high)
Gap Support: ₹2,520 – ₹2,550
Major Support: ₹2,450
Breakout Levels to Watch: Close above ₹2,660 with strong volume
📈 Technical View
Price is respecting a horizontal range for several weeks.
Repeated rejections highlighted by circles show strong supply near ₹2,650.
Gap zone acted as demand, helping price bounce back toward resistance.
Volume trend has been falling, suggesting participation has been subdued — a pickup in volume during any breakout would be critical.
Structure stays bullish above ₹2,520; bearish only if price closes below ₹2,450.
📊 Latest Earnings Snapshot
DOMS continues to deliver strong quarterly performance, supporting the technical setup:
Q2 FY26 (Sep 2025):
Net Profit: ~₹55.8 Cr
YoY Profit Growth: ~16%
Q1 FY26:
Revenue: ₹508.7 Cr (↑ ~26% YoY)
PAT: ~₹59.1 Cr (↑ ~8.8% YoY)
Consistent earnings growth strengthens the medium-term outlook and boosts confidence in a potential range breakout.
🧠 View
DOMS is back at its major resistance zone after a clean bounce from the gap support. A strong-volume breakout above ₹2,660 can trigger a momentum extension toward fresh highs, while ₹2,520 and ₹2,450 remain key demand zones to watch.
Bharat Dynamics Ltd – Symmetrical Triangle Breakout on Watch (D)Bharat Dynamics is currently trading near a key breakout point of a symmetrical triangle pattern on the daily chart. After a prolonged downtrend, the stock has entered a consolidation phase, forming higher lows and compressing price action — a setup that often leads to a strong directional move.
Bharat Dynamics Q2 Results
✅ Net Profit: ₹216 Cr vs ₹123 Cr (YoY) — 🔼 up 75.5%
✅ Revenue: ₹1,147 Cr vs ₹545 Cr (YoY) — 🚀 strong growth
✅ EBITDA: ₹188 Cr vs ₹98.8 Cr (YoY) — 🔼 up 89.4%
✅ EBITDA Margin: 16.4% vs 18.1% (YoY) — 🔽 slight dip
The price has reclaimed the ₹1,500–₹1,530 zone, and a sustained close above ₹1,550 could confirm a breakout, opening the path for a quick momentum rally toward ₹1,650 and beyond.
🎯 Key Levels:
CMP: ₹1,525.70 (−0.95%)
Breakout Zone: ₹1,550 – ₹1,560
Target 1: ₹1,650 – ₹1,670
Target 2: ₹1,710 – ₹1,740
Resistance: ₹1,950 – ₹2,000
Stop-Loss: ₹1,470 (on daily close basis)
📊 Technical View:
Symmetrical triangle pattern forming after a prolonged correction.
Price compression with reduced volume indicates breakout buildup.
Breakout confirmation expected above ₹1,560 with increasing volume.
If sustained, the move could extend toward the higher resistance zone around ₹1,950+.
🧠 View:
Bharat Dynamics is at a decisive point — a breakout above ₹1,550–₹1,560 with volume can mark the start of a short-term uptrend. Keep an eye on price action near this level for confirmation.

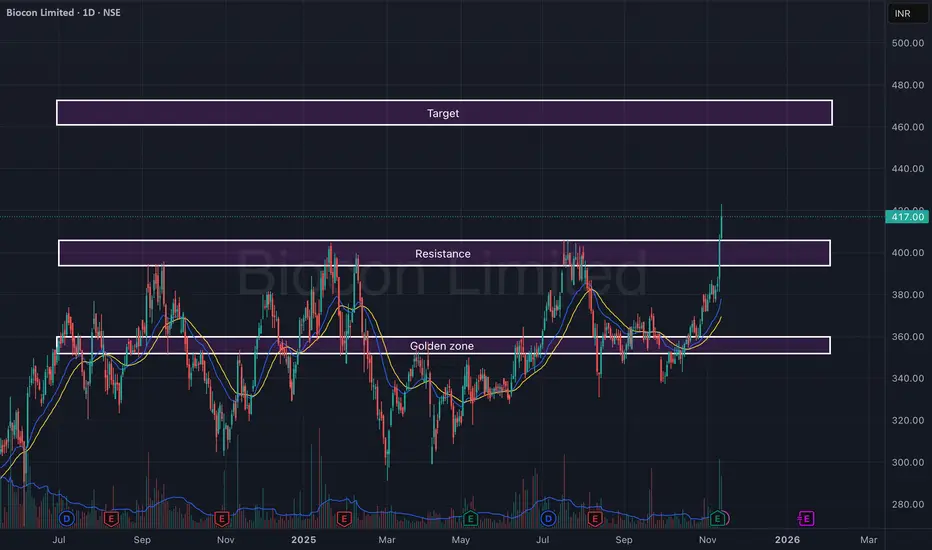
Biocon Ltd – Breakout from Resistance with Strong Volume SurgeBiocon has delivered a powerful breakout above its key resistance zone of ₹395–₹405, backed by a sharp volume expansion and strong follow-through candles. After months of consolidation within the golden zone (₹355–₹370), the stock has finally regained momentum, suggesting a potential trend reversal.
The structure now favors continuation toward the upper target zone, with EMAs aligning positively and momentum indicators supporting strength.
🎯 Key Levels:
CMP: ₹417.00 (+2.73%)
Golden Zone (Base Support): ₹355 – ₹370
Resistance (Now Support): ₹395 – ₹405
Target Zone: ₹460 – ₹475
Stop-Loss: ₹385 (on daily close basis)
📊 Technical View:
Resistance breakout with strong bullish candle and high volume.
EMA crossover (20 > 50) confirms short-term bullish trend.
Sustaining above ₹405 may lead to a momentum rally toward ₹460+.
Golden zone remains a reliable base for any pullback opportunities.
🧠 View:
Biocon has confirmed a breakout after a prolonged consolidation phase. Sustained momentum above ₹405 could lead to a steady move toward ₹470 levels in the short to medium term.
Short term swing on Jyoti CNCWith the earnings flattening out , EPS seems to have bottomed out and recent CEO statements clearly indicate strong order book and positive cash flow in Q3 leading upto Q4.
Along with these fundamental view , it formed a base between 878 - 924 range. Entererd the trade on breakout and pull back in to base.
Entry : Entry 912
SL : 875 ( I usually dont keep a hard SL, I exit if the price sustains under 875 for 2 successive trading sessions - thats how I've found success )
Target : 1035
Current entry does look for slightly longer term hold in which case I would add more qty if the price drops under 870 ( hold for 6-12 months ) . The hold would make sense if the company delivers on the time while sustaining a strong order book and cash flow as predicted which would eventually elevate the EPS and price should go up n beyond the previous ATH.
Note: Personally , I have a long term position which I opened at 411 so currently this is just a swing but yes a substantial drop under 870 and I'll add to my long term position.

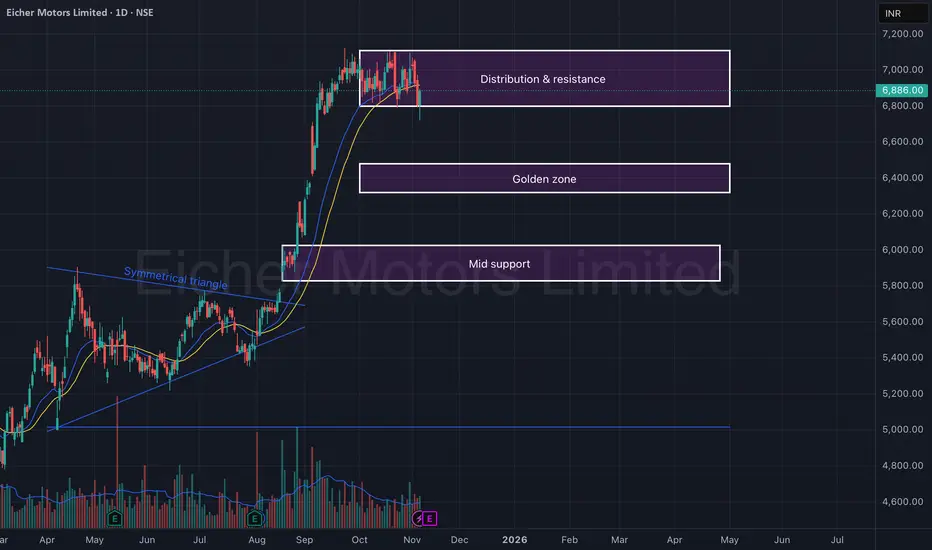
Eicher Motors Ltd – Distribution Zone & Golden Support Level (D)Eicher Motors is showing signs of short-term distribution after a strong uptrend. The price has been consolidating near the ₹6,850–₹7,050 resistance zone, which has acted as a supply area multiple times in recent sessions.
Following an extended rally from the breakout of the symmetrical triangle, the stock appears to be entering a cool-off phase — likely testing lower supports such as the golden zone (₹6,300–₹6,450) or mid support (₹5,900–₹6,000) before resuming its larger trend.
🎯 Key Levels:
CMP: ₹6,886 (+1.17%)
Resistance / Distribution Zone: ₹6,850 – ₹7,050
Golden Zone (Retracement Support): ₹6,300 – ₹6,450
Mid Support: ₹5,900 – ₹6,000
Stop-Loss (if long): Below ₹5,850
📊 Technical View:
Price facing resistance near prior highs, forming short-term distribution structure.
EMA alignment still bullish, but price is attempting a short-term retest.
Golden zone coincides with 38.2–50% retracement levels from the prior rally.
A reversal candle or bullish pattern in the golden zone could present a buying opportunity for swing traders.
🧠 View:
Eicher Motors remains structurally bullish in the medium term, but a short-term pullback is likely. The ₹6,300–₹6,450 golden zone will be key for a potential bounce, while ₹7,000 continues to act as the ceiling until a clear breakout occurs.
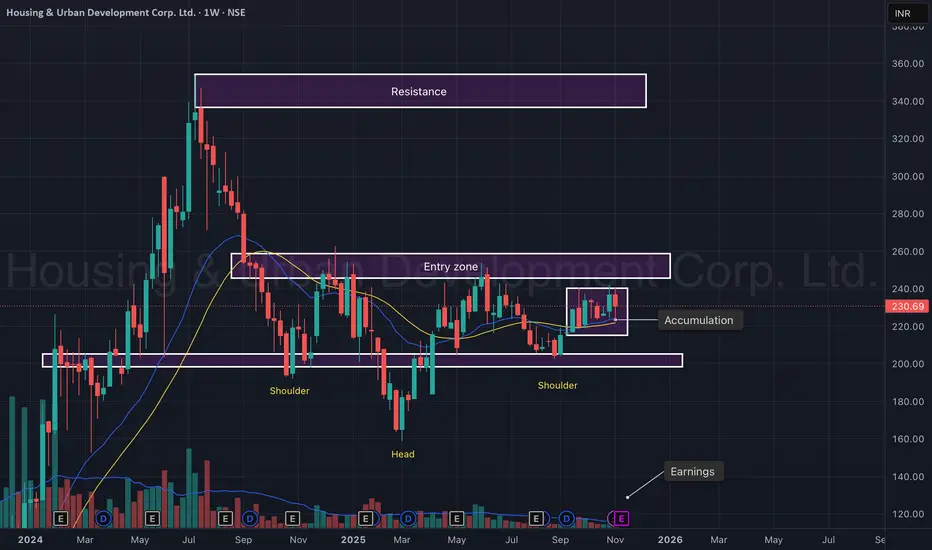
HUDCO – Inverted Head & Shoulders Pattern with Accumulation (W)HUDCO is showing a classic Inverted Head & Shoulders formation on the weekly chart, signaling a potential medium-term trend reversal after an extended consolidation phase. The stock has been forming higher lows since mid-2024, supported by steady volume accumulation.
The entry zone (₹225–₹235) is being retested multiple times, indicating strong demand at lower levels. A decisive breakout above ₹240–₹245 could confirm pattern completion and trigger a fresh rally toward the next resistance zone.
🎯 Key Levels:
CMP: ₹230.69 (+1.39%)
Pattern: Inverted Head & Shoulders
Entry Zone: ₹225 – ₹235
Support (Shoulder Zone): ₹200 – ₹210
Resistance Target: ₹340 – ₹360
Stop-Loss: ₹205 (weekly close basis)
📊 Technical View:
Formation of Inverted Head & Shoulders with strong right shoulder support.
Accumulation phase visible with increasing volumes and sideways base.
20 & 50 EMA alignment turning positive, supporting bullish reversal bias.
Sustaining above ₹240 could trigger the start of a breakout rally.
🧠 View:
HUDCO is showing strong base-building behavior. A weekly close above ₹240 may confirm a breakout from the neckline, paving the way for targets of ₹300+ in the short term and ₹350+ in the medium term.
DABUR: a long term breakout candidatePros:
-Defensive sector i.e. FMCG and world’s largest ayurvedic and natural health care company
-P/E in February 2020 > P/E in November 2025
-Promoter holding at 66% & the retail holding is near an all time low
-Highest ever sales and EPS
-Increase in capex and reduction in debt
-RS has been negative for the last many years and such stocks generally give big upmove when RS becomes positive
Cons:
-PEG is negative implying slow growth
Disc: invested

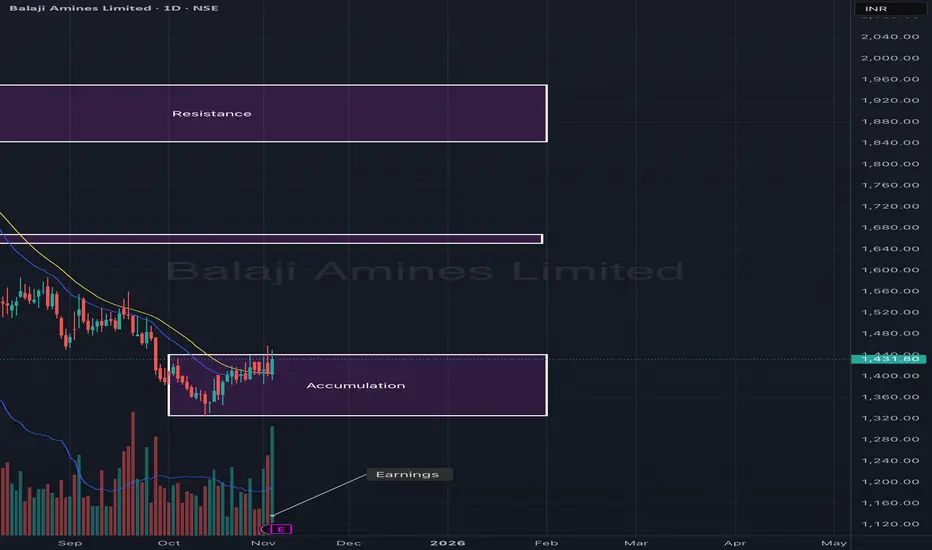
Balaji Amines Ltd – Accumulation Phase Before Potential UpsideBalaji Amines appears to be in a strong accumulation zone after an extended downtrend. The stock has been consolidating between ₹1,350–₹1,450, forming a solid base supported by stable volumes. A sustained move above this range could mark the beginning of a trend reversal and initiate a fresh leg toward the upper resistance levels.
The recent earnings announcement may act as a potential catalyst, as the stock shows early signs of momentum supported by short-term moving average crossovers.
🎯 Key Levels:
CMP: ₹1,431.80 (+1.93%)
Accumulation Zone: ₹1,350 – ₹1,450
Resistance 1: ₹1,650 – ₹1,700
Resistance 2: ₹1,900 – ₹1,950
Stop-Loss: ₹1,340 (on daily close basis)
📊 Technical View:
Price consolidating near the base zone post-correction, signaling accumulation.
Volume stability and EMA alignment suggest early buying interest.
A breakout above ₹1,450 could trigger a move toward ₹1,700.
Sustaining above ₹1,700 may open the next leg toward ₹1,950+.
🧠 View:
Balaji Amines is forming a base after prolonged correction. A close above ₹1,450 with volume confirmation can trigger momentum toward ₹1,700 in the short term, and ₹1,950 in the medium term.
Aarnav Fashion is a buy technical breakoutPrice volume suggests big buying in Aarnav with stock more than 10% up
Promotor increased stake in company.
Buy and hold for 30/40% more up move.

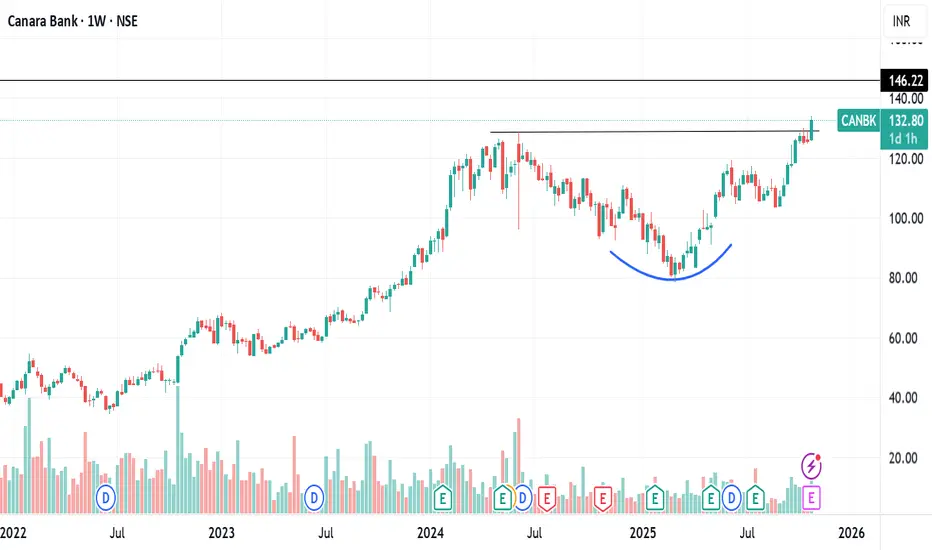
CANARA BANK ROUNDING BOTTOM BREAKOUTCanara bank breaking rounding bottom weekly
with huge volume this week
RSI above 60 bullish
heading towards 15 yr high
q2 net profit rises 19% +ve
target 146 then can lead to ATH 164 also
NO BUY/SELL RECOMENDATION
HDFC Bank: Expanded Flat Unfolding Near Double-Top ZoneAfter a clean five-wave advance from ₹681.80 to ₹1,018.85, HDFC Bank appears to be tracing a textbook expanded flat correction.
Wave Structure
Wave 4 unfolded as a triangle, setting the stage for a channeled Wave 5 that topped at ₹1,018.85.
The subsequent decline to ₹940 formed Wave A, and the sharp rebound to ₹1,020 marks a classic B-wave retest of the prior high — effectively a double-top zone.
Wave C could now stretch toward the 0.5–0.618 retracement cluster (₹850–₹810) — an area also highlighted by the Visible Range Volume Profile (VRVP) as the highest liquidity pocket.
Volume Check & Market Tone
The VRVP shows thinning participation above ₹940 and a heavy node between ₹850–₹810 — implying that the real acceptance zone lies lower. This adds weight to the bearish bias for Wave C.
Fundamental Backdrop
Interestingly, the company reported a 10 % rise in Q2 profit, yet the stock closed flat near ₹1,003. While the headline looked positive, reported EPS (₹6.82) missed analyst expectations (₹11.29) by a wide margin, tempering sentiment. The price action reflects that disconnect — optimism capped by underwhelming earnings quality.
Summary
Expanded flat unfolding near a double-top zone, with price likely gravitating toward the ₹850–₹810 confluence before any meaningful base formation.
Disclaimer: This analysis is for educational purposes only and does not constitute investment advice. Please do your own research (DYOR) before making any trading decisions.

Nifty As per the chart pattern, 24500-24550 is very crucial support zone. Bearish move will persist if Nifty closes below 24500. Next 2-3 days we need to watch carefully. If it reverse from this zone, strong bull case scenario will be there. Trigger point will be RBI policy and earning season

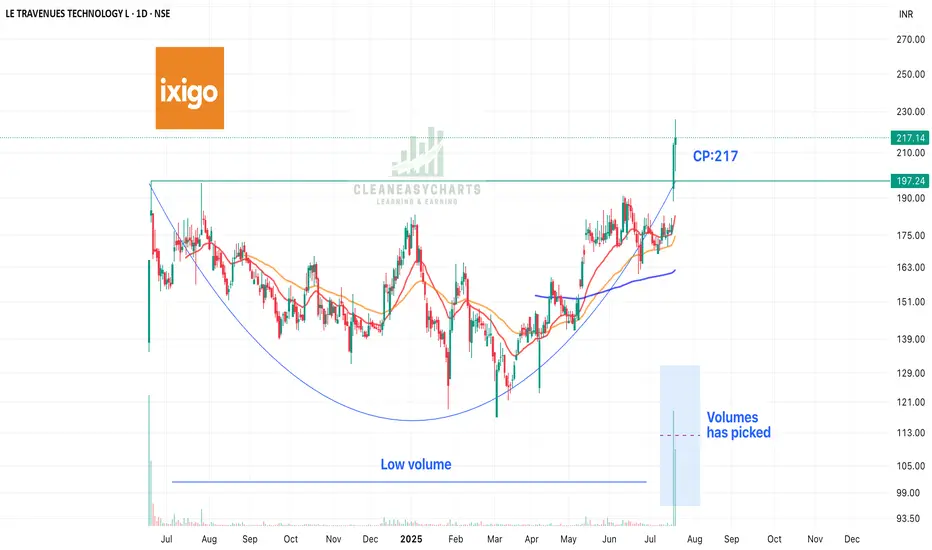
ixigo - Rounding Bottom Patter; IPO StrategyIXigo is a online travel aggregator and is the fastest gorwing Co. in this sector. This stock is looking great on account of following:
1. Fit into the criterion of IPO Strategy - crossed high of its listing price with big volumes
2. Rounding Bottom Patter
3. Best Q1 2025 results
4. Number 2 in OTA sector
This stock should be in your watching list for a good big returns.
Keep following @Cleaneasycharts as we provide Right Stocks in Right Time at Right Price!!.
Cheers!!
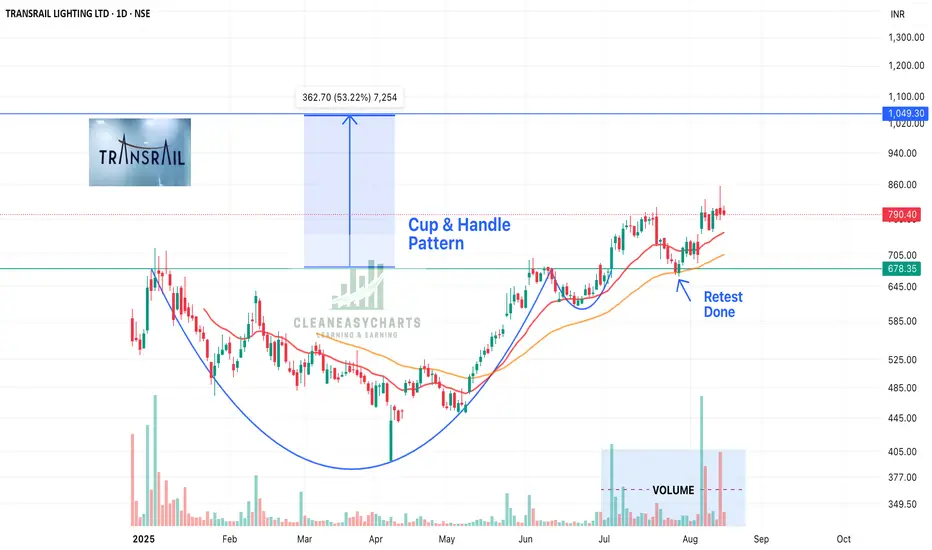
Transrail Lighting: Cup & Handle Pattern- Breakout & Retest DoneTransrail has made a cup & handle pattern and is looking for 50% jump. Other factors:
1. It got listed in Dec 2024 and has crossed that price, made a Cup & Handle Pattern - Breakout & Retest done.
2. 15000 crores order book
3. Recently got 700 crore order
4. Perform orders in 59 countries
5. Profitability is increasing
6. 25% growth rate
Transrail is solid fundamental & technical stock. This should be in your portfolio.
Right Stocks at Right Time at Right Price !!!
Keep following @Cleaneasycharts
Cheers!!
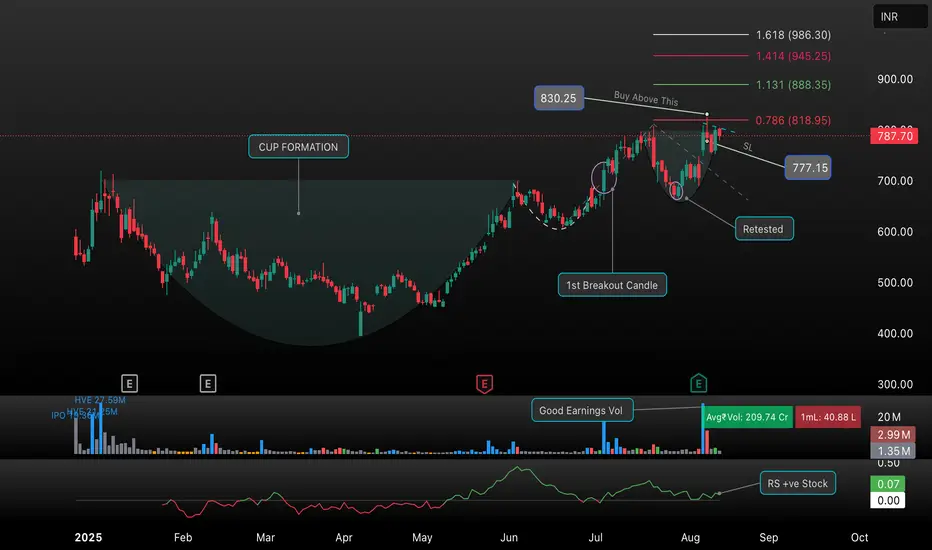
TransRail: Cup & Handle Breakout Setup | Key Levels & TargetsTransRail has recently formed a textbook cup and handle pattern, signaling a potential bullish breakout. The stock showed strong momentum after retesting the breakout zone and is currently consolidating near key resistance.
Key Points:
• Cup Formation: Evident over the past months, indicating accumulation.
• Breakout Levels: First breakout candle confirmed; price now approaching resistance at ₹830.25.
• Buy Trigger: Entry above ₹830.25 for bullish confirmation.
• Fibonacci Targets: Next potential targets at ₹888.35 (1.13 Fib), ₹945.25 (1.41 Fib), and ₹986.30 (1.618 Fib).
• Stop Loss: Maintain SL at ₹777.15 to manage risk.
• Volume: Strong earnings volume supports the setup.
Watch for sustained volume and a decisive move above resistance for confirmation. Add TransRail to your watchlist for a potential swing trade opportunity!
Cartrade-A risky positional trade for ATH targets!Cartrade has given outstanding Q4 2024 results and bullishness in the stock is indicator of same.
However, these stocks come with good amount of risk with bigger rewards.
Stock has formed beautiful cup & handle pattern and is about to break it.
Once 1000 is crossed, we can see ATH levels soon. I had seen similar breakout in PBFintech (Policybazaar).
If you believe in new age startups, this stock is technically looking bullish.
