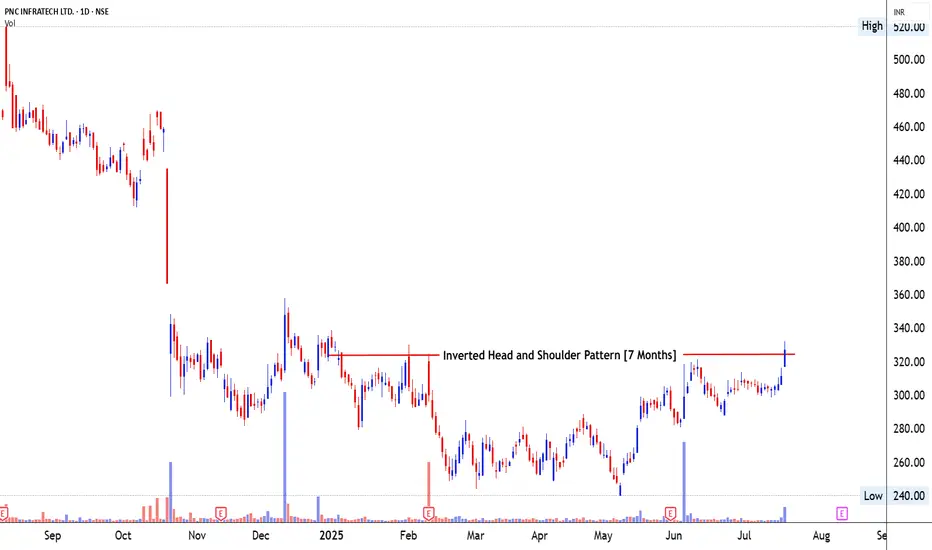
PNC Infra- Inverted Head and Shoulder Pattern1⃣ Pattern Structure & Breakout Development 📈
📐 Pattern Identification : Inverted Head and Shoulder Pattern – a powerful bottom reversal pattern, signaling the end of a prolonged downtrend and readiness for upside expansion.
⏳ Time Taken in Formation : The pattern matured over 7 months (from December 2024 to July 2025). This is an ideal duration on the daily chart, allowing institutional buildup and accumulation phases to complete.
📊 Price Trend Before the Pattern: The stock had been in a downtrend, falling from ₹410 to a bottom near ₹240. This decline created the structural base for the left shoulder, head, and right shoulder.
📦 Price Movement Inside the Pattern:
Left Shoulder: Dec 2024–Jan 2025; shallow decline and mild recovery.
Head: Mar 2025; price dropped to the lowest point near ₹240 with sharp volatility.
Right Shoulder: May–July 2025; a higher low formation, tight consolidation, and buildup under neckline resistance – ideal structural behavior before breakout.
🚀 Breakout Zone & Behavior : The neckline near ₹312 has now been decisively broken with a strong bullish candle closing at ₹330.50, confirming a clean breakout with momentum.
2⃣ Volume Behavior & Breakout Validity 🔍
📉 Volume During the Pattern : During the body of the pattern (especially March to May), volume remained below average, indicating supply exhaustion and absorption from stronger hands.
📈 Volume Before the Breakout: Noticeable volume rise in the right shoulder phase, suggesting institutional entry ahead of breakout — a positive preparatory signal.
💥 Volume on Breakout Candle: Today’s breakout came with 2.2M shares traded, one of the highest volume bars in the last 3 months — a key confirmation of genuine breakout strength.
🔮 Volume After Breakout – What to Expect: Sustained high volume in the next 2–3 days will help validate follow-through. If volume contracts but price holds above ₹312–₹315, a healthy retest may offer secondary entry.
3⃣ Candlestick Dynamics & Trap Awareness 🕯️
🔥 Candles Formed Before Breakout: Price showed gradual higher lows, small-bodied candles, and a tight range under resistance — classic signs of energy buildup before breakout.
💎 Breakout Candle Characteristics: Today's candle is a bullish marubozu — full body, minimal wick, closing near day’s high. This reflects strong buyer conviction and zero rejection at breakout point.
⚠️ Impact of the Breakout Candle: A textbook breakout — no signs of trap or exhaustion. However, traders must monitor whether price sustains above ₹312–₹315 in the coming sessions.
4⃣ Trade Setup – Entry, Exit & Risk Strategy 🛍️
🛡️ Safe Entry: Enter on retest near ₹315–₹318 with bullish candle confirmation — allows entry with structure-based stop-loss.
⚡ Aggressive Entry: Enter at current levels (₹330.50) on strength, with a tight stop below breakout zone.
🎯 Target Zones (Measured Move):
Pattern Height: ₹312 (neckline) – ₹240 (head) = ₹72
Target 1: ₹312 + ₹72 = ₹384
Target 2: ₹410 (previous supply zone and gap resistance)
🚩 Stop-loss Placement :
Safe: SL below breakout zone ~₹308
Aggressive: SL near swing low ~₹315
⚖️ Risk**:Reward**** Planning:**
Safe: Entry ₹318 / SL ₹308 / Target ₹384 → R**:R**** ≈ 1:6.6**
Aggressive: Entry ₹330.50 / SL ₹315 / Target ₹384 → R**:R**** ≈ 1:3.6**
5⃣ SEBI Disclosure – Educational Purpose Only 📜
“This report is for educational purposes only and does not offer investment advice. Mr. Chartist (Rohit Singh) is a SEBI Registered Research Analyst under the Investology (INH000012376). Please consult a SEBI-registered advisor before taking any investment decisions. All investments carry risk. Past performance is not a guarantee of future results.”
Community ideas
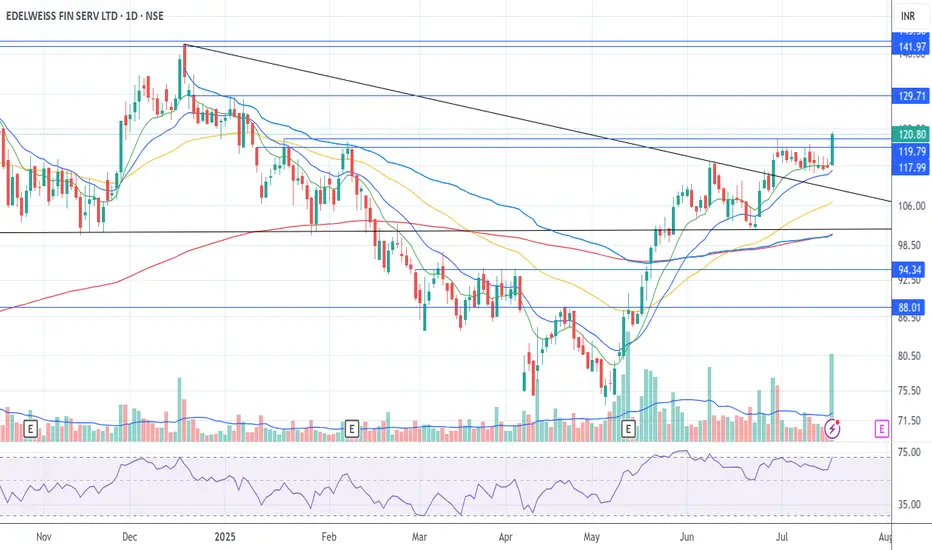
Edelweiss - Volume pick upIf the stock can break out of this range..142 is calling..
Long at current prices with the hope of it touching the above price..
At that price it forms an amazing Cup and Handle which whenever a breakout happens there could be further upside..
Caution below 106.
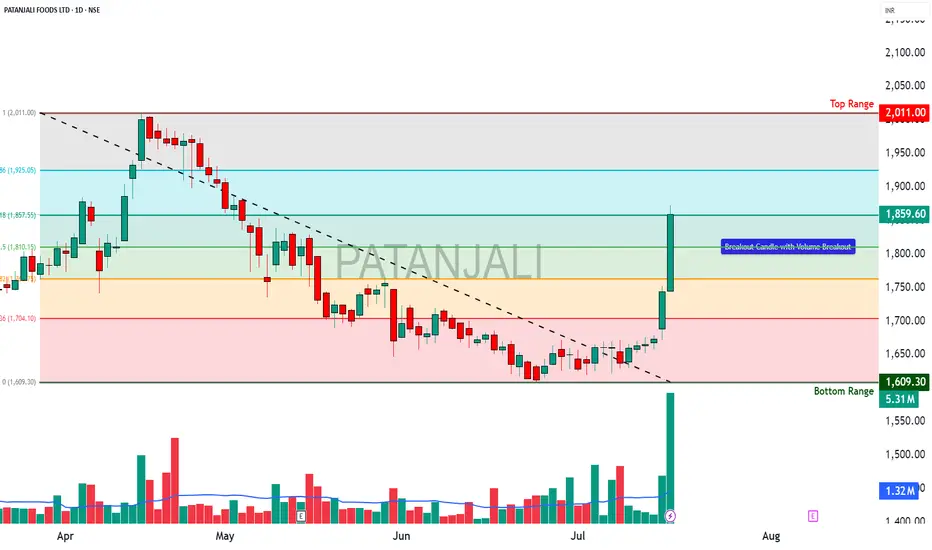
PATANJALI - OPTIONS TRADE SETUPPATANJALI OPTIONS TRADE SETUP – 17 JULY
Spot: ₹1859.6
Trend: Bullish
Volatility: Moderate IV rise (38–41%)
Lot Size: 300
________________________________________
1. Bullish Trade (Naked options as per trend)
Best CE: Buy 1860 CE @ ₹59.45
Why: Strong continuation signal with rising OI and price, heavy volume, and ideal gamma/vega mix for price moves.
________________________________________
2. Contrarian Trade (Naked options against trend)
Best PE: Buy 1800 PE @ ₹31.3
Why: Defensive Put play with unusually high activity and rising IV → could work as hedge if breakdown begins below ₹1840.
________________________________________
3. Strategy Trade (As per trend + OI data)
Strategy: Bull Call Spread → Buy 1860 CE / Sell 1920 CE
Net Debit: ₹59.45 - ₹35.5 = ₹23.95
Max Profit: ₹60 - ₹23.95 = ₹36.05
Max Loss: ₹23.95
Risk:Reward ≈ 1:1.5
Lot Size: 300
Total Risk: ₹7,185
Max Profit: ₹10,815
Why:
• Massive Long Buildup in CE chain (1820 to 1960), with 1860 CE leading in volume and OI surge
• 1860–1920 spread captures ideal move zone before resistance at 1960
• IVs rising moderately → favors debit spread entry
• PE chain showing Short Buildup, especially at 1800/1840/1880 → downside bets getting squeezed
• Balanced risk with great R:R (1:1.5) near breakout zone — clean bullish continuation setup
________________________________________
📘 My Trading Setup Rules
Avoid Gap Plays
→ Check pre-open price action to avoid trades influenced by gap-ups/gap-downs.
Breakout Entry Only
→ Enter trades only if price breaks previous day’s High (for bullish trades) or Low (for bearish trades).
Watch Volume for Confirmation
→ Monitor volume closely. No volume = No trade.
Enter on Strong Candle + Volume
→ Execute the trade only if a strong candle appears with increasing volume in the direction of the trade.
Defined Risk:Reward Only
→ Take trades only if R:R is favorable (ideally ≥ 1:2).
Premium Disclaimer
→ Option premiums shown are based on EOD prices — real-time premiums may vary during execution.
Time Frame Preference
→ Trade with your preferred time frame — this strategy works across intraday or positional setups.
________________________________________
⚠ Disclaimer (Please Read):
• These Trades are shared for educational purposes only and is not investment advice.
• I am not a SEBI-registered advisor.
• The information provided here is based on personal market observation.
• No buy/sell recommendations are being made.
• Please do your own research or consult a registered financial advisor before making any trading decisions.
• Trading involves risk. Always use proper risk management.
I am not responsible for trading decisions based on this post.
________________________________________
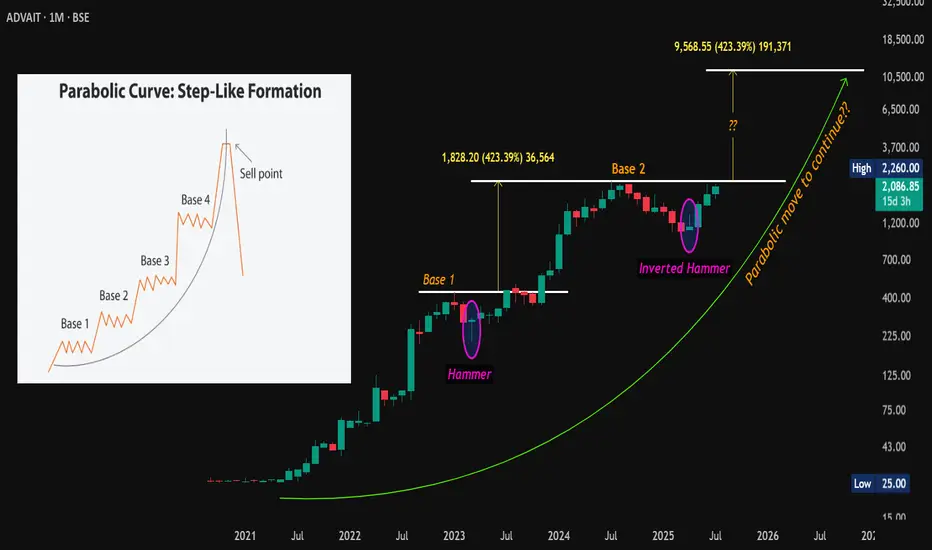
#Advait | Parabolic Setup Reloaded? Retesting All-Time Highs🔍 #OnRadar
#Advait (Advait Energy Transitions Ltd.)
CMP: 2,087
Technical View (Educational Purpose Only):
Stock is once again showing signs of a #ParabolicMove in progress. Earlier, it broke out from #Base1 at 431.80 and rallied to 2,260 — a remarkable ~400% move in just 8 months .
Now, after forming #Base2 , the stock is heading back toward the all-time high zone of 2,260 . A monthly close above this level could act as a key technical trigger.
🧐 Will the parabolic momentum resume? Worth watching closely.
⚠️ This is not a buy/sell recommendation. Please consult your financial advisor before making any investment decisions. This post is purely for educational and observational purposes.
#TechnicalAnalysis | #PriceAction | #ParabolicMove | #LongTerm
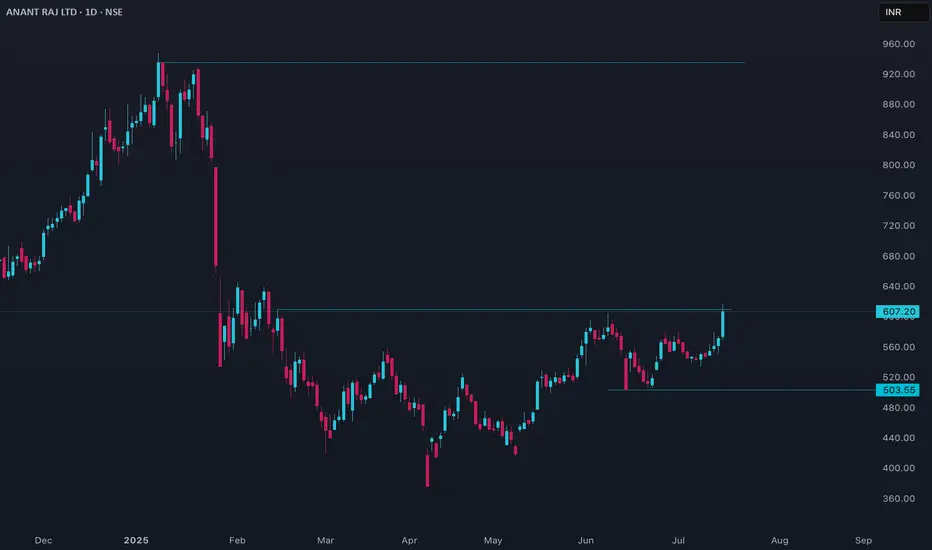
ANANTRAJ Price Action
## Current Price & Performance
- Last close was ₹607.20.
- Over the past week, the stock is up more than 10%, showing strong short-term momentum.
- Over the past year, it has gained nearly 25%, but suffered a sharp 32% drawdown over six months.
- The 52-week price ranged from ₹376.15 to ₹947.90, reflecting high volatility.
## Valuation and Metrics
- ANANTRAJ trades at a high valuation, with price-to-earnings and price-to-book ratios above typical industry averages.
- Its market capitalization puts it among the stronger players in the real estate sector.
- Key valuation multiples such as PE and EV/EBITDA are elevated, indicating investors are paying a premium for expected growth.
- The stock’s PEG ratio suggests its growth is reasonably in line with its price.
## Analyst Sentiment and Targets
- Most analysts rate the stock as a strong buy, highlighting strong upside potential with target prices higher than the current market price.
- The consensus one-year price targets suggest potential returns ranging between 24% and 49% from current levels.
## Technical & Fundamental Observations
- Compared to sector peers, its PE is lower than certain high-flyers but remains above the overall industry average, making it expensive by historical standards.
- Return on equity has hovered around 8.5% recently, with efficient operating and employee costs supporting margins.
- A modest dividend has recently been declared.
- A slight increase in promoter holding indicates management confidence.
## Risk Factors
- Substantial volatility in recent months may raise concerns for risk-averse investors.
- Both intrinsic value models and relative measures suggest the shares may be overvalued by over 20% at current prices.
- While momentum and sentiment are positive, valuation risk remains a key factor for new investors.
## Conclusion
ANANTRAJ is benefiting from strong momentum and positive sentiment, with analysts forecasting further upside. However, current valuation levels are high, and investors should carefully weigh the potential for price appreciation against the risk of overvaluation and ongoing volatility. Consider both the fundamental strengths and the elevated price multiples before making an investment decision.
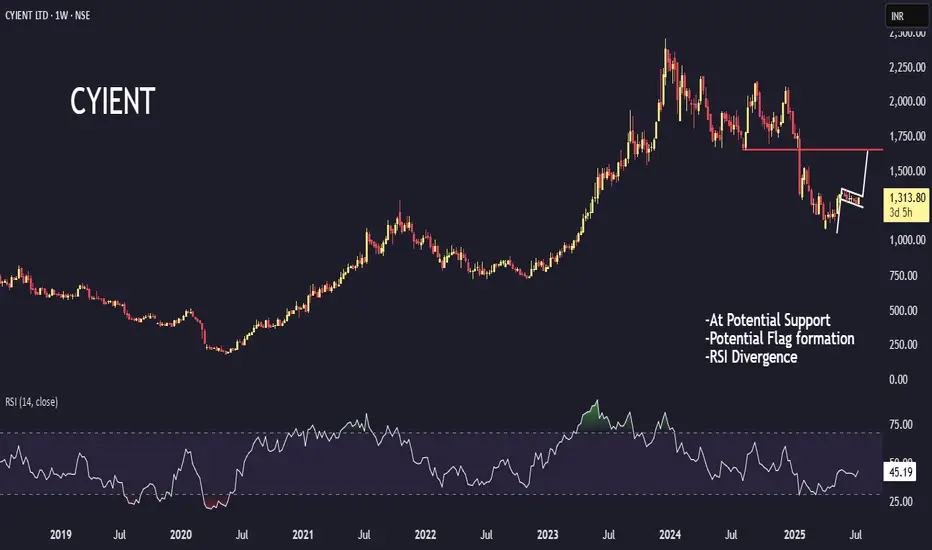
CYIENT- Flag SetupWe all know that price generally moves in two phases- Contraction and Expansion. Setups like rectangle, Flag or Triangles generally represent contraction. The stock squeezes in these narrow setups and then jumps on to the next phase that is Expansion. Expansions are generally strong impulsive moves in the direction of the most recent trend in the background.
CYIENT has been consolidating in a narrow range of almost 100 points- structurally known as Flag in technical analysis terms (see chart). This is contraction and the possible next phase could be an Expansion. This hypothesis can be further confirmed by two more facts.
🚀The stock has been taking support near October 2021 highs. A previous resistance zone has the tendency to act as a support, and it is acting like one. The stock moved from almost 1100 to around 1400 (rounded) and now consolidating for a further move,
🚀Secondly, the Relative Strength Index has been showing divergence. Which means that as the stock was making lower lows in April, the RSI was having higher lows. This positive divergence is good and often leads to a rally or reversal in stocks.
In this backdrop, I am expecting a break of Flag on the upside and a rally to its immediate breakdown area, that is 1650. Since the stock is still in an overall bearish structure, we can't expect new highs anytime sooner. The stoploss for such trades go underneath the Flag.
This is not a recommendation.
Please apply you due diligence or consult your financial advisor.
Do like/comment for more ideas in future.
Regards.
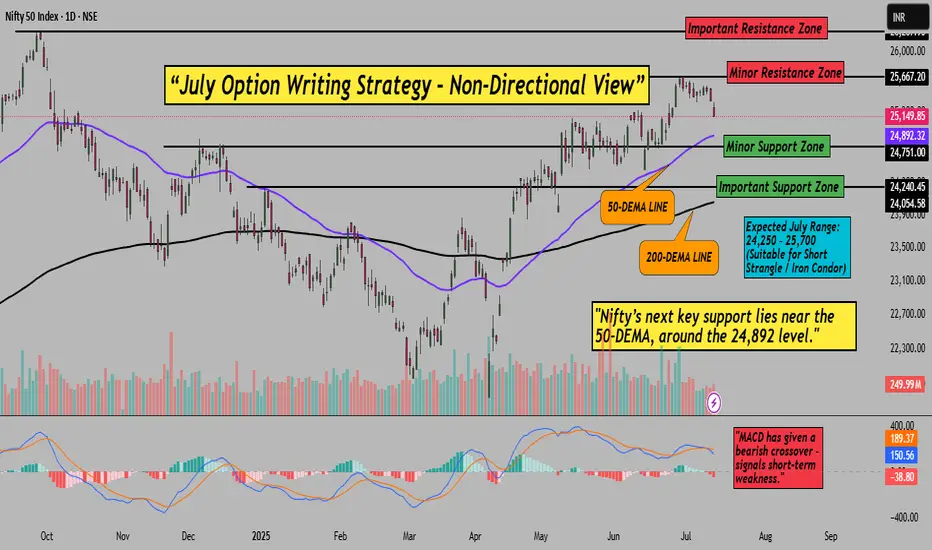
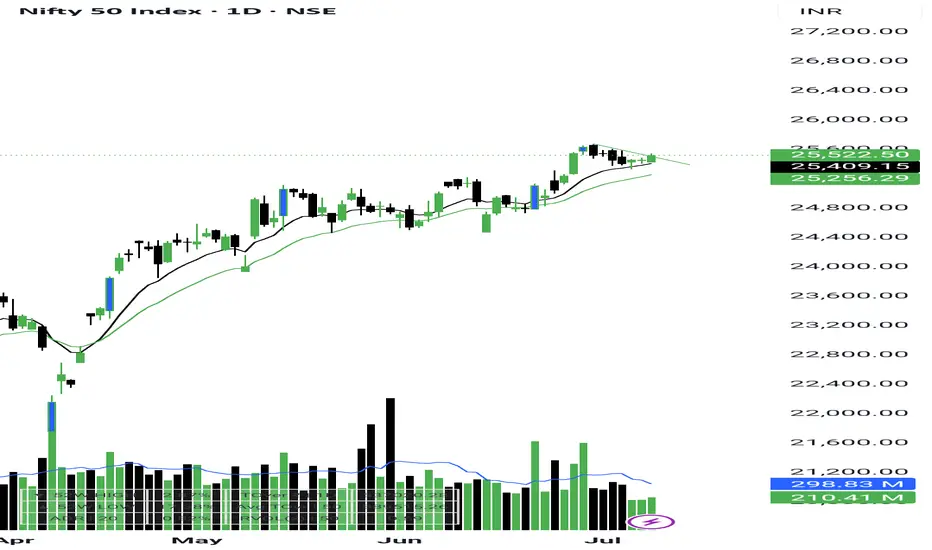
Nifty July Iron Condor Strategy – Premiums are Still Attractive!Hello Traders!
After a strong April, May and June where all three our option writing strategies gave full profits, we are back again with the July edition. Market is respecting the range beautifully, and we are again going with a non-directional Iron Condor setup.
Let’s walk through the logic and setup, based on the recent chart and market behaviour.
Why This Strategy Now? (Based on Chart Analysis)
Resistance Zone: 25,667–26,267 (two-layer zone, minor and major resistance)
Support Zone: 24,240–24,892 (50-DEMA tested, strong support)
Nifty is hovering inside the range – no clear trend, perfect for sideways strategy
MACD has given bearish crossover – adds pressure on upside
Strategy Setup (Iron Condor – 31st July Monthly Expiry)
Sell 24900 PE (2 lots)
Buy 24500 PE (2 lots)
Sell 25500 CE (2 lots)
Buy 25800 CE (2 lots)
Payoff Graph for Strategy:
Why This Works (Logic + Technical View)
Strategy revolves around the 24,750–25,650 zone where Nifty is stuck
Support well aligned to 50-DEMA at 24,892 and 24,240 (intermediate support)
Volatility is neutral, data is range-bound – ideal environment for iron condor writers
No major events or newsflow – market likely to stay inside band
Risk Management & Exit Points
Exit if Nifty gives a clean breakout above 25,700 or breakdown below 24,250
If strategy gives 40–50% max profit early, consider booking
Always keep an eye on VIX and OI buildup for major trend shifts
Rahul's Tip
This strategy has worked beautifully for last 3 months. If you’ve been with me, you know how well Iron Condors can work when market ranges. So we ride the same logic again, until the breakout comes.
Once again – this is a low risk, range-bound iron condor setup with good risk-to-reward.
Have you ever tried a short iron condor on NIFTY? What was your experience? Drop your thoughts below!
If you liked this post, don’t forget to LIKE and FOLLOW!
Regular updates coming with chart tracking, P&L changes and smart exits.
Disclaimer: This analysis is for educational purposes only. Please consult a financial advisor before making investment decisions.
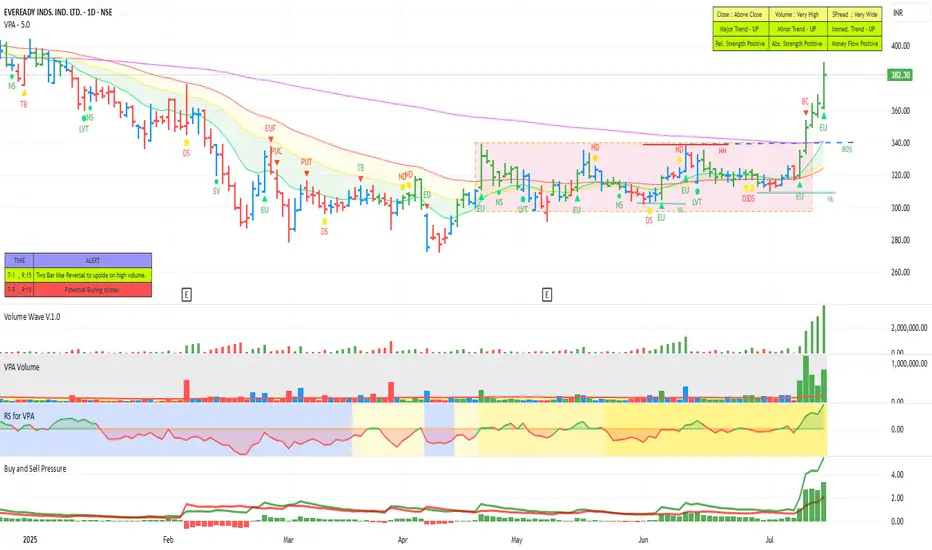
EVEREADY - POISED FOR A UPMOVEThe stock fell about 45% form it's last Peak. Then an attempt to move up and more than two months of consolidation . Now making Higher Highs and Higher lows and moving past the short term moving averages and the 200 DMA. We can see strong momentum and bullish volume and increasing Relative strength. Money Flow is positive. The stock looks poised for a good up move.
Market Analysis and Nifty AnalysisIn this video, I have provided an overall market analysis. :
Although the market is green today, it's important to stay cautious.
Small caps are forming range-bound bullish engulfing candles, but we need to wait for the closing.
Nifty continues to form lower lows on the lower time frame. A reversal can be confirmed once strength appears on the lower time frame and is reflected in the daily chart.

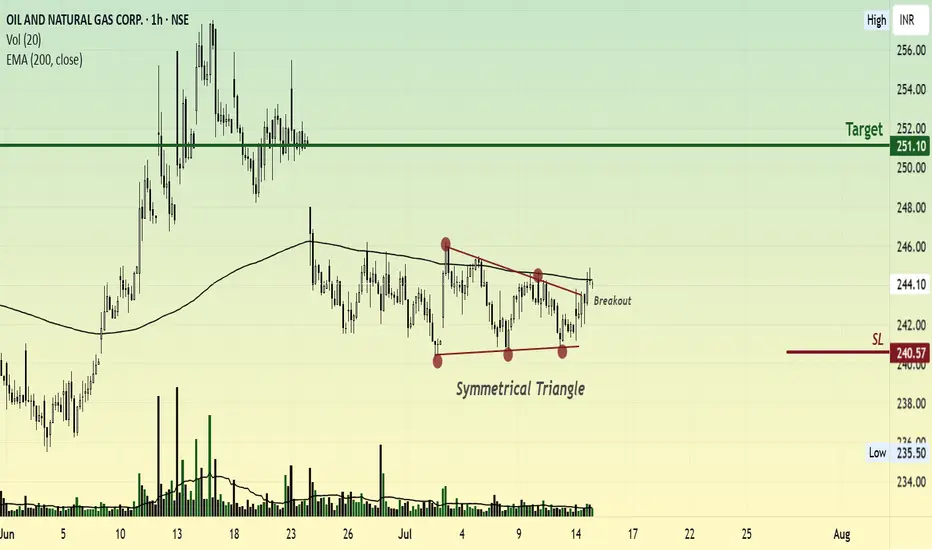
ONGC might fill the Gap!Points to consider:
----------------------
1. A symmetrical triangle consolidation breakout
2. Stock testing 200ema repeatedly
3. A gap filling trade is possible, with a strong triangle base.
DISCALIMER : This is NOT a trade recommendation but only my observation. Please tale trades based on your own analysis
HEROMOTOCO – Wave 5 Setup Unfolding After Ideal Wave 4 📘 HERO MOTOCORP – Wave 5 Setup from Textbook Elliott Structure
Timeframe: Weekly
Structure: Impulsive (1–2–3–4 complete) → Preparing for Wave 5
Type: Positional Swing Setup | Elliott Wave Based
🔍 1. Elliott Wave Structure Breakdown:
Wave 1: ₹1,475 to ₹3,629
Wave 2: Retraced to ₹2,146.85 (between 50%–78.6% Fib of Wave 1)
Wave 3: Impulse to ₹6,246.25
Wave 4: Currently correcting between 38.2%–61.8% Fib of Wave 3 (₹4,680–₹3,712)
✅ Price found support near ₹3,344, which is just below 61.8% retracement – a common zone for Wave 4 completion.
🟫 2. Wave 4 Support Zone – ₹3,712 to ₹3,344:
This zone is acting as a potential reversal base with:
Fib retracement confluence: 38.2%–61.8% of Wave 3
Failed breakdown attempts followed by recovery candles
CHoCH observed in lower timeframes – suggests momentum shift
🟩 3. Breakout Confirmation Level – ₹4,680:
Breaking above ₹4,680–₹4,800 range would confirm Wave 5 activation
Indicates structure validation + bullish resumption
Close above this zone = strength & momentum breakout
📈 4. Wave 5 Target Projection – ₹6,595 to ₹7,019:
Calculated using:
113%–127% Fibonacci extension of Wave 3
Historical rally symmetry from Wave 1 and 3
Target zone offers positional upside potential of ~55%+
🛑 5. Stop Loss & Invalidation Level:
SL Zone: ₹3,344
Sustained breakdown below this invalidates Wave 4 base
Can lead to sharp drop toward ₹2,600–2,900 (next Fib cluster)
✅ 6. Trade Plan (Swing):
Accumulation Zone: ₹3,700 – ₹4,300 (if support structure holds)
Breakout Entry: Close above ₹4,680–4,800
Stop Loss: ₹3,344
Target: ₹6,595–7,019 (Wave 5 zone)
🧠 7. Why This Setup Matters:
Elliott Wave Confluence: Clean 1–2–3–4 formation
Textbook Fib Behavior: Wave 2 and Wave 4 within ideal retracement ranges
Defined R:R Structure: Tight invalidation + 1:2+ reward
Momentum Setup: Wave 5 can unfold rapidly once confirmed
📌 Conclusion:
HERO MOTOCORP is poised for a potential Wave 5 rally after a well-behaved corrective Wave 4.
A breakout above ₹4,680 could trigger bullish continuation toward ₹7,000+.
This is a classic trend continuation setup for wave-based swing traders.

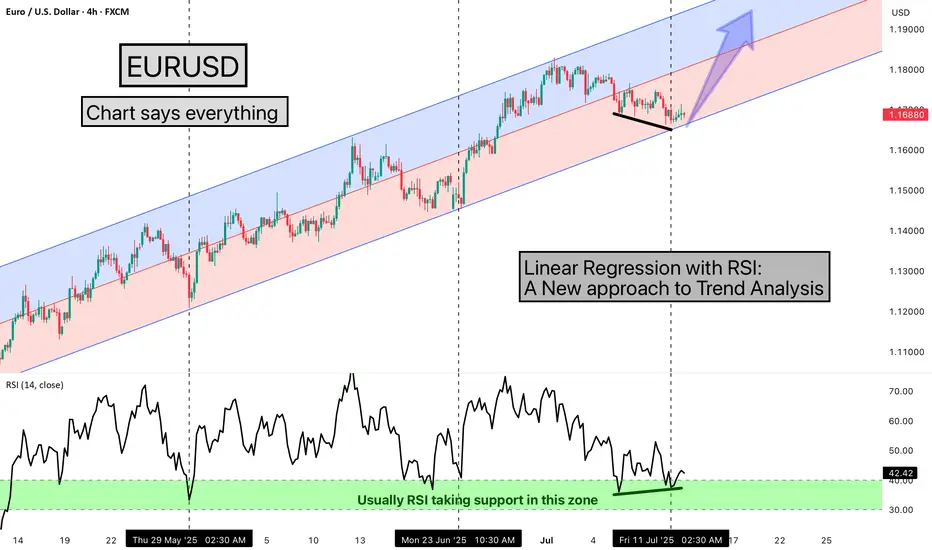
Linear Regression with RSI: A New approach to Trend AnalysisHello Friends,
Welcome to RK_Chaarts,
Today we are going to learn one Method of analysing the chart, here we are using EURUSD chart, and the method we're using is very simple & interesting, We are using the Linear Regression Trend Channel & Relative Strength Index (RSI), What happens in this method, is that we identify a particular zone where the price is making a one-sided move, like if the price is trending upwards, making higher highs and higher lows. We then apply a regression channel to it, and within that channel, we set internal deviation for the upper and lower sides, like 2 or 2.5 or 3 etc., whatever setting it takes.
In this chart, we can clearly see that the 2.5 setting is forming a complete channel, which we've applied for the last two months, from 12th May 2025, when the uptrend started. We've used the 4-hour time frame chart and the RSI. Every time the price hits the bottom of the channel, we can see that the RSI also enters the same zone, between 30-40, and from there, it bounces back.
Currently, the price has again hit the bottom of the regression channel, and the RSI has also gone below 40, between 30-40. And the good thing is that we're seeing a positive divergence in the RSI. So, there's a high possibility that the price might bounce back from here.
It's worth watching what happens next in the market. Nothing is guaranteed here; everything is a game of probabilities. This is one method that we often use, and its results have given us a very good experience. So, let's see what happens next in this chart. This observation is also a good learning experience, which we often encounter, 7-8 times out of 10, in favor of the market, but sometimes it doesn't work, maybe 2-3 times, when the trend changes. So, let's see what happens next.
This post is shared purely for educational purpose & it’s Not a trading advice.
I am not Sebi registered analyst.
My studies are for educational purpose only.
Please Consult your financial advisor before trading or investing.
I am not responsible for any kinds of your profits and your losses.
Most investors treat trading as a hobby because they have a full-time job doing something else.
However, If you treat trading like a business, it will pay you like a business.
If you treat like a hobby, hobbies don't pay, they cost you...!
Hope this post is helpful to community
Thanks
RK💕
Disclaimer and Risk Warning.
The analysis and discussion provided on in.tradingview.com is intended for educational purposes only and should not be relied upon for trading decisions. RK_Chaarts is not an investment adviser and the information provided here should not be taken as professional investment advice. Before buying or selling any investments, securities, or precious metals, it is recommended that you conduct your own due diligence. RK_Chaarts does not share in your profits and will not take responsibility for any losses you may incur. So Please Consult your financial advisor before trading or investing.
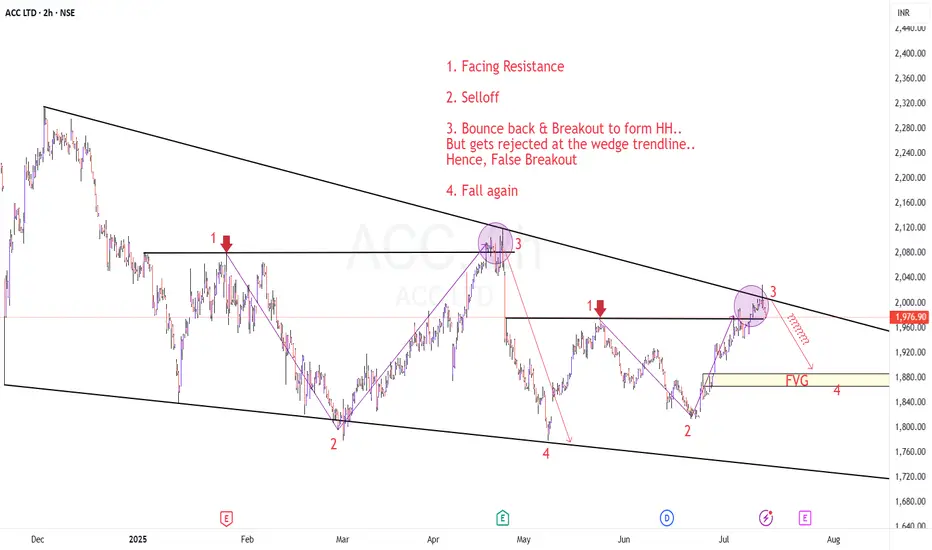
ACC - Rinse and RepeatTF: 2 hours
The pattern is explained in the chart itself.
As per DOW theory, price is making HH by breaking previous Swing Highs.. But, it faces rejection at the falling trendline (Wedge)..
Price tried to breakout from the wedge too, but failed as of now..
A retest of FVG is due at around 1880 levels.. Price action that zone would give us further clue..
Looks like this script will be out of F&O from Aug series.. But worth tracking the set up for learning purposes..
Disclaimer: I am not a SEBI registered Analyst and this is not a trading advise. Views are personal and for educational purpose only. Please consult your Financial Advisor for any investment decisions. Please consider my views only to get a different perspective (FOR or AGAINST your views). Please don't trade FNO based on my views. If you like my analysis and learnt something from it, please give a BOOST. Feel free to express your thoughts and questions in the comments section.
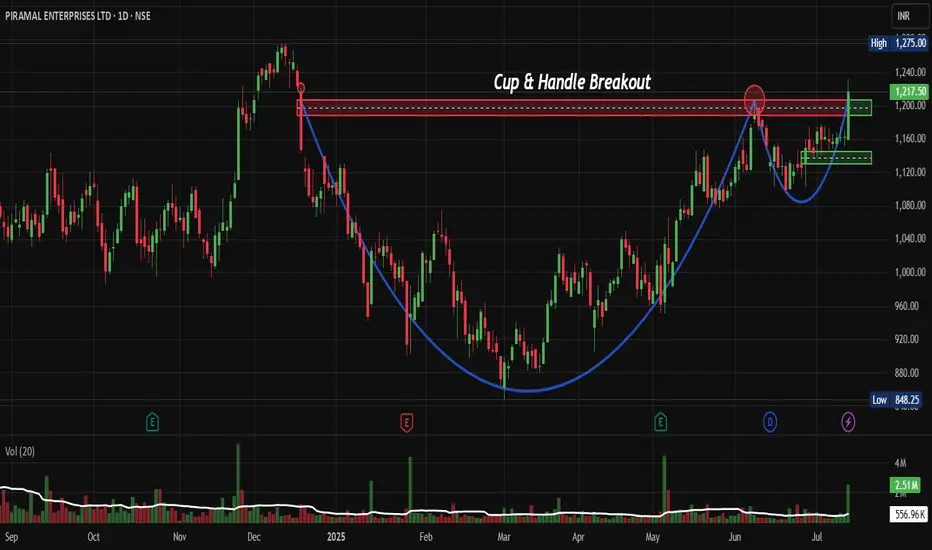
PEL: Perfect Cup & Handle Breakout That Could Double Your MoneyNSE:PEL : The Perfect Cup & Handle Breakout That Could Double Your Money? Let's Analyse
Price Action Analysis:
• Stock has formed a classic Cup & Handle pattern over approximately 8 months (Dec 2024 to July 2025)
• The "cup" formation shows a rounded bottom with the low around ₹850-900 levels in March 2025
• Current breakout above the handle resistance at ₹1,200 levels with strong momentum
• Price has surged from ₹1,158.70 to ₹1,217.50 with a healthy 4.69% gain on breakout day
• The handle formation shows controlled consolidation with lower volumes, indicating accumulation
Volume Spread Analysis:
• Volume spike of 2.51M shares on breakout day, significantly higher than the 20-day average
• During the cup formation, volume was relatively subdued, showing smart money accumulation
• The breakout volume of 556.96K is substantial, confirming the validity of the pattern
• Volume profile shows institutional participation during the base-building phase
Key Support and Resistance Levels:
• Primary Support: ₹1,150-1,160 (previous handle resistance now acting as support)
• Secondary Support: ₹1,100-1,120 (handle low)
• Major Support: ₹1,000-1,020 (cup rim level)
• Immediate Resistance: ₹1,240-1,250
• Major Resistance: ₹1,275 (all-time high)
• Target Resistance: ₹1,400-1,450 (measured move from cup depth)
Base Formation:
• 8-month base formation from Dec 2024 to July 2025
• Base depth: Approximately 35-40% from highs to lows
• Constructive base with multiple retests of support levels
• Base shows characteristics of institutional accumulation with controlled selling pressure
Technical Patterns:
Cup & Handle Pattern:
• Perfect textbook Cup & Handle formation with 8-month duration
• Cup depth of approximately ₹400 (from ₹1,240 to ₹850)
• Handle formed over 6-8 weeks with declining volume
• Breakout above ₹1,200 with expanding volume confirms pattern completion
• Measured target: ₹1,600+ (adding cup depth to breakout level)
Additional Patterns:
• Ascending triangle formation within the handle
• Multiple higher lows during the recovery phase
• Bullish flag pattern preceding the final breakout
• Volume price confirmation throughout the pattern development
Trade Setup:
Entry Strategy:
• Aggressive Entry: ₹1,210-1,220 (on breakout confirmation)
• Conservative Entry: ₹1,180-1,190 (on pullback to breakout level)
• Scale-in Entry: 50% at ₹1,210, 50% at ₹1,190 if pullback occurs
• Entry should be accompanied by volume expansion above 1.5x average
Exit Strategy:
• Target 1: ₹1,320-1,340 (8-10% upside)
• Target 2: ₹1,450-1,480 (20-25% upside)
• Target 3: ₹1,600-1,650 (pattern target, 35-40% upside)
• Partial profit booking at each target level (33% each)
Stop-Loss Management:
• Initial Stop-Loss: ₹1,150 (below handle support)
• Trailing Stop-Loss: Move to breakeven once Target 1 is achieved
• Progressive Stop-Loss: ₹1,250 after Target 1, ₹1,350 after Target 2
• Risk-Reward Ratio: 1:2.5 minimum for the trade setup
Risk Management:
Position Sizing:
• Maximum allocation: 3-5% of the portfolio for this single position
• Scale-in approach recommended for average entry price
• Avoid concentrating more than 10% in the financial services sector
• Consider correlation with other financial holdings
Risk Mitigation:
• Set alerts at key support and resistance levels
• Monitor volume patterns for any divergence signals
• Keep track of broader market sentiment and financial sector performance
• Regular review of stop-loss levels and profit booking strategy
• Avoid averaging down if the stop-loss is triggered
Sectoral Analysis:
Financial Services Sector Overview:
• NBFC sector showing signs of recovery post-COVID consolidation
• Regulatory environment becoming more favourable for established players
• Credit growth revival benefiting well-capitalized NBFCs
• Sector rotation from growth to value creates opportunities in the financial space
Sector Positioning:
• NSE:PEL is positioned in the diversified financial services space
• Benefits from real estate cycle recovery and pharma business stability
• Regulatory changes favouring larger, well-capitalized players
• Sector P/B multiples are still reasonable compared to historical averages
Fundamental Backdrop:
Company Overview:
• Diversified conglomerate with presence in financial services, pharmaceuticals, and real estate
• Strong balance sheet with improved asset quality metrics
• Management focuses on deleveraging and core business strengthening
• Strategic divestments are improving cash flows and reducing the debt burden
Past/Recent Developments:
• Successful completion of major asset sales improves the liquidity position
• Pharma business showing steady growth with new product launches
• Real estate segment benefiting from sector recovery
• Financial services arm gaining market share in target segments
Valuation Metrics:
• Trading at reasonable valuations compared to sector peers
• Improved return ratios and asset quality metrics
• Strong cash generation from core operations
• Debt reduction improving financial flexibility and credit ratings
Growth Catalysts:
• Real estate sector recovery driving housing finance growth
• Pharma business expansion in domestic and international markets
• Potential for higher ROE as leverage normalizes
• Market share gains in target financial services segments
My Take:
This technical setup in NSE:PEL presents a compelling risk-reward opportunity with the stock breaking out from a well-formed base pattern, supported by improving fundamentals and favourable sector dynamics.
Keep in the Watchlist.
NO RECO. For Buy/Sell.
📌Thank you for exploring my idea! I hope you found it valuable.
🙏FOLLOW for more
👍BOOST if you found it useful.
✍️COMMENT below with your views.
Meanwhile, check out my other stock ideas on the right side until this trade is activated. I would love your feedback.
Disclaimer: "I am not a SEBI REGISTERED RESEARCH ANALYST AND INVESTMENT ADVISER."
This analysis is intended solely for informational and educational purposes and should not be interpreted as financial advice. It is advisable to consult a qualified financial advisor or conduct thorough research before making investment decisions.
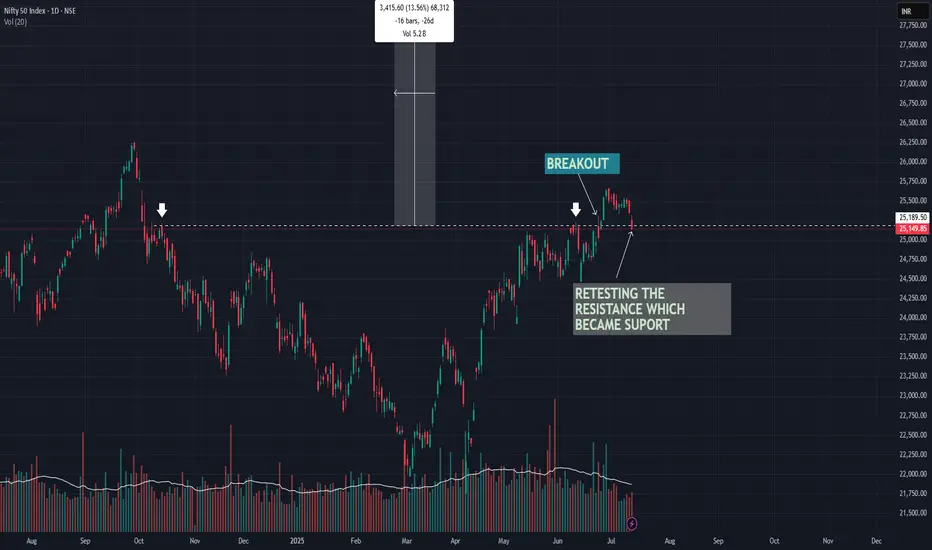
NIFTY AT CRUCIAL LEVELSNifty witnessed the worst fall in past 2 months, thanks to the IT and AUTO sector. There were major reasons fundamentally like rupee falling , Tariffs on canada, weak start to earnings month and FII's selling .
However technically nifty gave a breakout on 25 june from the 25199 level and post 3 weeks it could not sustain that level due to prolonged selling and global uncertainties. Nifty is basically retesting the breakout and i feel it would consolidate here for a while and then take further leap on the upside and making all time high
I feel nifty can still rally 13% if it sustains this 25189 - 25149 levels
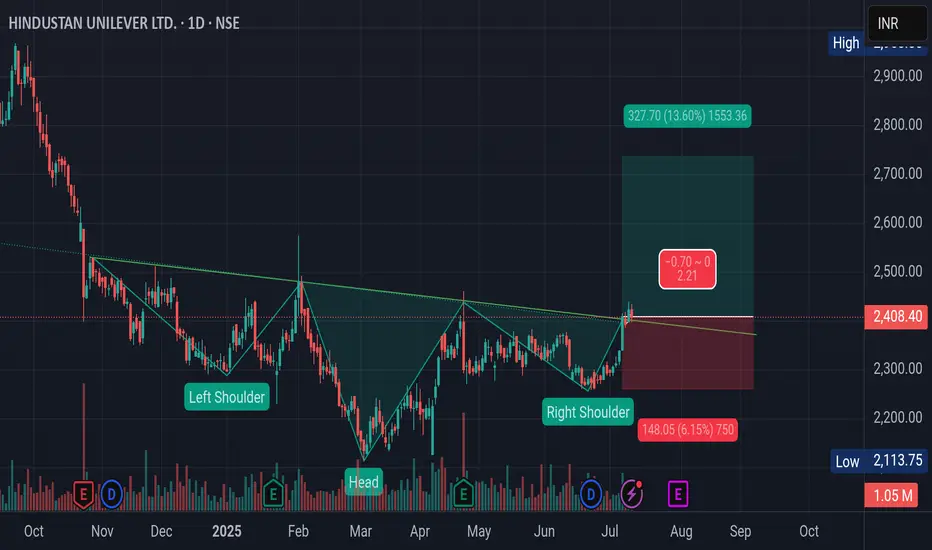
HUL has given Breakout from an inverted H & S pattern.Hindustan Unilever has given Breakout from an inverted Head and Shoulder pattern on daily candle with a good volume.
Entry, SL and Target are mentioned in chart.
Also, respective index is also in positive structure which gives more assurance of the target hit.
However, one should be cautious about price being slip to SL as the Nifty has changed its structure to lower high lower low. Which may drag price downwards for short term or with momentum.
Note: This analysis is for Educational Purpose Only. Please invest of trade after consulting a professional financial advisor.
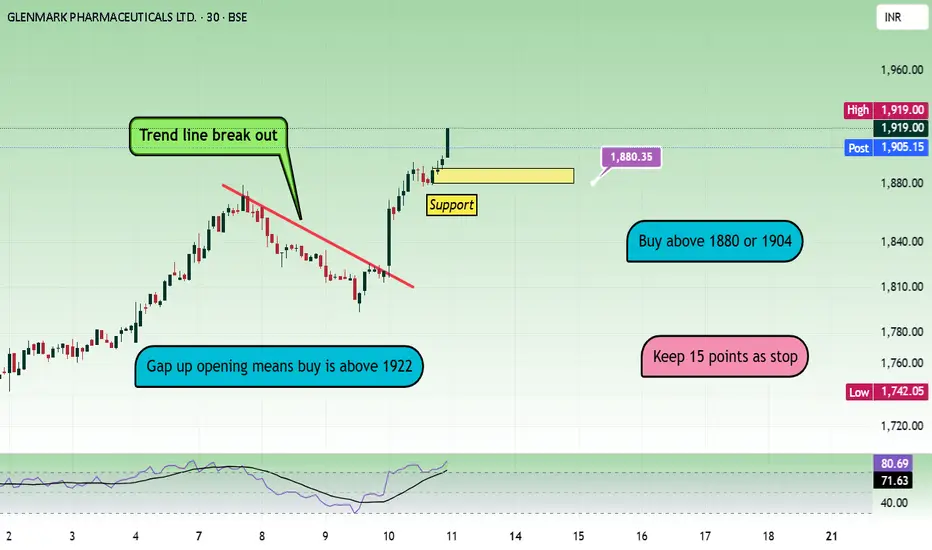
Glenmark - Will mark a higher zone?!The stock which lifted pharma index today was Glenmark. Though nifty was falling, pharma sector managed to sustain and Glenmark rocked.
So what we can expect in the coming days?
Daily chart shows a steady uptrend.
In gap up scenario, buy level is above 1922 - 1926 with the stop loss of 1906 for the targets 1944, 1958, 1972, 1988 and 2002.
Flat opening scenario means we can buy above 1902 - 1905 with the stop loss of 1885 for the targets 1920, 1944, 1972, 1988 and 2002.
Price is bullish as long as it sustains above 1870 - 1880.
2000 zone is a psychological zone and some profit booking can happen. And sustaining above that can make price to move towards 2080 and 2160.
Always do your own analysis before taking any trade.
Bharat Bijlee Ltd Date: 09/07/2025, Closing Price: 3104Bharat Bijlee Ltd
₹ 3,104
3.22%
09 Jul - close price
Date: 09/07/2025, Closing Price: 3104
If price breaks above RS 3201 in daily timeframe, then 1st Target is 3422, 2nd target is 3475, Stoploss your own.
DISCLAIMER:
I am not a SEBI-registered advisor. The content shared, including charts, ideas, and analysis, is purely for educational and informational purposes only. This should not be considered as financial or investment advice. Please do your own research or consult with a SEBI-registered professional before making any trading or investment

I still don't believe in Nifty and Banknifty move So as we studied yesterday "the Intraday trend was up" and that reflected today.
However, must note that this move came as a short covering before the expiry. Also, we did not close above 25600 yet.
My view of a sharp pull back is still intact.
The technicals are also not confirming the momentum. We need to cross 25600 and that too on a sharp move.
Buyers outnumbered sellers with 14.5 million volume but also felt pressure from upwards. Looks like Smart Money is booking profit on every bounce.
Intraday Levels for Nifty:
Support 25477
Resistance 25600
Same happened in #BankNifty. I don't believe the move of today unless this help us achieve new high on the index.
BankNifty levels:
Support 57117
Resistance 57534
Won't be opening any new positions. Will use the bounce for profit-booking. Like Institional players.
That will be all for the day. Take care. Avoid MTF.
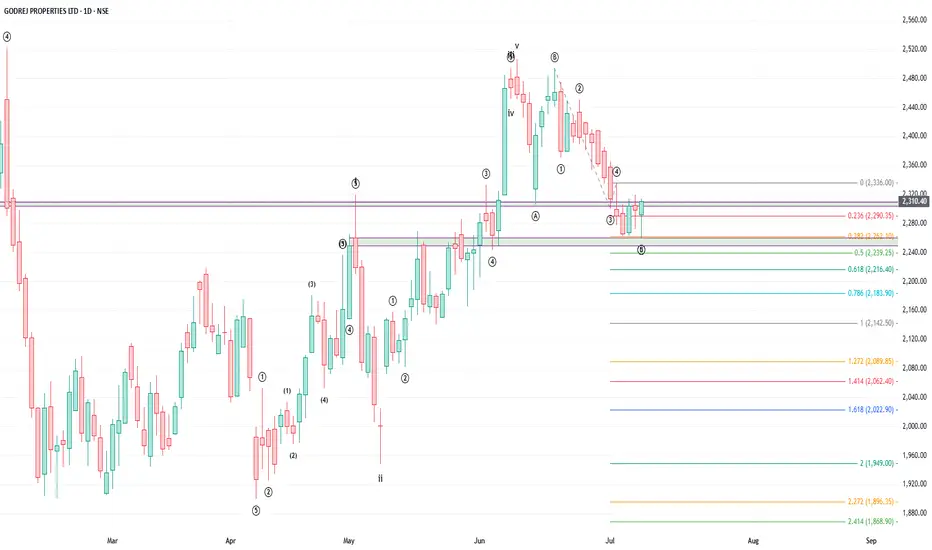
Buy Godrej Properties, target 2736, timeframe 2-3 monthsGodrej Properties completed its first impulse after the Sep'24-Mar'25 correction on 10 June '25 and has been undergoing correction (possibly) in the form of a zigzag.
There is a good possibility that wave C of the zigzag has been completed at fibo 0.382 of wave 0-3. One may reasonably assume that the next wave could be of minimum 78.6% of the impulse that has been completed which gives a target of 2736.
Maintain stoploss of 2180.
Happy Trading!!
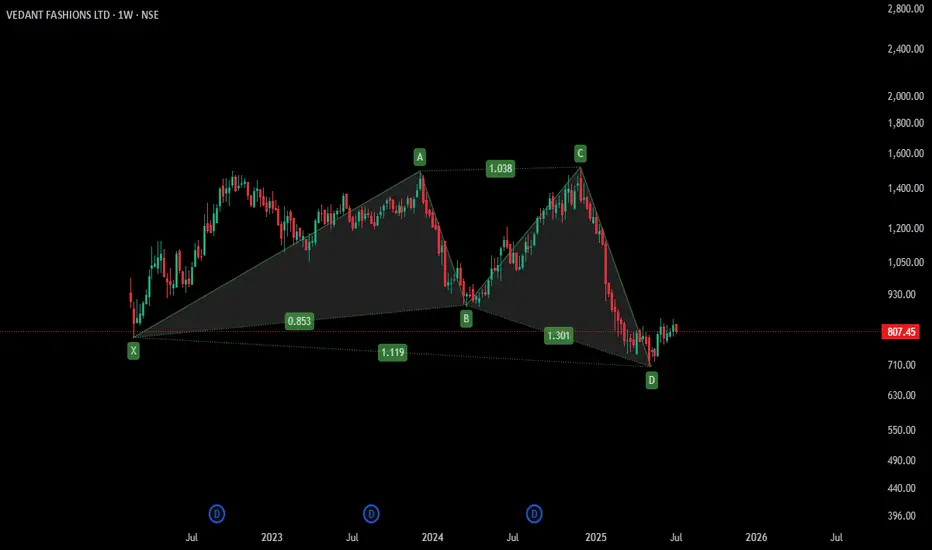
Stock Alert: Vedant Fashions ( $NSE:MANYAVAR)
📢 Stock Alert: Vedant Fashions ( NSE:MANYAVAR )
🗓️ *Date: 8 July 2025*
🔹 **Chart Setup:**
✅ Bullish Gartley pattern completed at ₹740–760
📈 Weekly reversal confirmed, price now at ₹805
🧭 Weinstein Stage 1 (early accumulation phase)
🔹 **Key Levels:**
📍 Entry: ₹790–800
🔒 Stop-Loss: ₹706
🎯 Target 1: ₹930 (6–8 weeks)
🎯 Target 2: ₹1,050 (3–6 months)
📊 Risk/Reward: 3:1 to 5:1
🔹 **Indicators:**
📉 RSI & MACD turning bullish
📊 Volume spike at bottom → smart money entering
🔁 VWAP support holding
🔹 **Fundamentals:**
💰 EPS & Sales improving
📈 ROE & OPM stable
💳 CRISIL Rating: **AA; Outlook: Stable**
📉 Down 50% from 52W high, near bottom
🔹 **Momentum Score: 7.5/10**
👍 Strong technical base + improving earnings
⚠️ Watch for breakout above ₹930
✅ **Action:** Buy on weekly strength ₹790–800
📌 Add more above ₹930 confirmation
🟢 Looks like a **low-risk, high-reward swing trade** setup with mid-term upside potential.
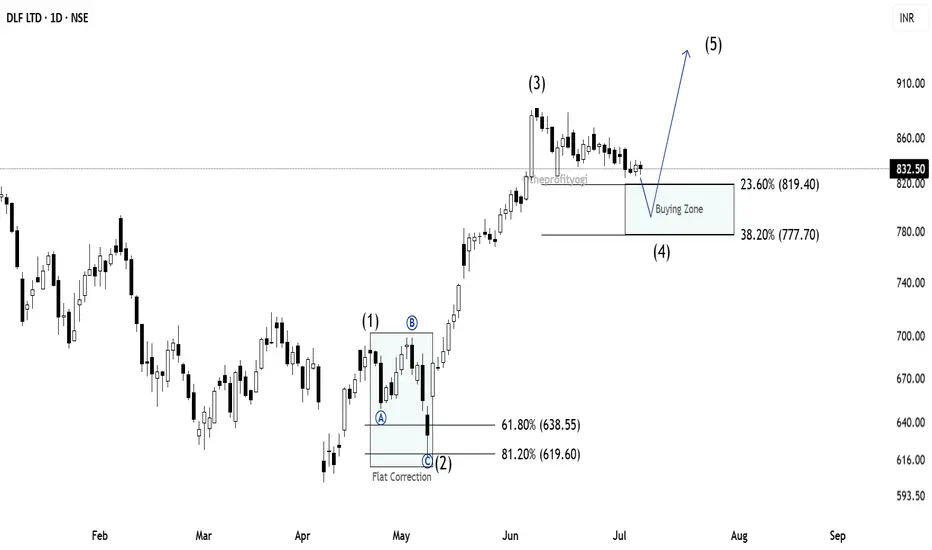
DLF: Elliott Wave AnalysisWe will soon get an excellent buying opportunity in DLF.
As we can see, I have marked DLF using Elliott Wave theory and Fibonacci.
You can see that, after forming wave (1), the market falls to form wave (2). In wave (2), we can see Flat Correction marked with ABC counting.
Price then moved fast, indicating a clear impulse to form wave (3).
Currently, we are in wave (4) in DLF.
As per the rule, we can expect wave (4) to terminate between 23.6% and 38.2%
This is the most probable zone where we can expect a new impulse, i.e., wave (5), to start.
One has to wait for the market to fall in this Buying zone to get a good buying opportunity.
This analysis is based on Elliott Wave theory and Fibonacci.
This analysis is for educational purposes only.
This is not a buying recommendation.
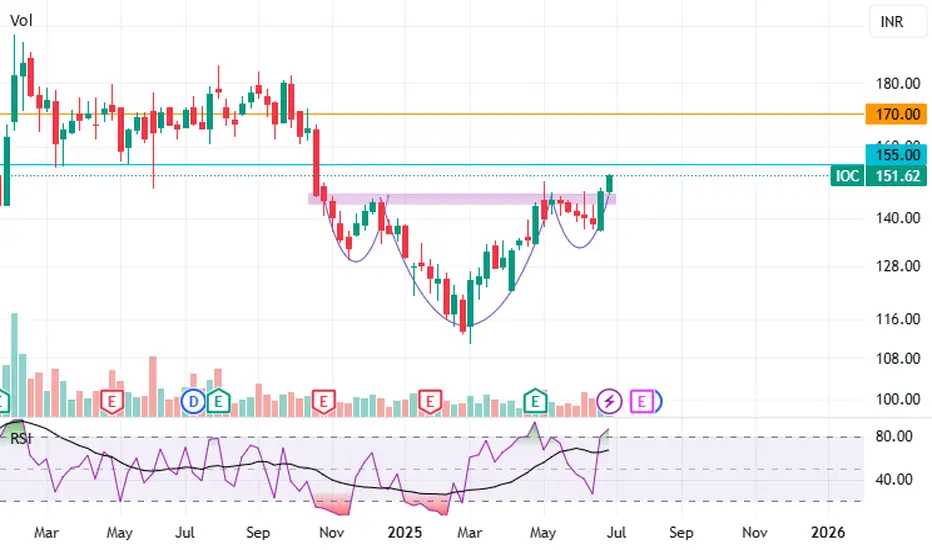
Indian Oil Corporation LtdIOC looks like a strong buy right now. It's got that cup and handle breakout, lots of trading volume, and good moving averages. If it stays above 155 with good volume, we could see it hit 170 soon. Keep 145 as a stop-loss.