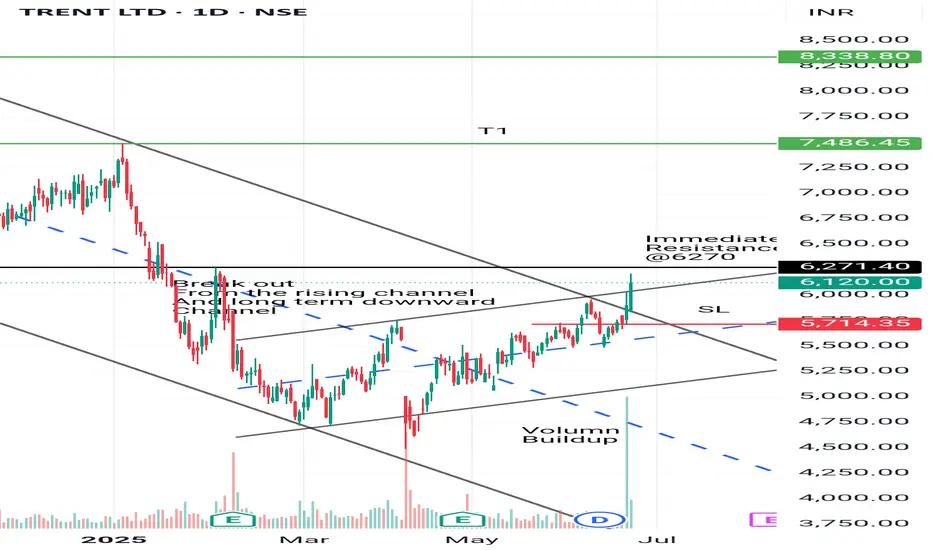
Trent: A multichannel breakout with 1:6 RR
trent was moving in downward channel system 1 from October 24 to May 25
It has form a upward channel system 2 in the last 1 month
Today it made a breakout with significant volumn buildup.
Go long with 50% position on CMP
Remaining 50% could add after week candle confirmation
Sl should be around 5690 with the two target highlighted in green
A trade with excellent RR
Educational purpose! Happy learning 😁😁
Community ideas
NRB Bearing - Cup & Handle PatternNRB Bearing after a downfall has made a cup & handle pattern and is looking to move upward. Other factors:
1. Last few quarters growth rate was not good because of fire in a major factory, which now has been rectified, and capacity has reached at same levels.
2. Capacity expansion of 200 crores
3. Promoter has un-pledged all shares, showing strong financial position
4. Cup & Handle with good volumes.
Keep following @Cleaneasycharts as we provide Right Stock at Right Time at Right Price.
Cheers!!

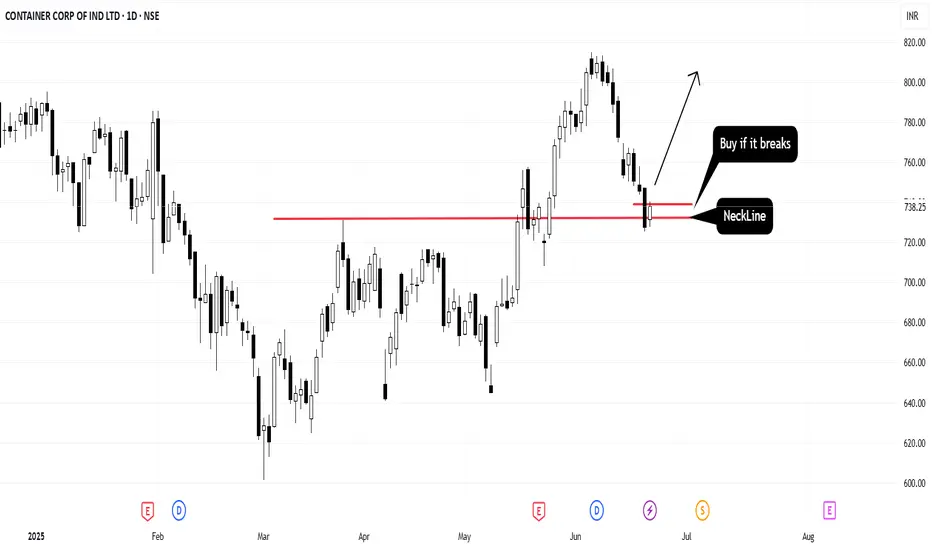
[Positional] Concor Buy IdeaNote -
One of the best forms of Price Action is to not try to predict at all. Instead of that, ACT on the price. So, this chart tells at "where" to act in "what direction. Unless it triggers, like, let's say the candle doesn't break the level which says "Buy if it breaks", You should not buy at all.
=======
I use shorthands for my trades.
"Positional" - means You can carry these positions and I do not see sharp volatility ahead. (I tally upcoming events and many small kinds of stuff to my own tiny capacity.)
"Intraday" -means You must close this position at any cost by the end of the day.
"Theta" , "Bounce" , "3BB" or "Entropy" - My own systems.
=======
I won't personally follow any rules. If I "think" (It is never gut feel. It is always some reason.) the trade is wrong, I may take reverse trade. I may carry forward an intraday position. What is meant here - You shouldn't follow me because I may miss updating. You should follow the system I share.
=======
Like -
Always follow a stop loss.
In the case of Intraday trades, it is mostly the "Day's High".
In the case of Positional trades, it is mostly the previous swings.
I do not use Stop Loss most of the time. But I manage my risk with options as I do most of the trades using derivatives
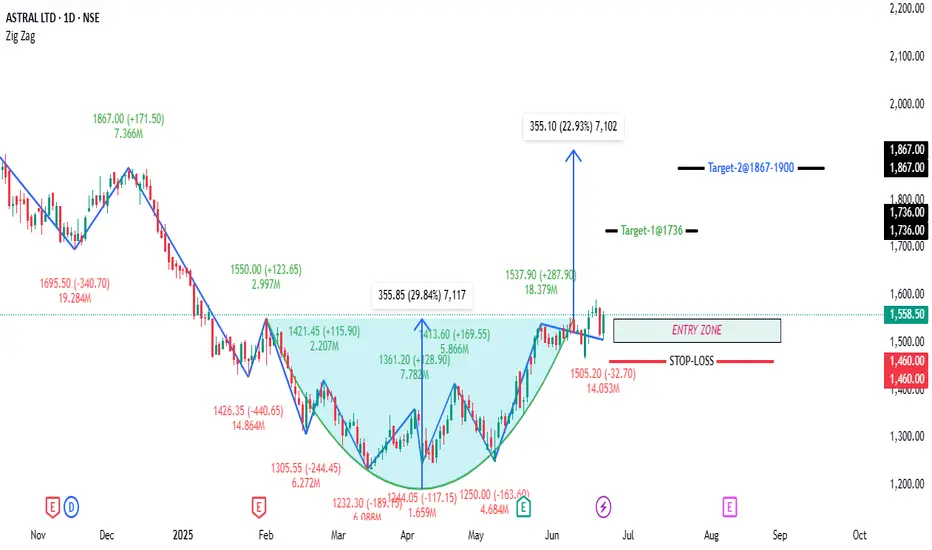
ASTRAL LTD-Rounding Bottom BreakoutASTRAL LTD; CMP: 1558.50
The stock formed a clean rounding bottom from the lows near ₹1230 (Mar 2025) to the breakout above ₹1537.
Breakout occurred with increased volume (18.3M), validating the move.
RSI is at 61.33, indicating momentum is positive but not overbought — favorable for further upside.
The stock has sustained above the breakout zone (~₹1537), which was the neckline and now acts as support.
📈 Long Trade Recommendation
Buy Zone: Current levels around ₹1550–₹1560 (post-breakout pullback and retest looks complete)
Target: ₹1900 (based on height of base: ~355 points from ₹1537 breakout = 1537 + 355)
Stop Loss: ₹1475 (on closing basis) – below recent pullback low and prior support.
Risk-Reward Ratio: 4:1 → Strong trade setup.
🔐 Key Support and Resistance Levels
🔼 Resistance Zones:
₹1650–₹1695: Intermediate resistance (previous swing high from Dec 2024)
₹1735: 1M Pivot Low — may act as resistance due to confluence
₹1867: 1W Pivot High
₹1900: Target zone and psychological round number
🔽 Support Zones:
₹1537: Breakout level (1D Pivot High) — now key support
₹1505: Retest level (recent swing low post-breakout)
₹1482: 1D Pivot Low
₹1475: Stop-loss level — below this structure breaks
A close below ₹1475 would invalidate the bullish setup.
Watch for volume follow-through above ₹1600 levels to sustain the move.
Trailing stop-loss can be adjusted to ₹1537 once price sustains above ₹1650 for multiple sessions
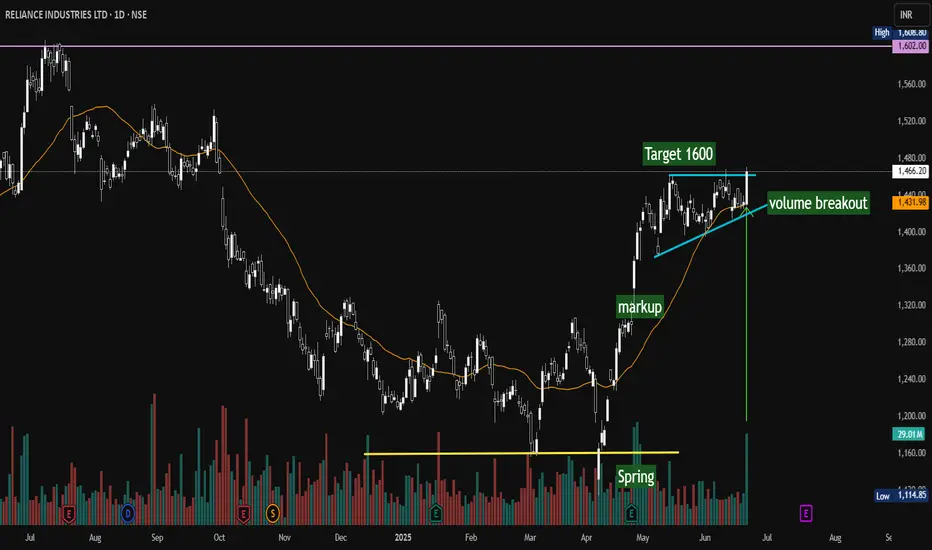
Reliance Daily - Volume Break outReliance Industries Ltd. – Daily Chart Analysis and Trade Idea
The chart depicts a strong bullish setup for Reliance Industries on the NSE with a clear volume breakout confirming upward momentum. Key observations include:
Spring Base Formation: The price formed a solid base around the 1160 level (highlighted in yellow), acting as a springboard for the recent uptrend.
Markup Phase: Following the spring, the stock entered a decisive markup phase, driven by increasing buying interest and positive momentum.
Volume Breakout: Recently, a significant surge in volume accompanied the price breakout above a rising trendline support (blue), indicating strong buyer conviction.
Target Price: Based on the current price action and breakout strength, the target is set at 1600, offering a compelling upside potential.
Moving Average Support: The orange line representing the moving average provides dynamic support, validating the bullish trend continuation.
This technical setup suggests a strong buying opportunity with favorable risk-reward dynamics, provided the volume breakout sustains and the stock holds above the rising support line.
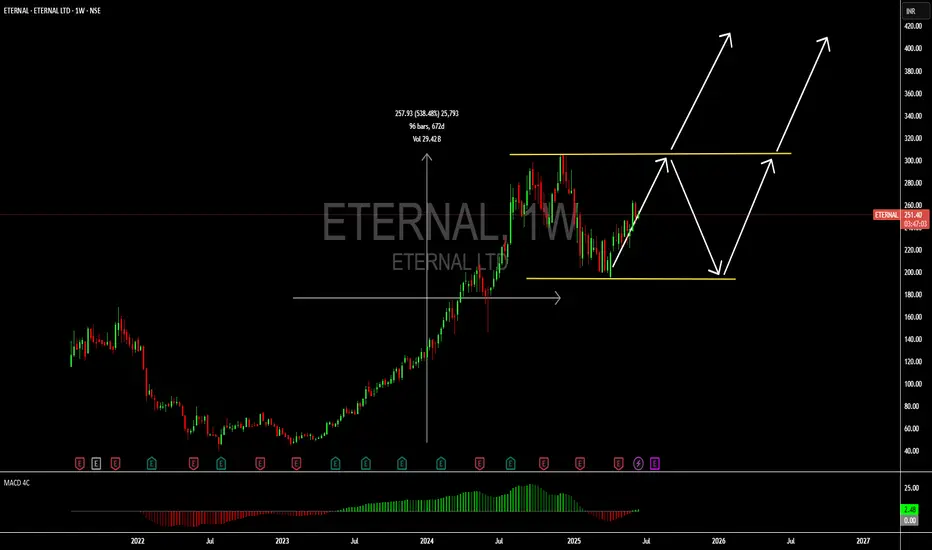
Eternal: An outstanding growth stock in the Indian marketHello,
One of the most requested stock analyses in India is Zomato, now rebranded and listed as Eternal Ltd (Ticker: Eternal). The company is guided by an ambitious vision:
Better food for more people
Instant commerce indistinguishable from magic
World class going out experiences in India
Make India malnutrition free
The company’s businesses are involved in the following businesses
Zomato food delivery: Food ordering and delivery business
Blinkit Quick commerce: Quick delivery (in 10 minutes) of products across categories (fresh, staples, electronics, beauty, general merchandise, festive needs ++)
District Going out: Enabling discovery and transactions across going-out experiences including dining-out, movies, sports and live events
Hyperpure B2B supplies: B2B business supplying quality food ingredients & other products to restaurants and other B2B buyers
The Eternal limited business is showing signs of further potential with the gross revenue increasing over the last 5 years. On a bigger timeframe, revenue has scaled from INR 4.66 billion in 2017 to reach a high of INR 202.43 billion in 2024. The company broke even in 2023 and the net income increased by over 50% in 2024 to reach INR 5.7 billion. With a positive earnings per share, we are confident that there is greater opportunity for early investors. The companies within the holdings continue to build resilient businesses within their lines. The Zomato business has scaled well and can now be seen as sustainably profitable. While Blinkit Quick commerce is yet to achieve profitability we noted that the business is scaling rapidly with the average monthly transacting customers increasing by over 100% in the financial year 2025. This is largely being driven by a business that
Mirrors existing offline customer behaviour in India where frequent top-up purchases are delivered quickly when needed
Addresses majority of customer’s needs across multiple categories such as food (staples and fresh), electronics, beauty, general merchandise, festive needs +)
Is rreliable (quick delivery eliminates the need for planning)
We see immense opportunity in the District going out business since it remains a market that is untapped. District going out is a dedicated going-out app that enables discovery and transactions for multiple going-out experiences including dining out, movies, sports & other live events. We see the opportunity for this business to be used in ticketing and dining/hotel reservations in the future. While the business is yet to achieve profitability, its revenue continues to grow immensely. In the Financial year 2025 alone, revenue for this product line grew by over 186%.
Eternal ltd, the holding entity of all the businesses maintains a robust balance sheet with assets as at the end of 2024 at INR 356.23 billion. Total liabilities for the business as at the end of 2024 stood at INR 53.13 billion. The company has free cashflow of INR 1.87 billion with a huge amount of cash used in investing. This is agreeable since the company is in the growth phase and has a great potential for further growth. We expect that the business should be able to give dividends in the future once it achieves sustainable growth.
From a technical perspective the share price of this stock has grown by more than 5 times. Due to the immense growth in share price of this company, we expected a correction on the stock. The correction is currently happening. The price has reached its 2025 bottom and is bouncing back. The MACD indicator is also showing signs of bullish crossover further confirming the upside trend. We continue to see opportunity for this company and recommend a BUY.
Long term buyers have an opportunity to double their money just by holding this stock.
Short to medium term investors can look for 21% upside as a potential point to look to take profits.
You can get more details on the financial statements, financial ratios, revenue lines, next earnings date on Tradingview via in.tradingview.com
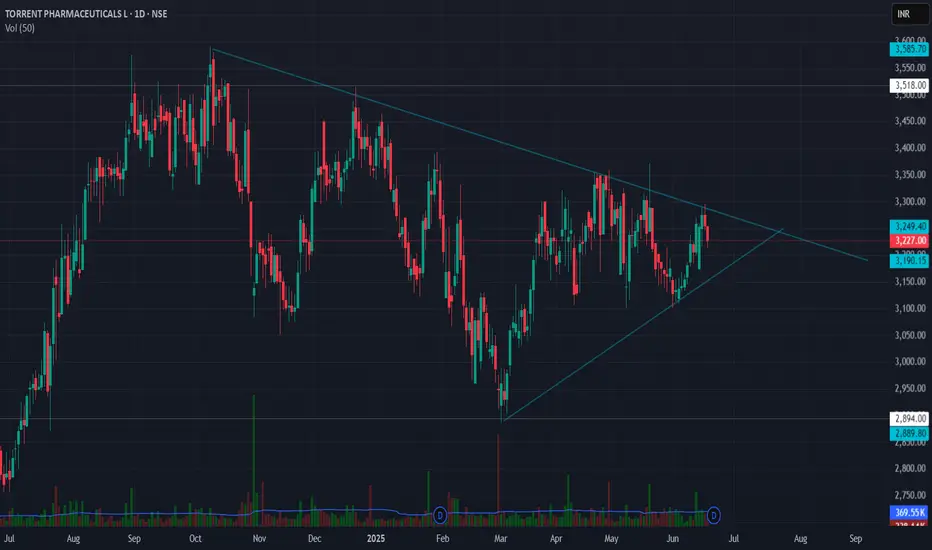
Symmetrical Triangle pattern in Torrent Pharma Symmetrical Triangle Breakout Setup
Torrent Pharmaceuticals Ltd (TORNTPHARM)
Breakout Level: ₹3,300
Stop Loss: ₹3,150 (below triangle support)
Target: ₹4,000 (based on height of triangle)
Risk:Reward: ~2.8:1
✅ Technical Confirmation:
RSI near 52 — momentum shifting bullish above 55.
MACD positive crossover, rising histogram — trend strength improving.
Volume: Awaiting breakout candle with above-average volume for confirmation.
EFI (Elder Force Index) turning positive — signals potential surge in buying force.
📌 Strategy Insight:
A breakout above ₹3,300, backed by volume and momentum, could lead to a sharp trend continuation toward ₹4,000. The symmetrical triangle represents consolidation after trend — a potential bullish continuation pattern.
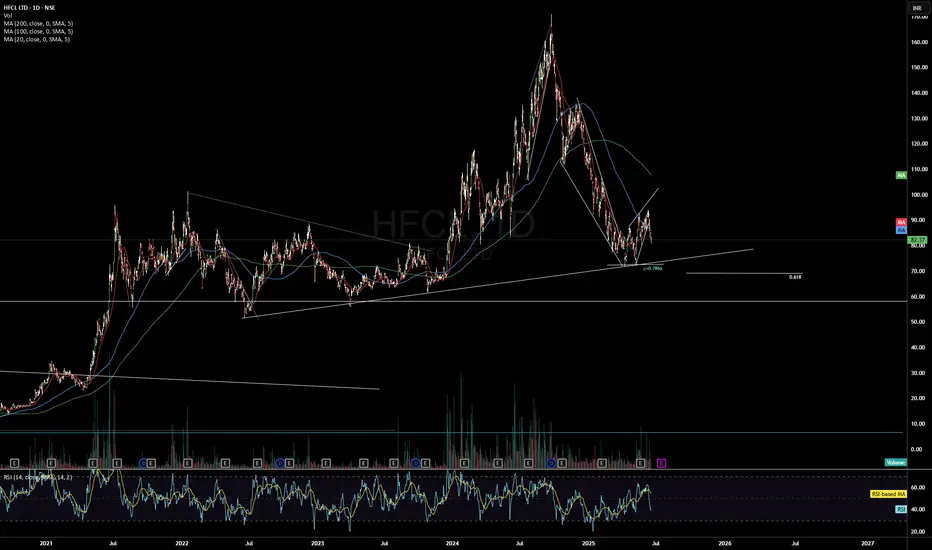
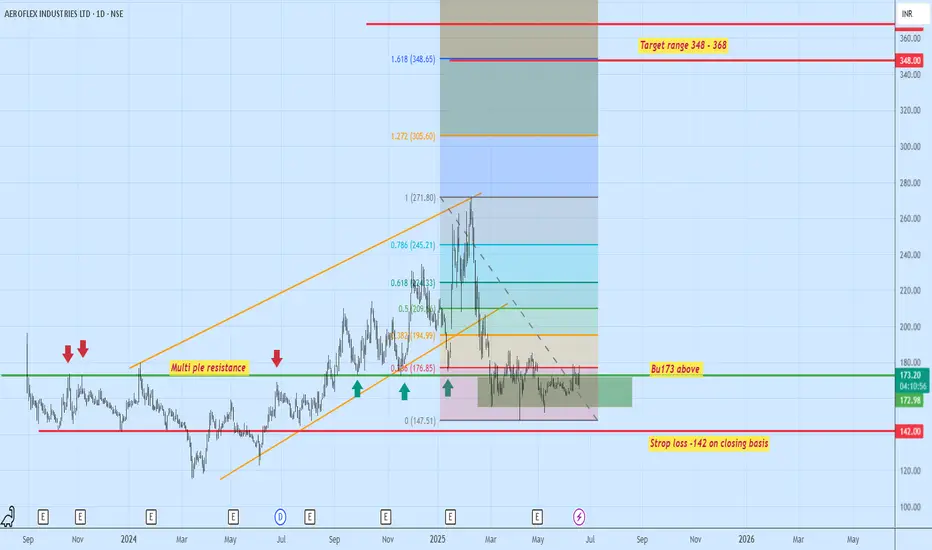
Correction or 1st leg of correction is over -All set for up moveAfter hitting ATH of 171, it corrected to around 70 almost close to 0.618 levels of the up move, so all possibility that its the end of Wave 2, or just the first leg of a corrective Wave 2.
As of now its seems to have formed a leading diagonal and all set to move up,
Whether its going to be an impulse move (wave 3 - a multi bagger possibility) or a corrective B wave is to be seen based on how it develops. Will post updates.
Whatever, we can expect a rally with an initial target of 130 which should be the minimum level of B wave of a FLAT correction.
This view is invalidated if it breaks 70. (breaks on a closing basis)
I analyzed HFCL earlier in 2023 (Linked below), though it doubled as mentioned. It failed to touch my specific targets of 180 and 200+
Disclaimer: I have this stock in my portfolio.
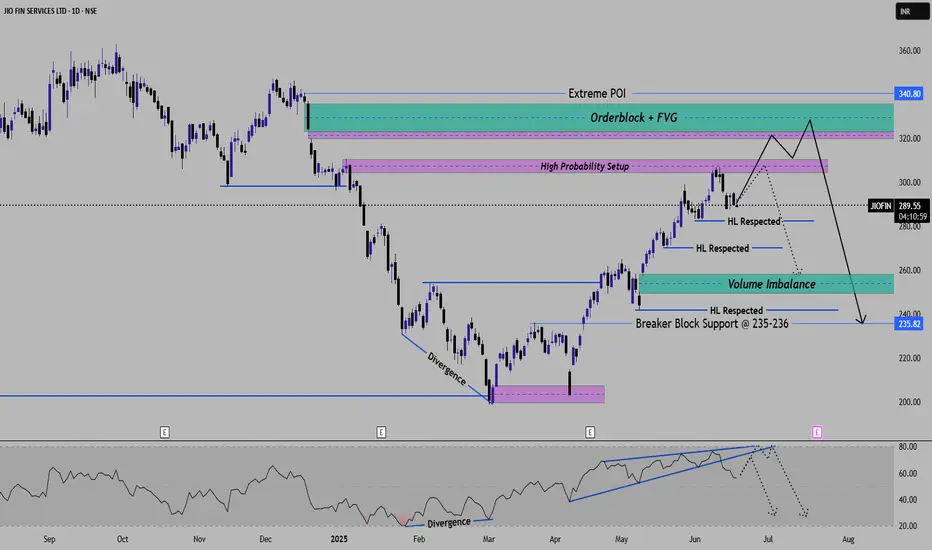
Jio Financial ---- Deep AnalysisJIOFIN -- High Probability Reversal Setup Based on ICT & SMC Concepts
Timeframe - Daily
Projection -- High Probability Reversal Setup expected.
Price Action Overview --
Stock is currently Respecting an internal bullish structure without breaking higher lows.
And stock is currently moving towards High probability POI zone along with --
Order block + FVG is 330-340 levels
Liquidity zone just below the Order block
Liquidity & POI Zone ----
Immediate Liquidity is resting above the levels of 290-300
Imbalance ---
Downside VOlume imbalance between 250-260 levels
below that there is breaker block support zone
RSI ----
Rsi divergence observed at bottom, which shows a bullish move
Rsi showing potential exhaustion or say confluence for reversal after POI is tapped.
Final projection for next 2-3-4 months view -----
Main Target (High Probability) -- Price likely to sweep buy-side liquidity above 300-310
tapping into orderblock + FVG zone 330-340 levels
Expecting strong rejection and sell-off towards Volume imbalance(255) and Breaker block(235)
If main Target Does not go well --- If rejection occures earlier around 300-310 then a partial distribution may trigger
earlier dump into volume imbalance without reaching to Orderblock.
This setup is just reflecting classic Buy-side liquidity grab >>>>> Sell off into imbalance.
Your views or comments are really welcomed. Also just give comments for any confusion or clarification.
#Nifty #Sensex #Jio #Reliance
Good for investment Strengths
• The company has shown a good profit growth of 90.71% for the Past 3 years.
• The company has shown a good revenue growth of 29.98% for the Past 3 years.
• The company has significantly decreased its debt by 44.88 Cr.
• Company has been maintaining healthy ROE of 29.59% over the past 3 years.
• Company has been maintaining healthy ROCE of 31.64% over the past 3 years.
• Company is virtually debt free.
• Company has a healthy Interest coverage ratio of 22.77.
• The company has an efficient Cash Conversion Cycle of 75.84 days.
• Company has a healthy liquidity position with current ratio of 3.46.
• The company has a high promoter holding of 66.99%.
Entry, Target and Stop loss mentioned in chart.
Note: I am not authorized stock analyst. Please do your own financial assessment before investment.
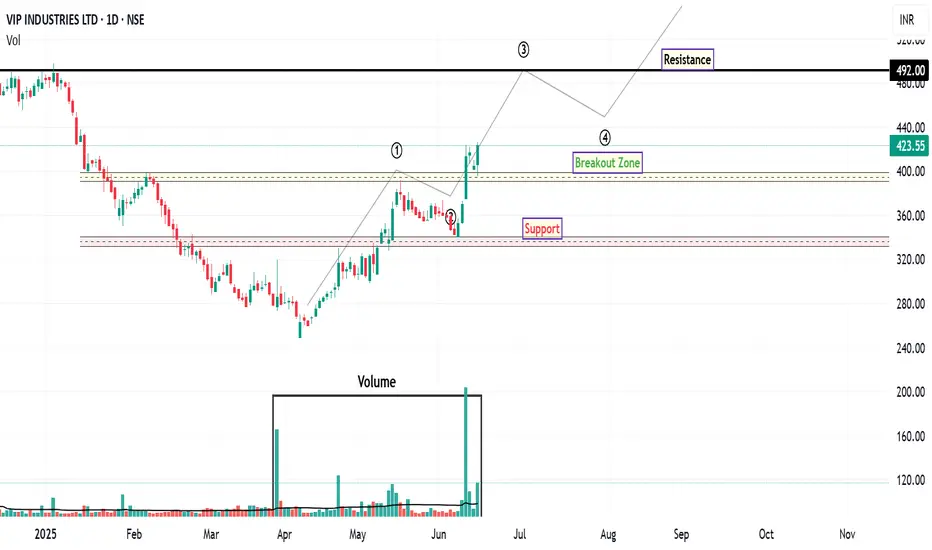
VIPIND: Unlocking Potential After Downtrend
VIP Industries has demonstrated robust bullish momentum over the past few trading sessions, signaling a notable shift in market sentiment. This upward trajectory is particularly significant given the stock's prolonged downtrend since October 2024.
From an Elliott Wave perspective, the recent price action suggests the potential completion of a corrective phase. The retracement from what appears to be Wave 1 to Wave 2 aligns closely with the 61.8% Fibonacci retracement level, which often precedes the initiation of a strong Wave 3 impulse. This potential wave structure, if confirmed, could indicate further upside potential.
A key development supporting this bullish outlook is the stock's recent decisive close above its 200-day EMA, accompanied by a significant surge in trading volume. This confluence of price action and volume confirms strong buying interest and suggests a potential long-term trend reversal. The increased volume further validates the strength of the breakout, indicating broader market participation.
While the immediate outlook appears constructive, traders should be mindful of potential profit-taking around the ₹446 level. This area may present a temporary resistance zone where some short-term corrections or consolidation could occur. However, should the stock successfully navigate this level, the next significant upside resistance target to monitor is ₹492 . This level aligns with prior price highs and could represent a more substantial challenge for further upward movement.
For risk management purposes, a prudent approach would involve considering a stop-loss order positioned below the identified support zone, as depicted on the chart. This strategy aims to mitigate potential downside risk in the event of an unexpected reversal in market sentiment.
Disclaimer: The information provided in this technical analysis is for informational and educational purposes only and should not be construed as financial advice. It is based on observations from the provided chart and commonly used technical indicators. Market conditions can change rapidly, and past performance is not indicative of future results. Always conduct your own comprehensive due diligence and consult with a qualified financial advisor before making any investment decisions.
Bullish Breakout in HCL TechStock breaks above key resistance zone of ₹1770
Strong bullish candle formation on the daily chart
Breakout supported by above-average volume, confirming strength
Price broke out from ascending triangle pattern — a classic bullish continuation signal
📢 Fundamental Trigger:
HCL Tech remains strong in cloud, AI, and digital transformation services
Recent deal wins and strong Q4 results supporting bullish sentiment
Attractive valuation compared to peers like TCS & Infosys

GESHIP Long opportunityThe stock is setting up nicely for a breakout from consolidation and resistance.
The shipbuilding sector remains in focus as government contracts and orders are flowing in for companies.
Cochin shipyard, Mazdock, and GRSE have also moved 25-30% in quick sessions recently.
GESHIP provides a good technical opportunity here and Mutual Funds have also added the stock in the past month/quarters.
DISCLAIMER- I am not a SEBI-registered RA. Kindly do your due diligence and consult your financial advisor.

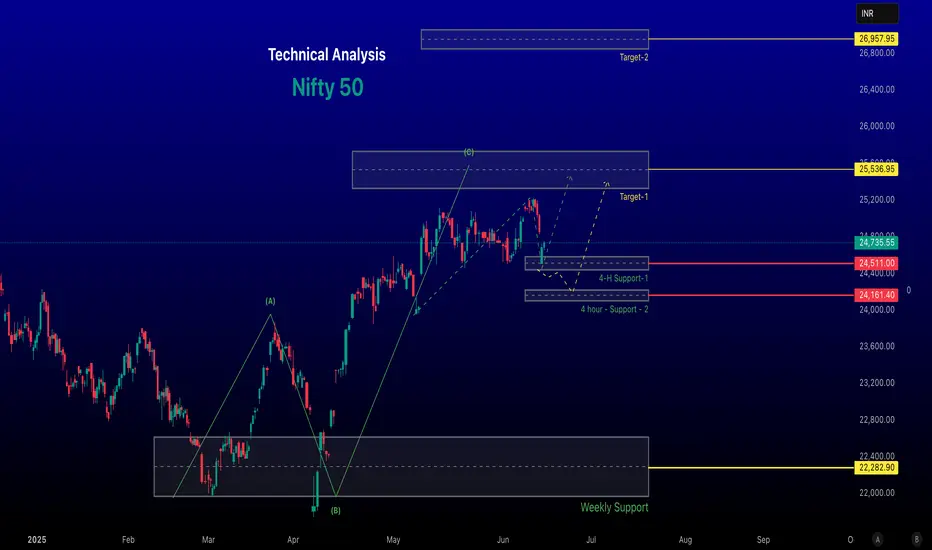
Nifty 50 Weekly Technical Analysis for June 16 – 20 , 2025
~~ Key Technical Indicators and Levels ~~
-- Current Price and Trend:
As of recent trading sessions, the Nifty 50 closed at 24,718 on June 14, 2024, with a marginal decline. The index has been consolidating after a significant rally post-election results, indicating a pause in the bullish momentum.
The short-term trend remains bullish, but the index is showing signs of consolidation near its all-time high.
#Support and Resistance Levels:
Support: Key support levels are identified around 24,500–24,150 (immediate support),
Resistance: Immediate resistance is at 25000–25,100, with a psychological barrier at 25,000. A breakout above 25,100 could target 25,500 in the medium term.
-- Moving Averages:
The Nifty is trading above its key moving averages (20-day, 50-day, and 200-day EMAs), signalling a bullish trend.
A cooling-off in RSI signal a healthy correction before the next leg up.
Chart for your reference
-- Disclaimer --
This analysis is based on recent technical data and market sentiment from web sources. It is for informational purposes only and not financial advice. Trading involves high risks, and past performance does not guarantee future results. Always conduct your own research or consult a SEBI-registered advisor before trading.
#Boost and comment will be highly appreciated
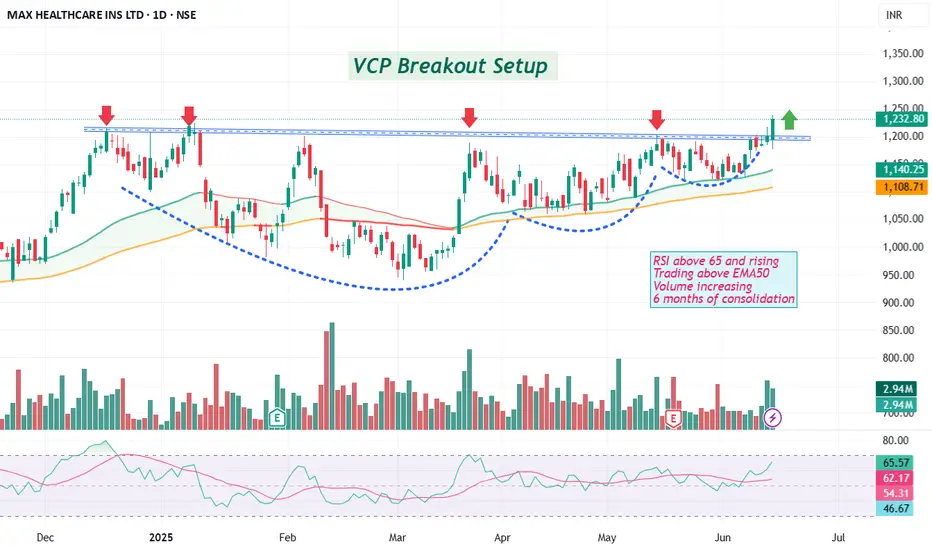
Breakout Alert- MAX HEALTHCAREA classic Volatility Contraction Pattern (VCP) breakout spotted on the daily chart of Max Healthcare!
-6 months of tight consolidation with multiple contraction phases
-RSI > 65 and rising – strong bullish momentum
-Breakout above resistance after multiple rejections (marked with red arrows)
-Volume spike confirms institutional buying
-Trading above EMA50 – trend support holds firm
Watch Zone: ₹1,230+
Support: ₹1,140 / EMA50
Targets (if trend sustains): ₹1,350 / ₹1,500+
Always DYOR (Do Your Own Research) before investing.
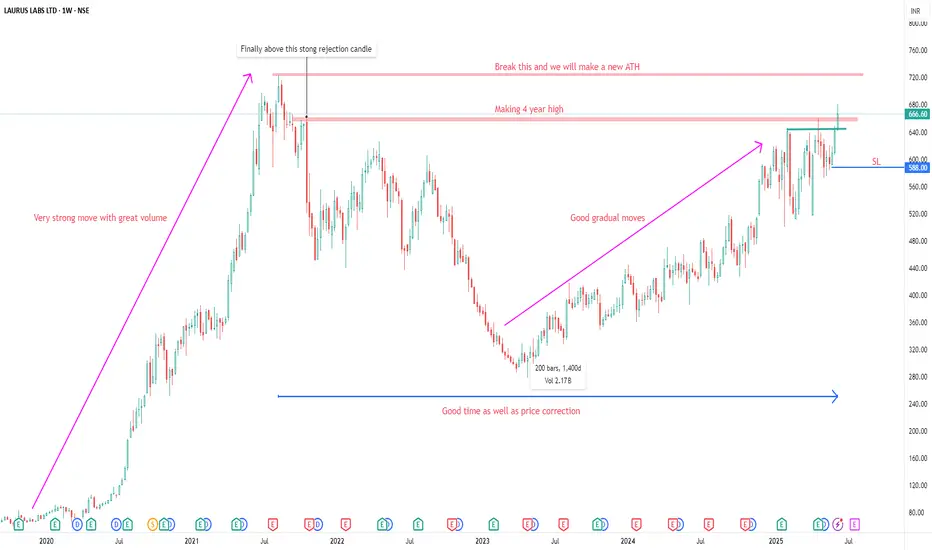
LAURUS LABS LTD ANALYSISFOR LEARNING PURPOSE
LAURUS LABS LTD - The current price of LAURUS LABS LTD is 666.60 rupees
I am going to buy this stock because of the reasons as follows-
1. Its coming out from a good consolidation base
2. It broke a strong resistance zone and making 4 year high
3. It is showing better relative strength as it stood strong in volatile times
4. The risk and reward is favourable
5. The stock is famous and it belongs to a sector which is defensive and has not done much in last weeks so I am expecting some move from that.
6. The stock was very strong in 2020-2021 and it needed a good rest which it got in last 4 years
7. The stock has been outperforming major Index as well as Sectoral Index which is a good sign
I will buy it with minimum target of 35-40% and then will trail after that.
My SL is at 588 rupees
I will be managing my risk.
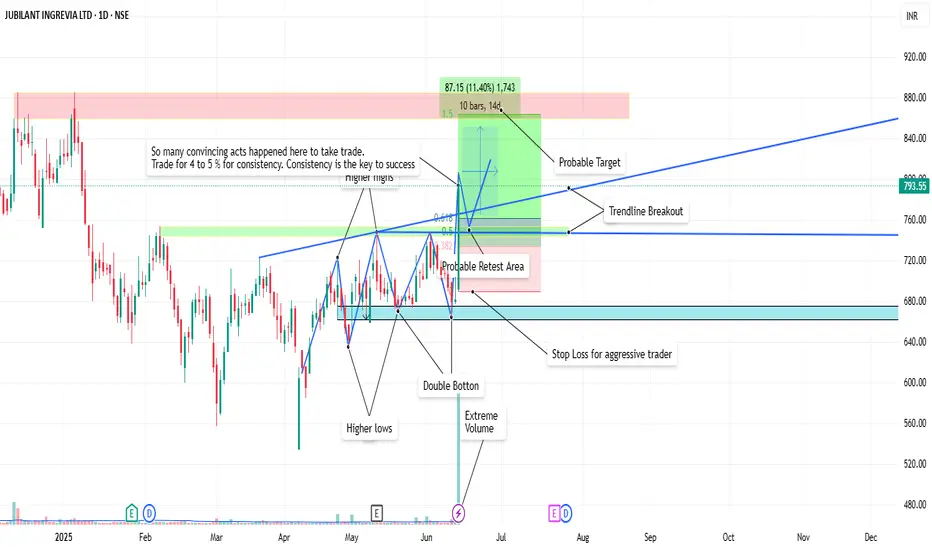
JUBLINGREA Breakout📊 1. Price Action & Pattern Analysis
Breakout Trigger:
Double Bottom at ₹660–₹670 confirmed.
Higher Lows and Higher Highs are clearly visible — a bullish trend structure.
Breakout from trendline resistance with a strong bullish candle on extreme volume confirms buyer interest.
Probable Retest Zone: Around ₹745–₹760, which overlaps with the 38.2–61.8% Fibonacci zone, indicating a good low-risk reentry area if price retests.
Stop-Loss (Aggressive): Just below ₹680 support zone (prior bottom and neckline).
🔍 2. Volume & Confirmation
Massive Volume Spike on breakout day — highest in recent months.
Volume confirms genuine buying pressure, validating the pattern breakout.
🧭 3. Stage Classification
✅ Current Stage: Stage 2 – Markup Phase (Early Stage)
Why:
Breakout from long consolidation.
Volume confirms institutional activity.
Trend structure shifting to higher highs/lows.
Strong retest and breakout of previous resistance zones.
🎯 4. Trade Plan Summary
Metric Value
📌 Entry Range ₹760–₹780 (retest possible)
🧯 Stop Loss (Aggressive) ₹675–₹680 zone
📈 Target 1 (Short-Term) ₹840–₹860 (as shown)
📈 Target 2 (Positional) ₹900+
🔎 Risk–Reward 1:2.5+ (Ideal Swing Setup)
🧠 “So many convincing acts happened here to take trade... Trade for 4 to 5% for consistency.”
✅ Conclusion
This is a classic Stage 2 early breakout with:
Multi-confirmation setup (pattern + trendline + volume)
Well-defined risk-reward
Excellent for swing-to-positional trades
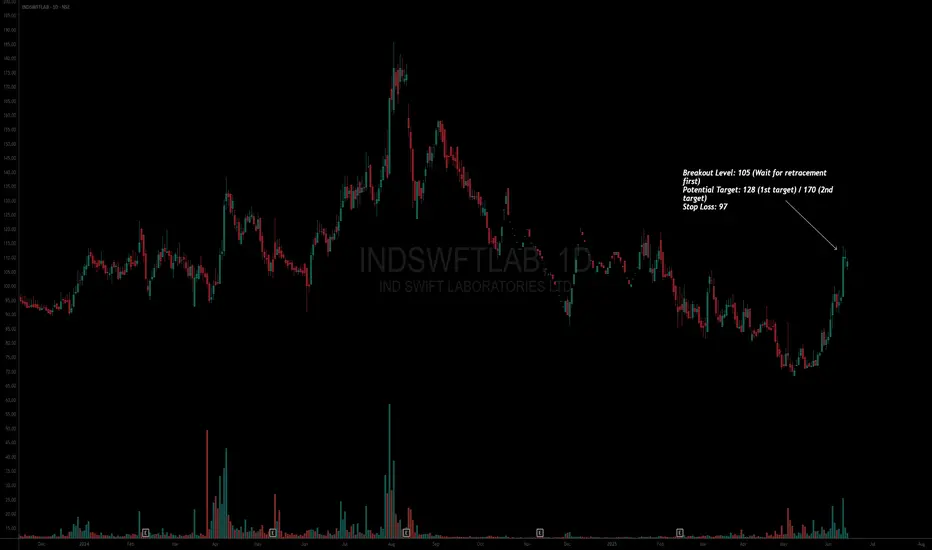
#INDSWFTLABAsset: Ind-Swift Laboratories Ltd (INDSWFTLAB)
Breakout Level: 105 (Wait for retracement first)
Potential Target: 128 (1st target) / 170 (2nd target)
Stop Loss: 97
Timeframe: Short to Medium term
Risk to Reward ratio : 1:3 (conservative for first target)
Rationale:
Fundamentals -
Fundamentally decent stock with the following attributes:
* ROCE - 19.6%
* ROE - 17.4%
* Debt to Equity - 0.02
* Stock PE 7.96 / Industry PE - 33.8 || Stock PBV 0.63 / Industry PBV 3.39 - Company is underpriced
* EPS / Revenue - Increasing over last 6 months
* ADR is 7%
Technicals -
* Overall structure - Price is in the process of making a large rounding pattern and it has recently jumped above the 200 DMA. It will be better to track this stock and enter when the price has retraced and the 10 & 20 DMAs have caught up above the 200 DMA.
* Relative Strength and Momentum slope lines are positive.
* Multiple timeframe analysis - Monthly and Weekly structures are in the process of getting formed.
Market analysis
* The FIIs have suddenly started to show interest in this scrip and hence this has become a candidate for selection and tracking.
* The financials are pretty much ok
* Retail holding has gone down
* Promoters pledge has gone down to zero
* Pharma sector appears strong
* This could be slow accumulation stock although considering high ADR there can be some volatility
Cons
* ADR is low at 3.2% / some reduced holding by DIIs and MFs / Ceiling on left side
This analysis is for educational purposes only and should not be considered as financial advice. Trading and investing in financial markets involve significant risk, and past performance is not indicative of future results. You should conduct your own research and consult with a qualified financial advisor before making any trading or investment decisions. The author is not responsible for any financial losses or damages that may result from the use of this information.
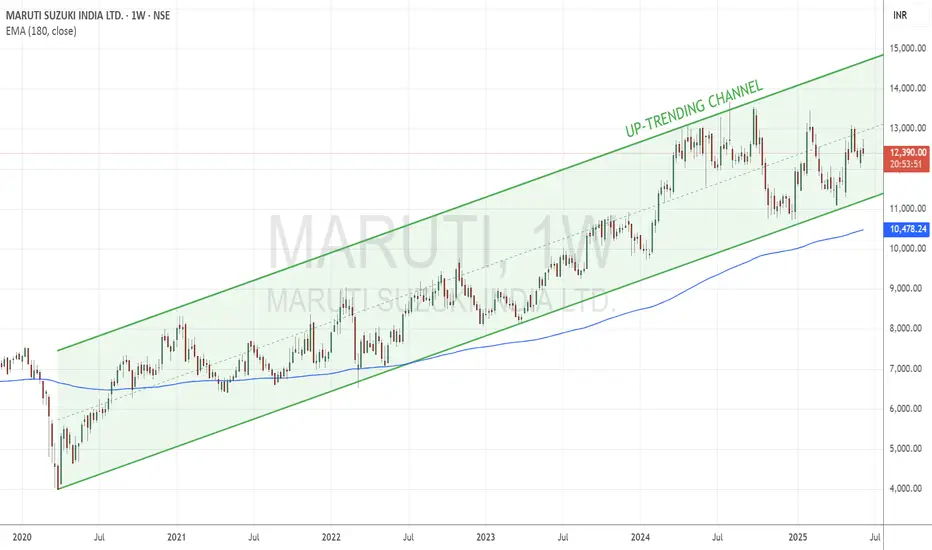
Maruti Moves Steadily Higher Within a Structured Bullish ChannelTopic Statement:
Maruti is on a moderate bullish run, trading within a defined uptrending channel and supported by key price levels.
Key Points:
* The stock is moving in an uptrending channel, making it suitable for consistent channel-based trading
* Price remains mostly above the 180-day EMA, offering good accumulation opportunities near the EMA
* Strong support has been observed at the 13,000 level, with crucial long-term support around 11,000
* A breakout above or below these levels could lead to significant directional movement
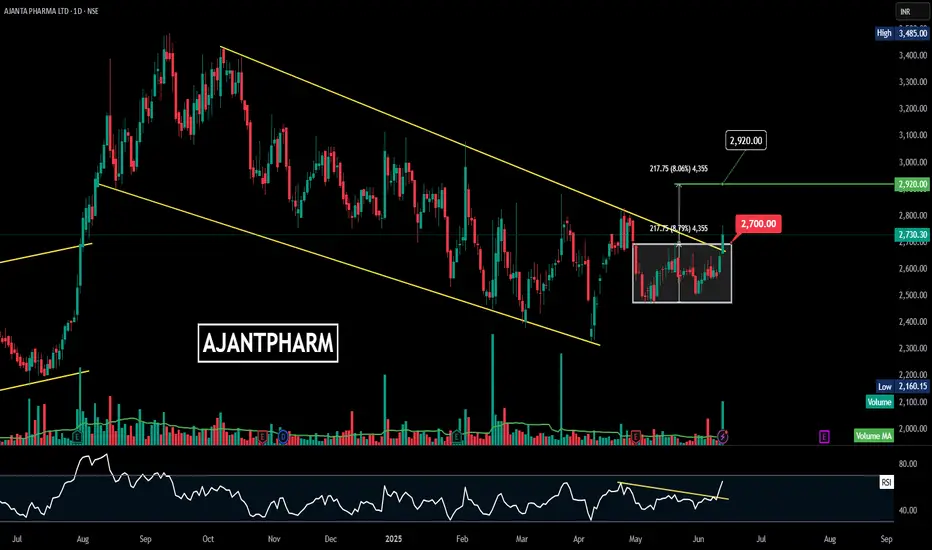
AJANTPHARM | Consolidation | Breakout | Daily--
### 📊 **Technical Analysis Summary:**
#### 🔹 **Chart Pattern:**
* **Falling Channel** (Yellow trendlines): Price has been respecting a downward-sloping channel since mid-2023.
* Recently, the price **broke out above the upper trendline**, indicating a **potential trend reversal**.
#### 🔹 **Consolidation Zone:**
* There was a **rectangle consolidation** (boxed region) between ₹2,480 and ₹2,700.
* The breakout above ₹2,700 confirms bullish intent and may act as a new support.
#### 🔹 **Breakout Target:**
* The measured move from the box is **approx. ₹217.75**.
* Adding to the breakout level gives a projected **target of ₹2,920**.
#### 🔹 **Volume:**
* **Volume spike** on breakout day = strong confirmation of the breakout.
#### 🔹 **RSI (Relative Strength Index):**
* RSI broke out of its own **downtrend resistance**.
* Now trading above 60 = bullish momentum building up.
---
### 🎯 **Levels to Watch:**
| Type | Price (₹) |
| ----------------------- | ----------- |
| **Breakout Point** | 2,700 |
| **Current Price** | 2,730 |
| **Target** | 2,920 |
| **Support Zone** | 2,480–2,700 |
| **Volume Confirmation** | Yes ✅ |
---
### ✅ **Conclusion:**
Ajanta Pharma is showing strong bullish signs:
* Breakout from falling channel
* Volume-backed move
* RSI confirmation
**As long as the price holds above ₹2,700**, the upside towards ₹2,920 remains intact.
Pfizer: supply zone breakout-A simple supply zone breakout
-My entry is at 5800, with a stop loss of 5599
-there has been a volume uptick of late with some interesting developments in the cancer and other fields including expansion in China by the parent company
-Covid resurgence also increases the demand of the vaccine which may again improve the top and bottom line

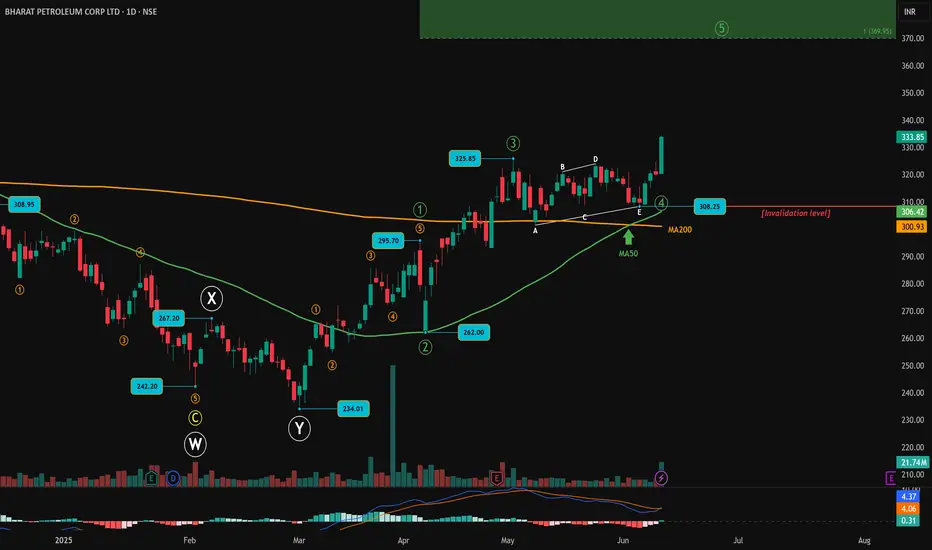
BPCL Breaks Out of Triangle: Wave 5 Takes the WheelBharat Petroleum (BPCL) appears to have completed a correction phase and is now showing signs of beginning its final leg higher. The entire corrective structure ended at ₹234.01. From there, a clear five-wave impulsive rally began, marking the beginning of Wave 1 of a new trend. After a brief correction as Wave 2, the stock surged again to ₹325.85, completing Wave 3. What followed was a contracting triangle, unfolding as an A-B-C-D-E pattern—suggesting a typical Wave 4 consolidation.
The breakout from this triangle came with a strong bullish candle, supported by a spike in volume. Price has now convincingly moved above both the 50-day and 200-day moving averages, with the 200-day MA serving as a platform for the triangle structure itself. This alignment of price, structure, and moving averages supports the hypothesis that Wave 5 has just begun.
MACD has triggered a fresh bullish crossover, adding confirmation to the momentum buildup seen after the triangle breakout. The structure remains valid as long as the price holds above ₹308.25, which marks the end of Wave 4 and serves as the key support level. Additionally, the 50-day moving average (MA50) sits just below, offering another layer of dynamic support. A sustained hold above these zones keeps the bullish bias intact and supports the ongoing development of Wave 5.
Wave 5 targets lie near ₹369.95, which is the 1.0 extension of the Wave 1 length projected from the Wave 4 low. Any pullback toward the breakout zone near ₹308–₹315 could offer a low-risk entry opportunity as long as the structure remains valid.
Chart will be updated as price action evolves.
Disclaimer: This analysis is for educational purposes only and does not constitute investment advice. Please do your own research (DYOR) before making any trading decisions.
"Bearish Reversal Opportunity Following Supply Zone Rejection"1. Double Top Formation (Resistance Level Identified)
The chart displays a clear double top structure at the 2,760–2,800 USDT level.
This level has acted as a strong supply zone (highlighted in red), where price previously reversed, indicating heavy selling interest.
Current price action has retested this resistance zone and shown signs of rejection.
2. Liquidity Sweeps & False Breakouts
On the left side of the chart, an aggressive downward wick (marked with a blue arrow) suggests a liquidity sweep below a key low before strong bullish momentum returned.
This type of price action indicates smart money involvement, designed to remove weak hands before pushing price higher.
3. Accumulation Phases (Sideways Consolidation)
Multiple accumulation ranges are highlighted with blue rectangles.
These ranges show horizontal consolidation, where price builds up energy before breakout.
The most recent breakout led to a vertical rally toward the resistance zone, signaling an end of the accumulation and a start of distribution.
4. Double Bottom Support Structure
Identified near the 2,480 level, marked by red circles.
This level has historically acted as demand/support, evidenced by multiple bounces from this price zone.
Now highlighted with a grey zone, it is projected to act as the next key support area.
5. Bearish Projection
A large black arrow suggests a forecasted bearish move from the current high (~2,800) back to the support zone (~2,480).
This aligns with the idea of a mean reversion or pullback after a strong bullish impulse.
---
Conclusion & Trade Idea:
🔻 Bias: Bearish (Short-term)
The chart presents a classic reversal pattern with a double top at a well-defined supply zone.
Entry could be considered after confirmation of rejection from this level.
🧠 Trade Plan Suggestion:
Entry: Short near 2,780–2,800 after bearish confirmation (e.g., bearish engulfing candle or break of structure).
Target: 2,480 (support zone).
Stop Loss: Above 2,820 (recent high).
Risk-Reward: Approximately 1:2.5 or better depending on execution.
