CADCHF bullish CC buy side equal highs indicates liquidity
Two blue line are buy points .
Valid condition : market must retrace before taking out buy side liq.
Targets is represented by green line for there remains insufficient market double gaps in past price Action.
Good RR
Community ideas

GBP/USD Bullish Break out The British Pound has broken out of a falling channel on the 1H timeframe, signaling a potential bullish move. After a period of consolidation within the downward structure, price successfully broke above the resistance zone around 1.2990, confirming the breakout.
🔹 Breakout Confirmation: Price has decisively moved above the falling channel and prior resistance.
🔹 Target Projection: A measured move suggests a potential upside towards 1.3026, aligning with previous price action levels.
🔹 Market Sentiment: A breakout like this often indicates increased momentum, making it a high-probability setup for trend continuation.

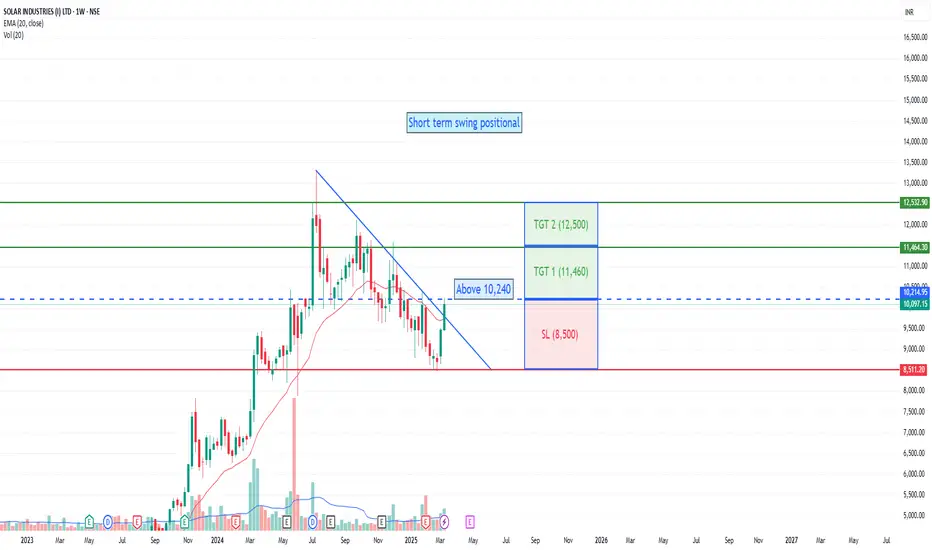
Solar Industries India Ltd. Short term swing positional
Solar Industries India Ltd. (SOLARINDS) has been showing some interesting technical movements recently.
Current Price: ₹10,097.15, with a significant rise of 6.44%.
Moving Averages: The stock is trading above its 20-day Exponential Moving Average (EMA), which is at ₹9,735.05. This indicates a bullish trend in the short term.
Volume: The 20-day average volume is 758.12K, suggesting healthy trading activity
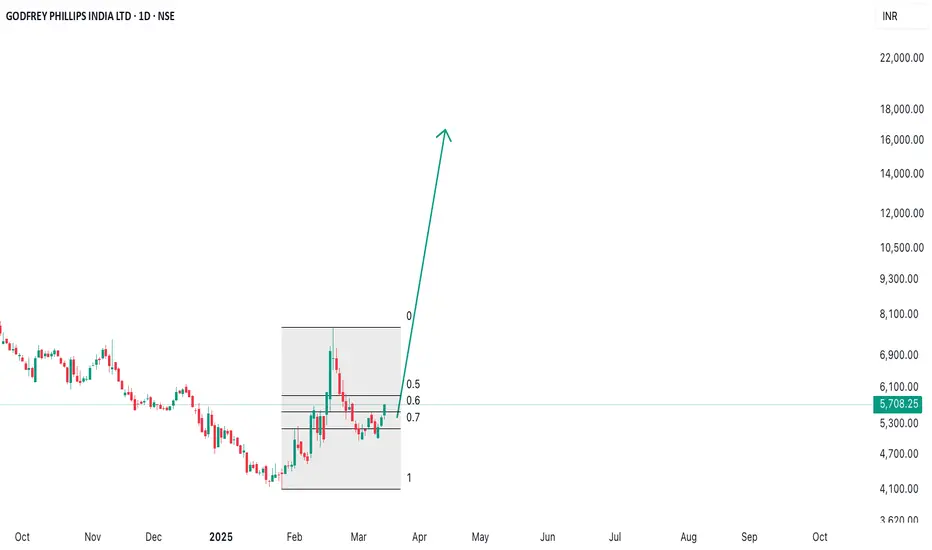
GODFRYPHLP Chart price action analysisBased on the technical analysis of Godfrey Phillips India Ltd. (GODFRYPHLP), the stock is showing positive momentum with some mixed signals:
## Price and Performance
The current stock price is ₹5,708.25, up 5.00% (₹271.80). This indicates strong recent performance and positive market sentiment.
## Technical Indicators
- **RSI**: 55.79, suggesting neutral momentum
- **MACD**: 37.31, indicating a bullish trend
- **ADX**: 18.13, showing a weak trend strength
- **Stochastic**: 19.82, suggesting oversold conditions
- **Williams %R**: -43.69, indicating neutral conditions
## Support and Resistance
The stock has support at ₹4,200 and resistance at ₹8,200. The current price is closer to the support level, suggesting potential for upward movement.
## Volume Analysis
Positive volume balance indicates high volume on days with rising prices and low volume on days with falling prices. This supports the bullish trend.
## Volatility and Beta
The stock has a volatility of 5.79% and a beta coefficient of 1.42. This suggests that GODFRYPHLP is more volatile than the overall market.
## Chart Patterns
The stock has been moving upwards with good speed, but might be retracing. Traders should look for bullish signs near the trendline for potential long positions.
## Overall Outlook
While some indicators show neutral signals, the overall trend appears bullish. Investors should monitor key resistance levels and watch for potential breakouts or consolidations before making trading decisions.
Cummind India | Weekly LevelsStock currently hovering near Weekly Strong support levels, which extends downside upto 2625
As we can see stock is not making new highs but also not making new lows as well
There is also a daily strong area merged in the same zone, which can be considered as a good buying zone, with a downside Sl of 2600 (Closing basis)
If it manages to hold the mentioned area, then we can see a good upside upto 3250 / 3300 areas
Risk to reward ratio looks good
Lower time frame confirmation is a must
Broader market is bearish as well as chopp, so be cautious

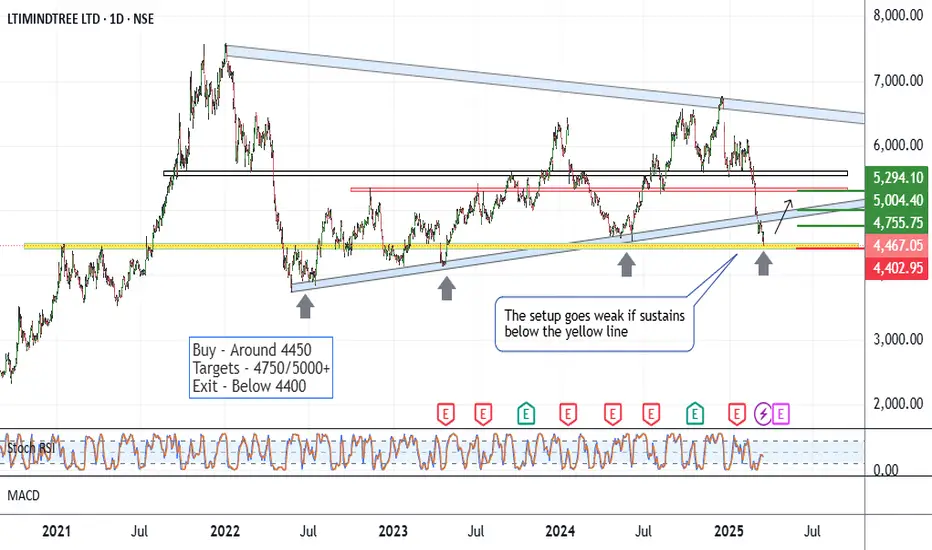
LTIM - Low Risk IdeaCMP 4467 on 16.03.25
The chart shows all the critical levels. The price has corrected around 30% in recent weeks. At this moment, it is on support, as seen in the chart.
Considering a possible reversal from the current levels gives an idea of buying with a small risk.
Possible targets may be 4750/5000 and even more, depending on the index movement ahead.
The setup goes weak if the price sustains below 4400 for a couple of days. In given conditions, the strategy should include Hedging tools for better coverage.
All these illustrations are only for learning and sharing purposes, not a buy or sell advice in any case. I am not a registered analyst.
Before entering a trade, be ready to take a loss on what you have decided.
All the best.
Larsen & Toubro: At Key Support After Strong Multi-Year RallyTechnical Analysis:
L&T has shown a strong bullish sentiment over the past two decades. The stock has experienced significant growth, with notable annual increases:
2021: +47.24%
2022: +10.02%
2023: +69.05%
2024: +2.32%
The stock created an all-time high of ₹3,963.5 in December 2024, followed by a phase of profit booking and correction. Currently, L&T is consolidating within the ₹3,100-₹3,300 support zone, which has served as strong support multiple times in February, May, June, and October 2024. The stock's next move within this zone will determine its future trend.
In this bullish rally, we have observed multiple instances where the stock faces a major resistance, breaks out, and then the same resistance turns into a support, leading to new higher highs. This pattern has been consistent since 2018, reinforcing the stock’s bullish structure.
Currently, the stock can either:
Break out from the support zone and move towards an All-time high, or
Break down from the support zone, retest it as resistance, and continue a correction phase.
For a bullish scenario, traders should watch for strong support confirmation with bullish candlestick patterns. For a bearish scenario, the stock must show strong rejection from support with bearish patterns.
Fundamental Analysis:
L&T's Q3 FY25 results showed strong revenue growth, though profitability was impacted by rising costs. Below are the key financial metrics (values in ₹ crore):
Total Income: ₹64,668 in Q3 FY25, ₹51,024 in Q2 FY25, ₹55,128 in Q3 FY24.
Total Expenses: ₹59,460 in Q3 FY25, ₹46,302 in Q2 FY25, ₹50,290 in Q3 FY24.
Total Operating Income: ₹5,208 in Q3 FY25, ₹4,722 in Q2 FY25, ₹4,838 in Q3 FY24.
Profit Before Tax: ₹5,333 in Q3 FY25, ₹5,555 in Q2 FY25, ₹4,772 in Q3 FY24.
Profit After Tax: ₹4,001 in Q3 FY25, ₹4,113 in Q2 FY25, ₹3,595 in Q3 FY24.
Diluted Normalized EPS: ₹24 in Q3 FY25, ₹25 in Q2 FY25, ₹21 in Q3 FY24.
Quarterly Performance Insights:
L&T's Q3 net profit rose 14% YoY to ₹3,359 crore, though it missed expectations due to EBITDA margin contraction of 70 basis points to 9.7%.
Operating margins were impacted by a 50% increase in raw material and component costs and a 16% rise in construction material consumption.
Revenue was expected to increase 18% YoY to ₹65,065 crore, with net profit projected to increase 24% YoY from ₹2,947 crore.
L&T secured ₹1,16,036 crore in new orders, reflecting 53% growth YoY.
Infrastructure projects saw an order inflow of ₹49,070 crore, up 13.6% YoY.
Conclusion:
L&T has a strong long-term bullish structure, with higher highs and higher lows. The ₹3,100-₹3,300 support zone is crucial for the stock’s next move. A breakout above this zone with strong volume could push L&T towards an All Time High, while a breakdown could signal further profit booking.
Disclaimer: This analysis is for educational purposes only. Investors should conduct their own research before making any trading decisions.

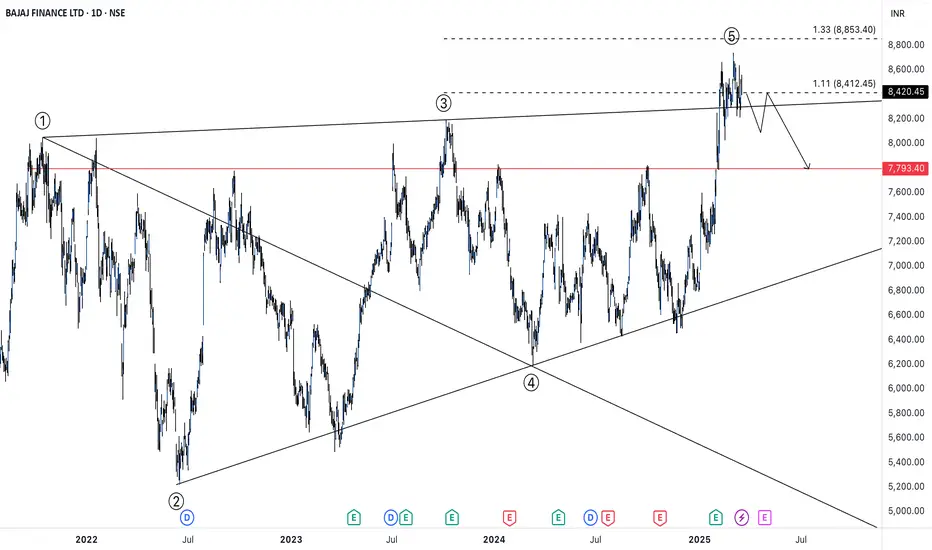
BAJAJ FINANCEIn this entire rally of NIFTY towards the downside since few months, BAJFIN has acted in a defensive way for the time being. But currently a Bearish Wolfe Wave pattern is emerging in the stock indicating that the stock can show a potential downside.
The target remains to be at 7793 once it trades below 8820. There are few reasons to justify the potenial downside.
1. Bearish Wolfe Wave Pattern
2. Exxagerated RSI Divergence pattern
3. Emerging Head and Shoulder pattern
Even though NIFTY is a very low and people hoping for a bottom out soon, the chances of the stock coming down may be fairly less. But who knows even if NIFTY falls by 200 points may be BAJFIN may turn out to be the biggest contributor for the day.
Its advisable to not go long on this stock and short only after confirmation(once it breaks below 8820) for the target of 7793. SL remains to be at 8650 on closing basis.
Chart and Anlysis
Adarsh Kumar Dey
BALKRISIND 1HRSWING TRADE
- EARN WITH ME DAILY 10K-20K -
BALKRISIND Looking good for Downside..
When it break level 2476 and sustain.. it will go Downside...
SELL @ 2476
Target
1st 2430
2nd 2381
FNO
BALKRISIND MAR FUT – LOT 7 (Qty-2100)
BALKRISIND MAR 2580 PE – LOT 7 (Qty-2100)
Enjoy trading traders.. Keep add this STOCK in your watch list..
Big Investor are welcome..
Like this Post??? Hit like button..!!!
Follow me for FREE Educational Post and Alert..

Stock Analysis: Ashok Leyland LtdIntroduction:
Ashok Leyland is the flagship Company of the Hinduja group, having a long-standing presence in the domestic medium and heavy commercial vehicle (M&HCV) segment.
Fundamentals:
Market Cap: ₹ 57,741 Cr.;
Stock P/E: 20.7 (Ind. P/E: 18.84); 👎
ROCE: 15.0% 👎; ROE: 28.4% 👍;
PEG Ratio: 0.22 👍
3 Years Sales Growth: 33% 👍
3 Years Compounded Profit Growth: 206 % 👍
3 Years Stock Price CAGR: 21% 👍
Technicals:
Ashok Leyland has been in a downtrend since attaining 262 levels in Aug 2024.
The stock price has fallen below all the significant support levels like 20, 50, and 100 EMAs.
Resistance levels: 237, 262
Support levels: 193, 178
Cons:
Promoters have pledged 30.1% of their holding
FII/FPI decreased their shareholding last quarter
Companies with High Debt

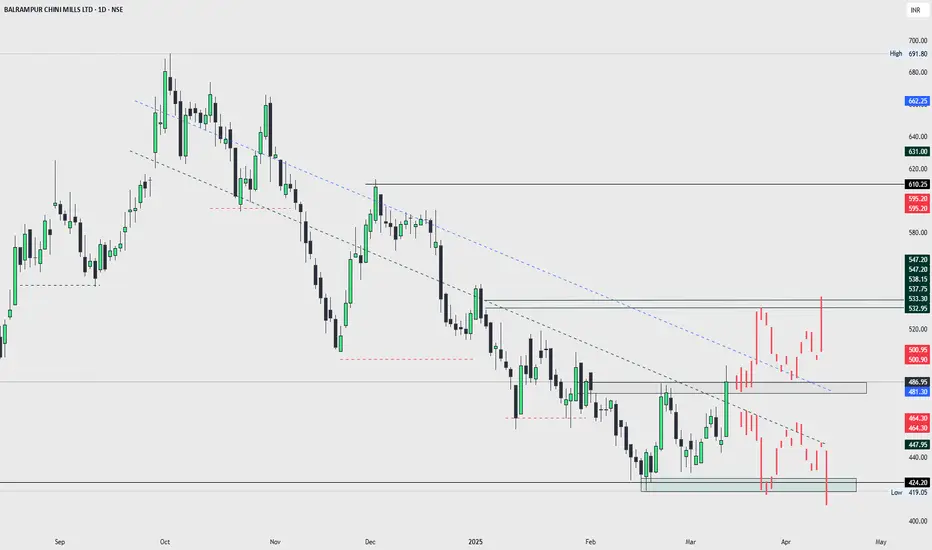
Balrampur Chini Mills Ltd | Breakout & Key Levels Analysis The stock has been in a downtrend for the past few months , respecting a descending trendline. However, recent price action shows a strong breakout above key resistance levels, indicating potential bullish momentum.
Key Observations:
✅ Breakout Above Trendline : Price has broken past the descending resistance, signaling a possible trend reversal.
✅ Retesting Supply Zone (532-538): The price is currently testing a critical supply area. A strong close above this could confirm further upside.
✅ Supports to Watch : Immediate support around 486-481, followed by major demand at 424-419 if weakness persists.
✅ Resistance Levels : Next hurdle around 547-550 before a potential rally toward 595-610.
📉 If rejection occurs at resistance, expect a pullback to retest breakout levels.
📈 If sustained buying continues, price could move towards higher resistance zones.
Nifty-14th Mar 2025 expiry looks highly volatile- interestingPossibly 14th March expiry looks highly volatile and typical fight is imagined due to long weekend (Friday Holiday).
As per OI data:
22400/22300 are support - 22300 is major support
22500/22600 are resistance - 22600 is major resistance
Max-pain - 22450
Nifty is in tight range for last couple sessions and not impacted much by global.
Yet, Nifty is looking mild bullish and short-term targets to test are 22700 to 22800 levels, then the US market recovered as of now.
Overall, might open gap-up and zigzag to levels of 22550/22640 and then could expect down fall 22400 levels or even below. Finally close could be around 22400/22450 as max-pain indicates. So, tomorrow's range looks to be 22300 to 22650 (almost 300 points range)
Reason for down fall from resistance -
1. one is of course weekly expiry
2. second is that usually, positions are not carried during long weekends hence possibility of wild moves to exit / book profits and preserve capital.
3. third is FIIs are still selling crazy in cash and futures - today 13th March too they sold futures 823 Cr. and Cash 1623 Cr. FII selling is continuous and around 2k cr. daily thus tomorrow too this selling pressure could continue. In addition, Nifty IT is not performing well lately, and pressure continues.
Disclaimer: I may be wrong, and market is supreme. This is not a trade advice or calls, just an idea and thoughts. Please exercise caution or due diligence or your own analysis.

Pearl Global Industries Ltd – Stock Worth Watching!🔹 Why is it Interesting?
✅ Uptrend Intact – Stock continues to move higher.
✅ Higher Highs & Higher Lows (HH-HL) Structure – Bullish price action remains strong.
✅ Respecting Trend Channel – Trading within an ascending channel, bouncing off key levels.
✅ Above Key Moving Averages (DMAs) – Staying strong above critical supports.
✅ Bullish Patterns Forming –
📍 Triple Bottom – A strong base for a potential breakout.
📍 VCP (Volatility Contraction Pattern) & Cup & Handle – Classic bullish setups on the daily timeframe.
🎯 Trading Plan
🔹 Entry: Small test position above ₹1500 on a daily close.
🔹 Safer Entry: Wait for a weekly close above ₹1500 for confirmation.
🔹 Stop-Loss (SL): ₹1162 (closing basis)
🔹 Risk per Trade: ₹1500 - ₹1162 = ₹338 (~22.53%)
🔹 Key Condition: Volume should improve—wait for a clean breakout.
📊 Key Fundamentals
💰 Market Cap: ₹6,842 Cr
📈 Stock P/E: 31.8
📊 ROCE: 21.4% | ROE: 21.9%
📊 Sales & EPS Improving YoY – Strong growth trend
⚠️ Why Small Position?
🚨 Market is in a downtrend – We are trading against the broader trend.
🚨 Deep SL (~22.53%) – If the market falls further, stop-loss might get hit.
🔥 Why Consider It?
👉 Stocks like these can be potential winners once the market stabilizes. Keeping it on the watchlist is worthwhile!
📊 Monitor price action closely before committing fully!

Nifty @ 22452 - Analysis 12-Mar-2025Resistance: 22589/22689
Support: 21955
Immediate support: 22313
If these resistances hold, nifty can retest 22255 and further 22220-22130 before big reveral.
Reversal from any of these levels 1st target 22689 and furhter 22800/23200, 23800.
As per my analysis bottom is already in place at 22955.

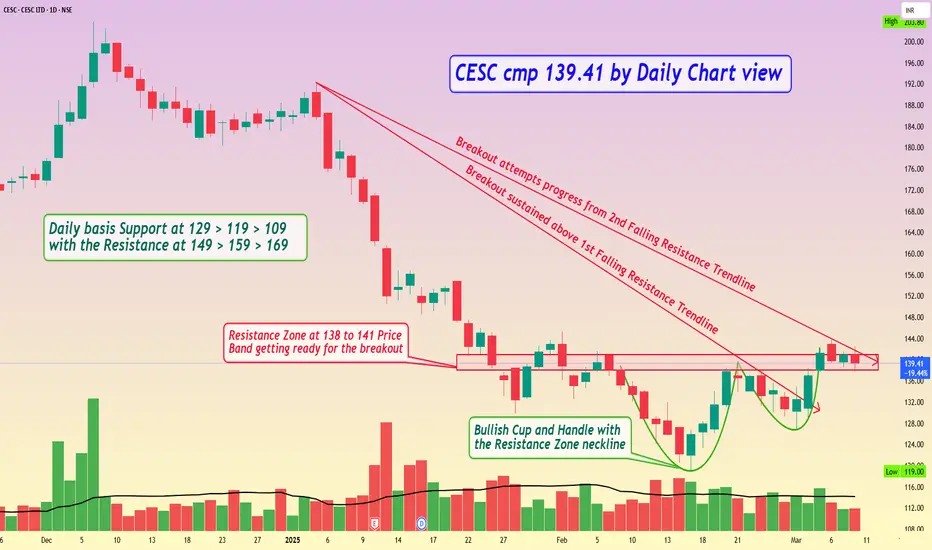
CESC cmp 139.41 by Daily Chart viewCESC cmp 139.41 by Daily Chart view
- Bullish Cup and Handle with the Resistance Zone neckline
- Breakout sustained above 1st Falling Resistance Trendline
- Breakout attempts progress from 2nd Falling Resistance Trendline
- Resistance Zone at 138 to 141 Price Band getting ready for the breakout
- Daily basis Support at 129 > 119 > 109 with the Resistance at 149 > 159 > 169
Elliott Waves Insights: Tesla’s Roadmap to SuccessHello friends, let's analyze Tesla's chart using theory. This is a 4-hour chart where we can clearly see that the higher degree, primary degree wave ((3)) in black has been completed. Currently, we're on the verge of completing wave ((4)) in black of the primary degree, which has three subdivisions marked in blue as (A), (B) & (C).
(A) and (B) are completed, and (C) is near completion. Within (C), we have five subdivisions in red, of which 1, 2, 3, & 4 are completed, and the 5th is also more than 60% complete. Once the red fifth is complete, it will mark the end of blue (C) and primary degree wave ((4)) in black.
As soon as wave ((4)) is complete, we can expect a reversal, which should be wave ((5)). Which should cross the high of wave ((3)) which is ATH, So, we're expecting wave ((5)) to start move upwards.
Now, friends, what's the invalidation level for this view? It's $139.20. This is a level that wave ((4)) should not cross, as it's the low of black wave ((2)). According to theory, wave 2 cannot retrace more than 100% of wave 1, wave 3 cannot be the shortest in impulse, and wave 4 cannot enter the territory of wave 1, which is here we’re witnessing in current scenario, which is considering we’re in any diagonal or triangle of higher degree.
If wave ((4)) crosses $139.20, it will invalidate our view. We might be missing some dots to join or create the picture perfectly. Currently, the price is around $222, and we might see a small bounce before making a lower low possibly around $200. If we witness a divergence there, it could lead to a reversal.
Please note that this study uses theory and structures, involves multiple possibilities, and focuses on one potential scenario. There's a risk of being completely wrong. This is for educational purposes only, and users should not trade or invest solely based on this study.
I am not Sebi registered analyst.
My studies are for educational purpose only.
Please Consult your financial advisor before trading or investing.
I am not responsible for any kinds of your profits and your losses.
Hope this post is helpful to community
Thanks
RK💕
Disclaimer and Risk Warning.
The analysis and discussion provided on in.tradingview.com/u/RK_Charts/ is intended for educational purposes only and should not be relied upon for trading decisions. RK_Charts is not an investment adviser and the information provided here should not be taken as professional investment advice. Before buying or selling any investments, securities, or precious metals, it is recommended that you conduct your own due diligence. RK_Charts does not share in your profits and will not take responsibility for any losses you may incur. So Please Consult your financial advisor before trading or investing.

Positional or Longterm Opportunity in ABBGo Long @ 5432.1 for Targets of 6510, 7015, 7520, and 8024.7 with SL 439.15
Reasons to go Long :
1. On a Weekly timeframe if we draw the Fibonacci retracement tool from the recent swing low (point A) to the recent swing high (point B) then we see stock took support from the 0.5 Fibonacci level.
2. Besides, a bullish candlestick pattern Bullish Engulfing (marked with orange) is formed around the 0.5 Fibonacci level.
3. In addition to this there is a strong demand zone (marked with purple) which earlier was acting like resistance but now is providing support to the stock.

Coforge-A perfect watchlist stock!Coforge is an IT services company providing end-to-end software solutions and services and is among the top-20 Indian software exporters according to Screener data. Stock has give 20% compounded sales growth in last 5 years which is quite remarkable.
Hence, It can be a good stock to be kept in watchlist for medium to long term.
Stock had given breakout of cup and handle pattern in weekly time frame and is now retesting the same.
Stock has formed a kind of morning star pattern at the retest support zone. Need to watch if it sustains above this zone.
As you can see, retest zone also coincides with 50% fib retracement which makes it even stronger.
If we see good buying in this stock from here, we can see ATH levels soon and even bigger levels in coming years.
However, If stock goes below 61.8% retracement, it is not advisable to hold.

Triveni Turbine - Chart of the Week NSE:TRITURBINE has a beautiful structure on the Weekly Timeframe to Qualify for my Chart of the Week idea, it saw Decent Volumes around the marked Key Levels which is 0.786% Fib Retracement Levels and also a Rising trendline which has been defending since June 2022 Several Times.
About:
NSE:TRITURBINE primarily manufactures and supplies power-generating equipment and solutions. It was a division of NSE:TRIVENI since the 1970s and was demerged w.e.f from Oct 2010 into a separate entity.
Trade Setup:
Could be a good Positional Trade with the Rising Trendline Being a Major Support along with FIb Levels.
📌Thank you for exploring my idea! I hope you found it valuable.
🙏FLLOW for more
👍BOOST if useful
✍️COMMENT Below your views.
Meanwhile, check out my other stock ideas on the right side until this trade is activated. I would love your feedback.
Disclaimer: "I am not SEBI REGISTERED RESEARCH ANALYST AND INVESTMENT ADVISER."
This analysis is intended solely for informational and educational purposes only and should not be interpreted as financial advice. It is advisable to consult a qualified financial advisor or conduct thorough research before making investment decisions.

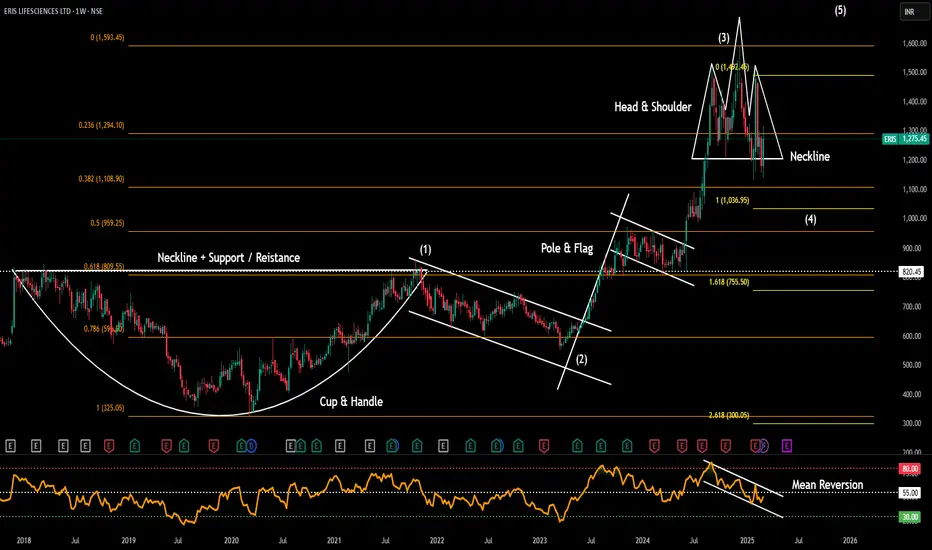
ERIS LifesciencesDate 08.03.2025
ERIS Lifesciences
Timeframe = Weekly Chart
Technical Remarks :
1 Currently under corrective phase of wave 4. A three wave pattern.
2 Neckline at 1203
3 Next swing support/breakdown areas are 1203 / 1141 / 1036 (100%) & 1108 (38%)
4 If someone is under long position keep neckline as strict stoploss on daily or weekly basis
5 Below neckline do not try to bottom fish or average or follow any moving average
Some Key Highlights About The Company :
Stock P/E 52.7 II ROCE 11.3 % II ROE 16.3 % II OPM 34% II
Region-Wise Sales Mix
South India: 35%
West India: 30%
North India: 16%
East India: 15%
Latest Development On March 6th 2025 :
Eris Lifesciences sells its entire stake in two of its subsidiaries to Eris Therapeutics for Rs 861.9 crore
Regards,
Ankur
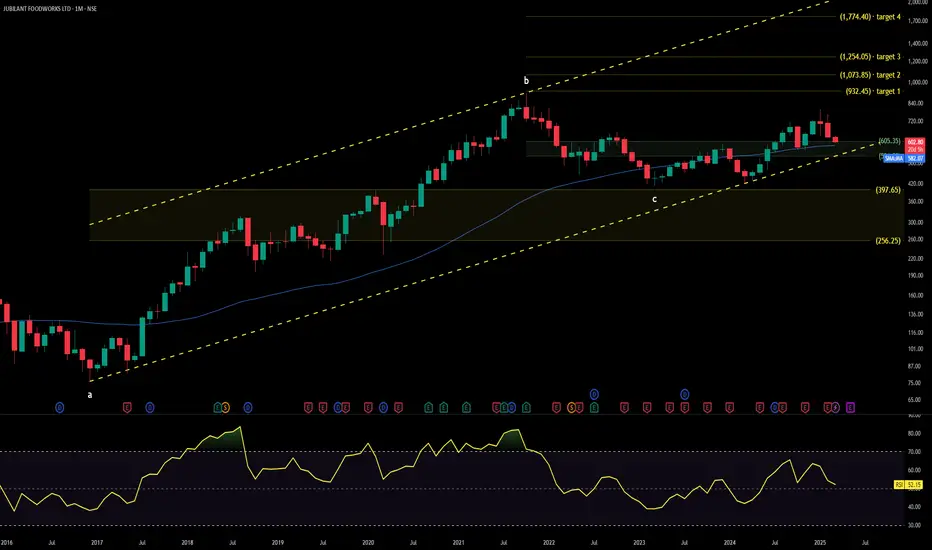
pizza in the oven JUBILANT FOODWORKS📊 Deep Dive into Jubilant FoodWorks Ltd. Excited to share my latest analysis of Jubilant FoodWorks Ltd., exploring its journey, market position, and potential growth trajectory. The food service sector remains a dynamic space, and this detailed report provides key insights to help traders and investors make informed decisions.
Your feedback and perspectives are always valuable—let's navigate the market together! 🚀
TOMATO - Ready to be squeezed?TF: Daily
Looks like 5th wave is in progress
4th Triangle seems to have matured..
Harmonic Bullish Shark Pattern seems to be in play
DEATH CROSS is seen (50 DEMA Cutting Down 200 DEMA)
Price is getting rejected at the cloud bottom
But 5th being 5th, we cant exactly predict the bottom here.. it could terminate anywhere below previous low.. Trail SL carefully.
We are approaching the bottom on this leg down.. that is for sure..
I am not a SEBI registered Analyst. Views are personal and for educational purpose only. Please consult your Financial Advisor for any investment decisions. Please consider my views only to get a different perspective (FOR or AGAINST your views). Please don't trade FNO based on my views. If you like my analysis and learnt something from it, please give a BOOST. Feel free to express your thoughts and questions in the comments section.

Amber Enterprises Breaks Out from Double Bottom – Bullish ViewHello Everyone , i hope you all will be doing good in your life and your trading as well. Today i have brought a trading idea on the double bottom chart pattern. Stock name is Amber Enterprises. So let's start guy's
Amber Enterprises (NSE) has given a strong bullish breakout from a double bottom pattern on the daily chart, indicating a potential trend reversal . The breakout has been accompanied by strong volume , confirming buyers’ dominance at current levels. If the stock sustains above the entry zone of 6190-6135, it could gain further momentum towards the first target of 6663, followed by 7171, and a long-term target of 8094. A stop loss should be placed below 5473 to manage risk effectively. This setup presents a good risk-to-reward opportunity for swing traders, but proper risk management is crucial before entering the trade.
Fundamental Ratios
Market Cap
₹ 20,886 Cr.
Current Price
₹ 6,175
High / Low
₹ 8,177 / 2,991
Stock P/E
94.0
Book Value
₹ 624
Dividend Yield
0.00 %
ROCE
10.2 %
ROE
6.74 %
Face Value
₹ 10.0
Industry PE
42.4
Debt
₹ 2,032 Cr.
EPS
₹ 65.9
Promoter holding
39.7 %
Intrinsic Value
₹ 1,819
Return over 5years
33.5 %
Debt to equity
0.96
Net profit
₹ 232 Cr.
Disclaimer: This analysis is for educational purposes only. Please consult a financial advisor before making investment decisions.
If you Found this helpful? Don’t forget to like, share, and drop your thoughts in the comments below.
